House Cool-Down and Warm-Up Time Calculator
 Wired White v1
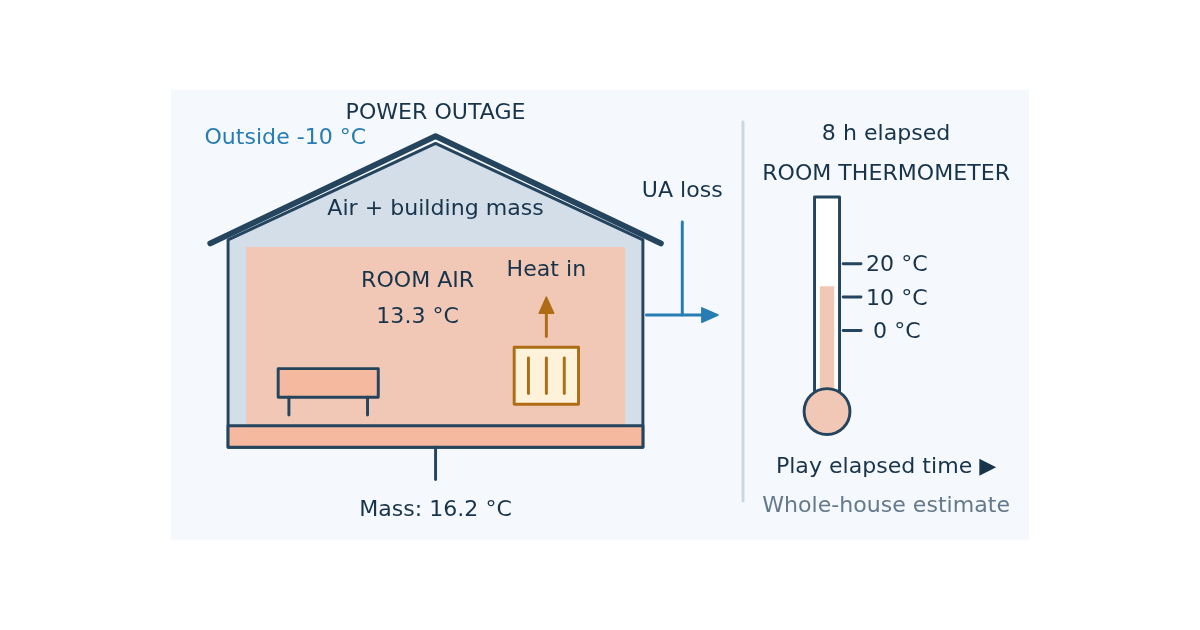
Estimate how long a house stays warm without power, cold-house heating time, and heat-pump night-setback savings with a two-node air and building-mass model.
Calculators by WiredWhite engineers: inputs, formulas you can read, results, charts and drawings, checked against reference cases. They run in your browser.
Wired White v1 Estimate how long a house stays warm without power, cold-house heating time, and heat-pump night-setback savings with a two-node air and building-mass model.
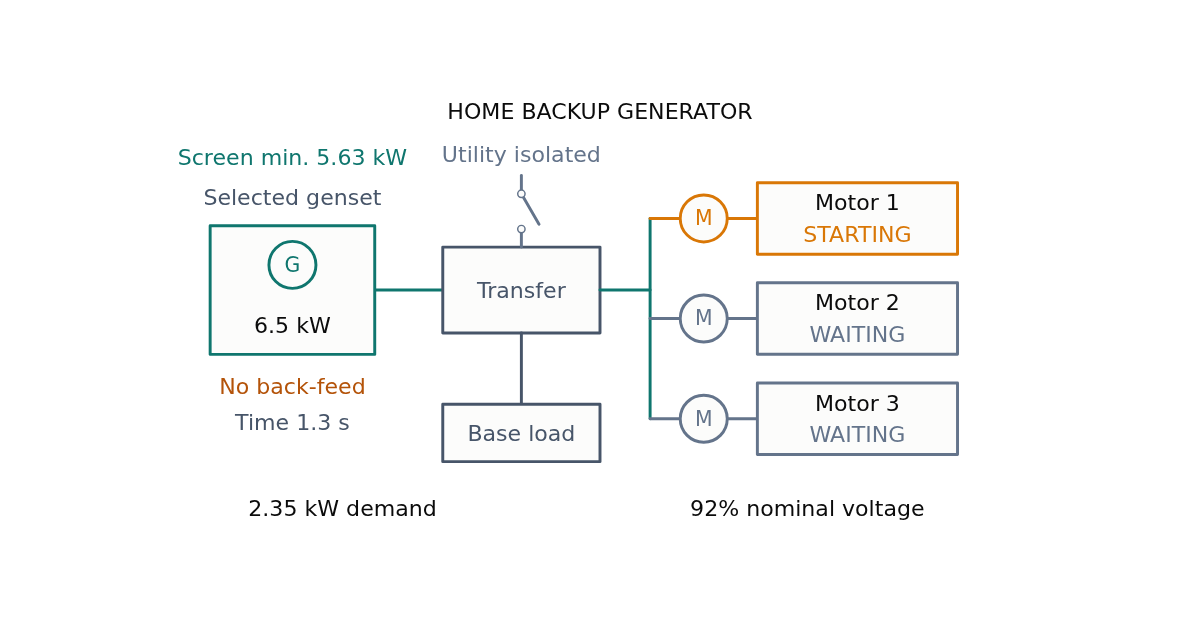
Wired White v1 Size a home generator for running loads, sequenced motor starts, voltage dip and site derating. Estimate part-load fuel use, monthly cost and a conditional solar–battery cost crossover.
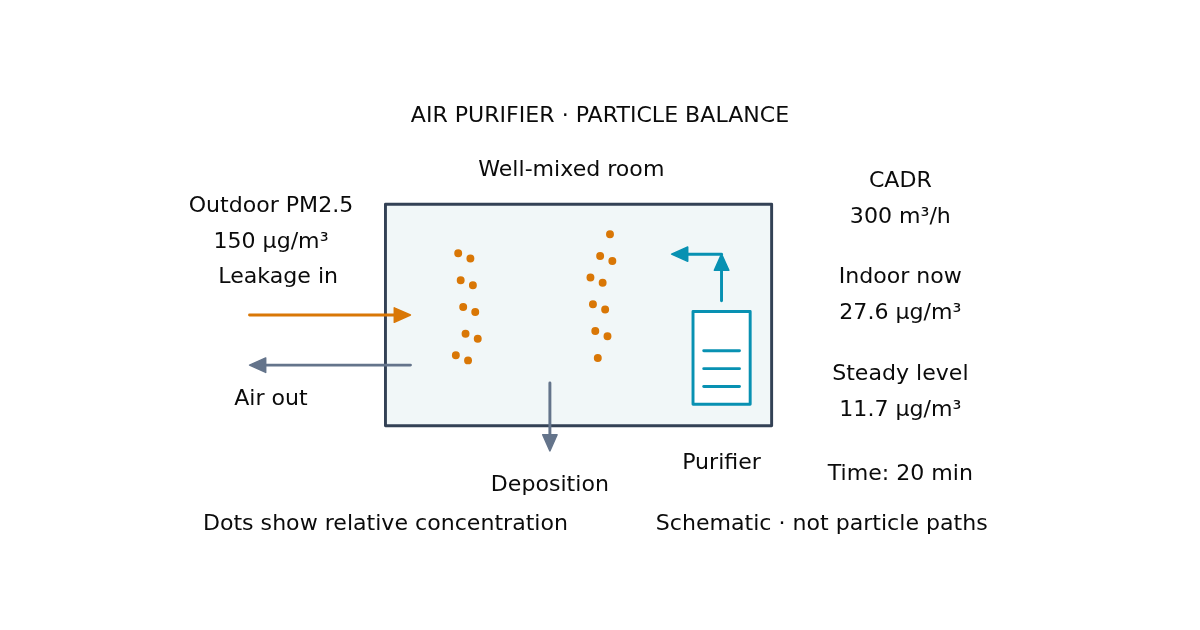
Wired White v1 Size a purifier and estimate indoor PM2.5 with outdoor leakage, deposition and indoor sources. See the steady level, cleaning time and animated particle balance.
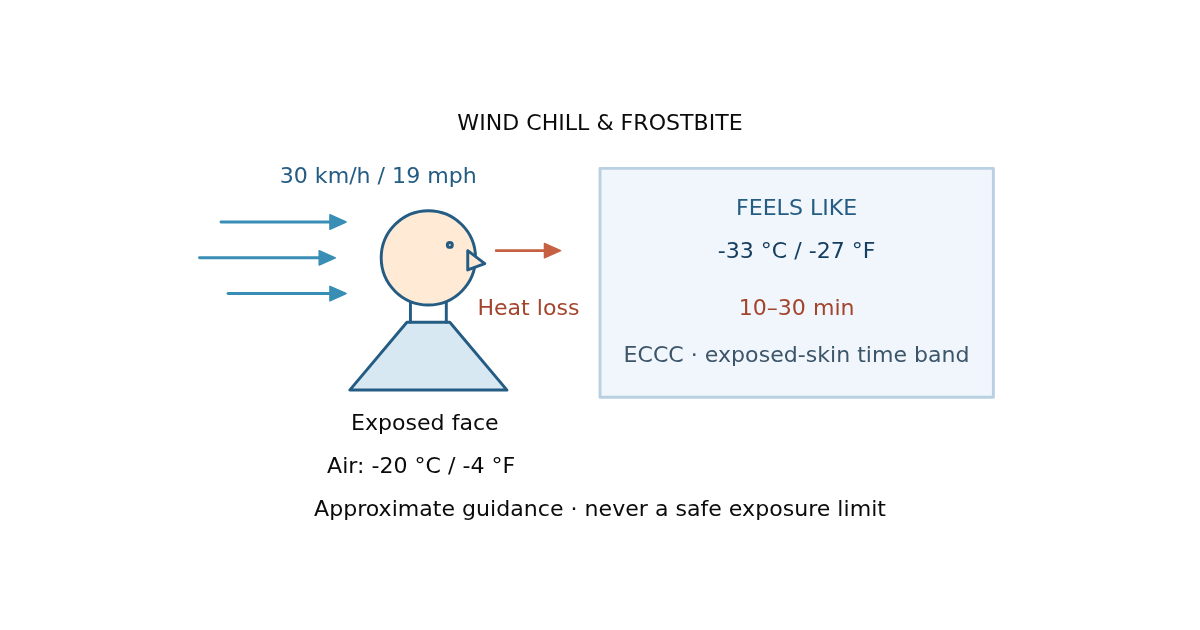
Wired White v1 Calculate wind chill and approximate exposed-skin frostbite bands. Explore how temperature and wind change winter cold risk with an animated chart.
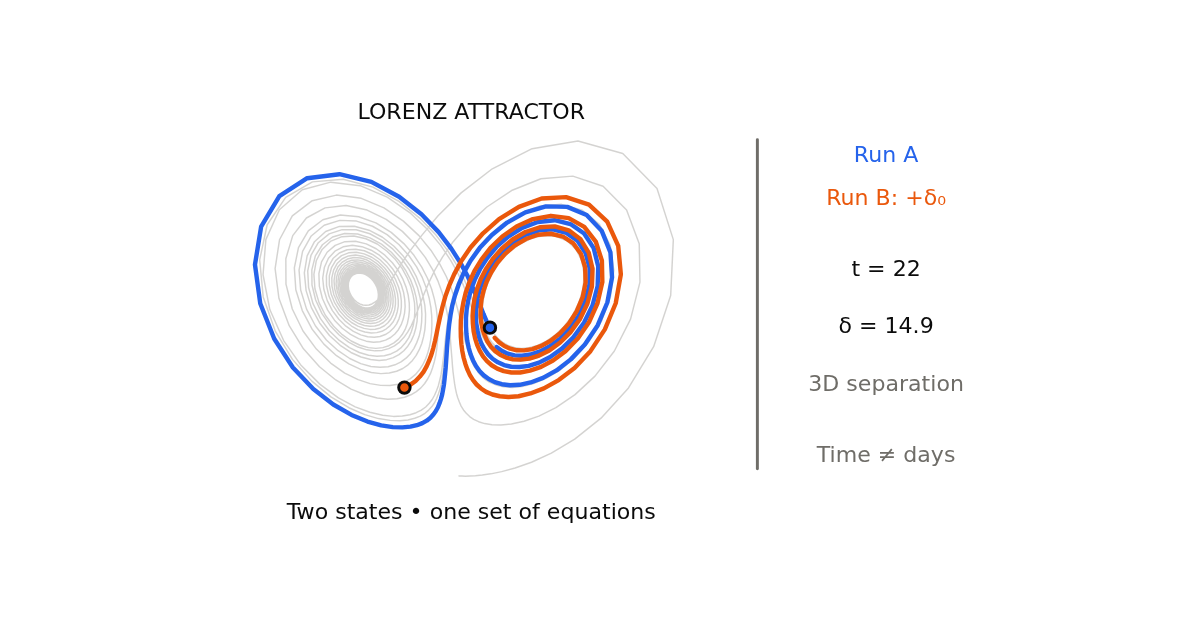
Wired White v1 Explore the butterfly effect with two nearly identical Lorenz-63 trajectories. Animate their divergence and learn what the model reveals about weather predictability.
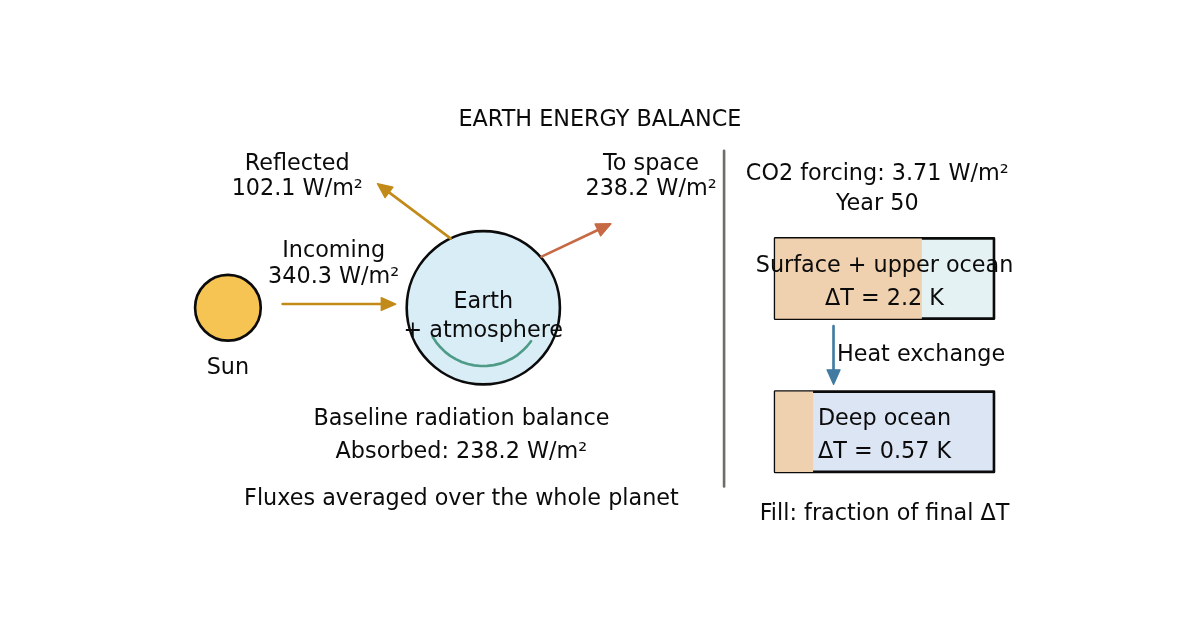
Wired White v1 Explore Earth's radiation balance, CO2 forcing, ocean warming and ice-albedo hysteresis with three linked teaching models, animated transients and sourced checks.
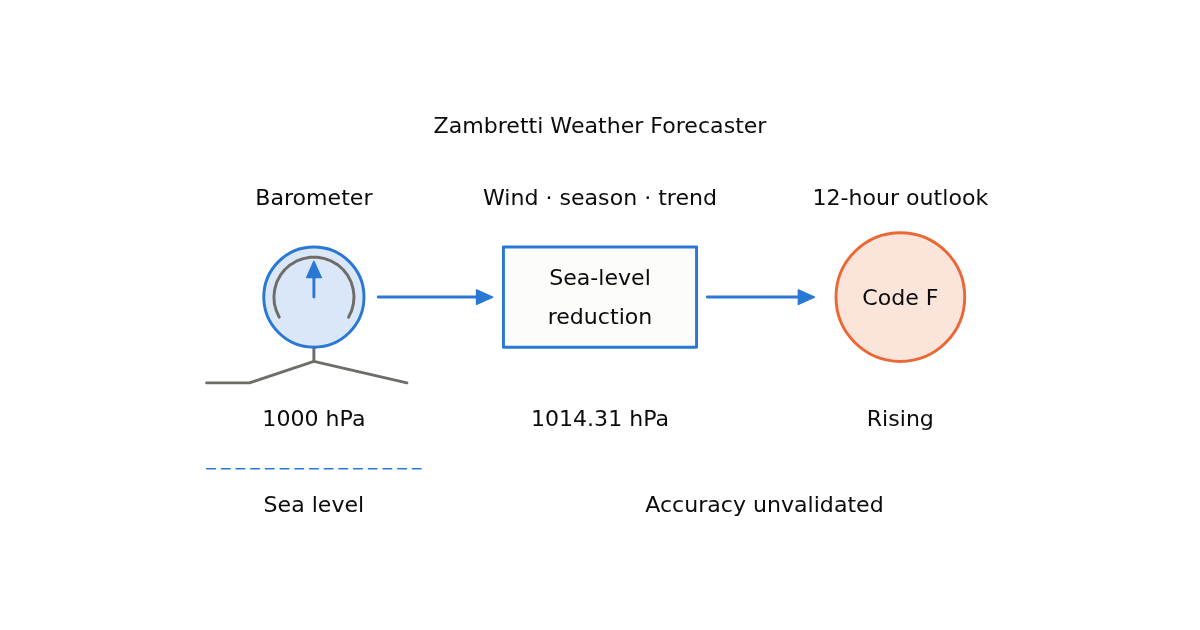
Wired White v1 Estimate a 12-hour weather outlook from pressure, its 3-hour trend, wind and season. Includes sea-level reduction and clearly stated accuracy limits.
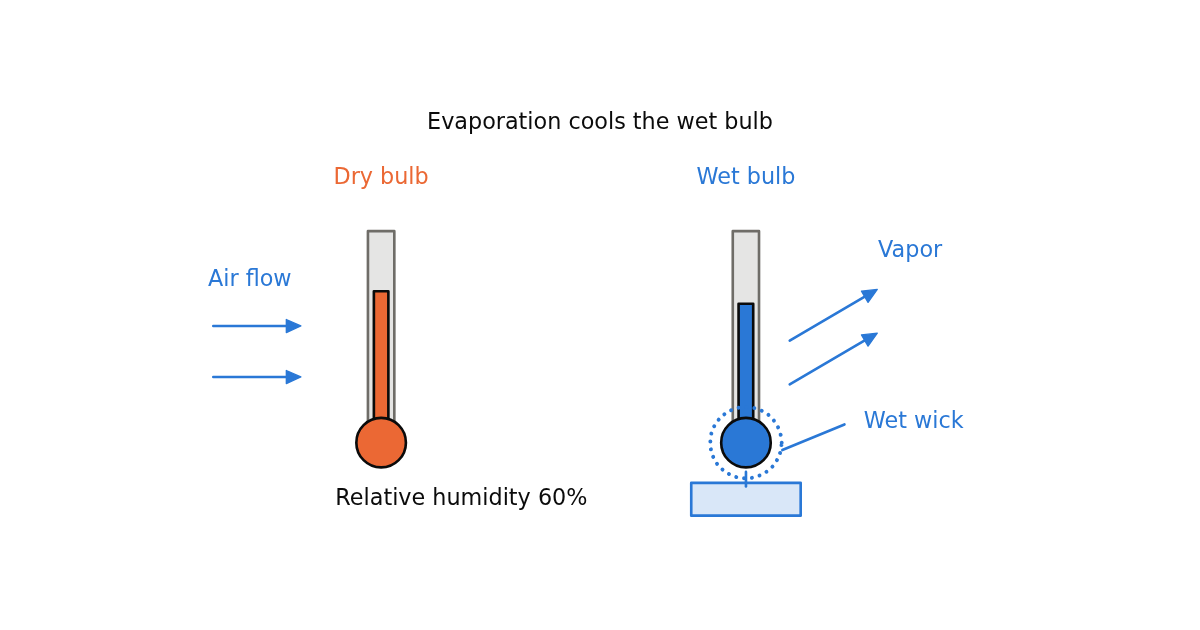
Wired White v1 Calculate wet-bulb temperature, dew point, NWS heat index and wind chill. Estimate WBGT from local wind and sunlight, with Japanese heat-risk bands.
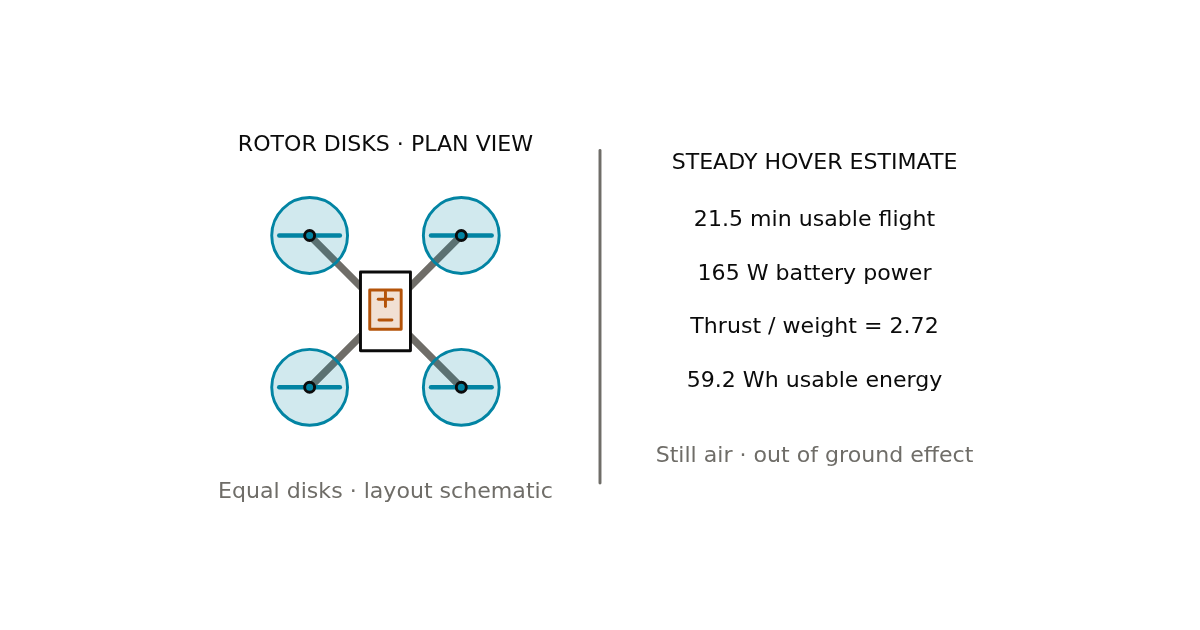
Wired White v1 Estimate multicopter hover time from battery energy and rotor physics. Check thrust-to-weight ratio and payload limits for a chosen endurance target.
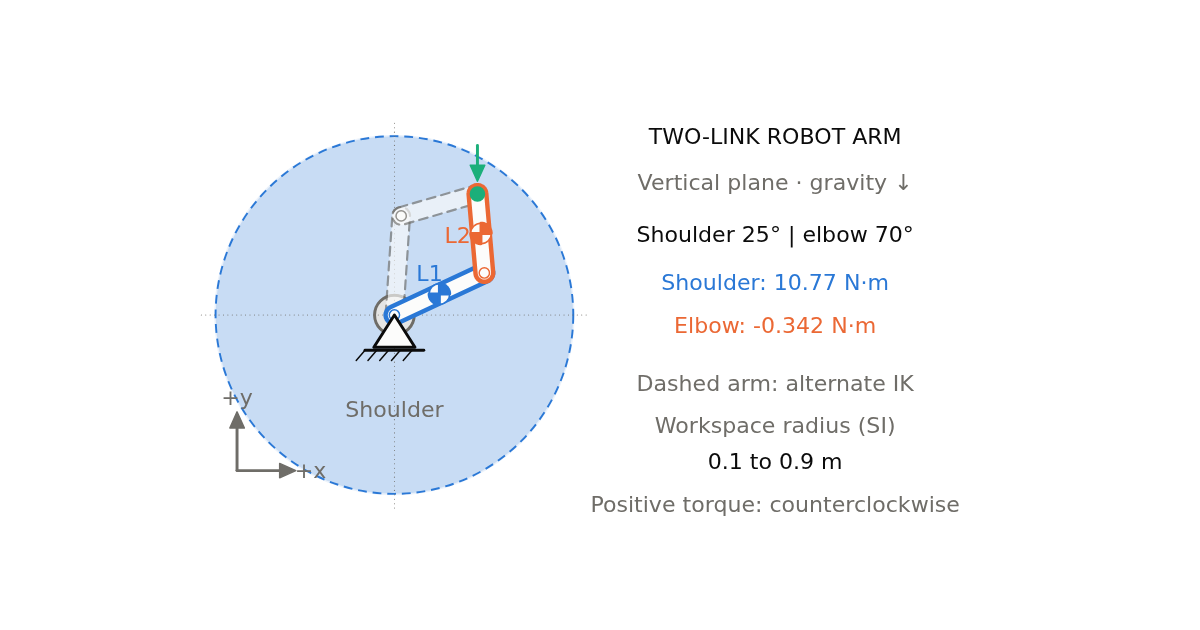
Wired White v1 Solve forward and inverse kinematics for a planar two-link arm, compare elbow up/down, and calculate static joint torques from link masses and payload.
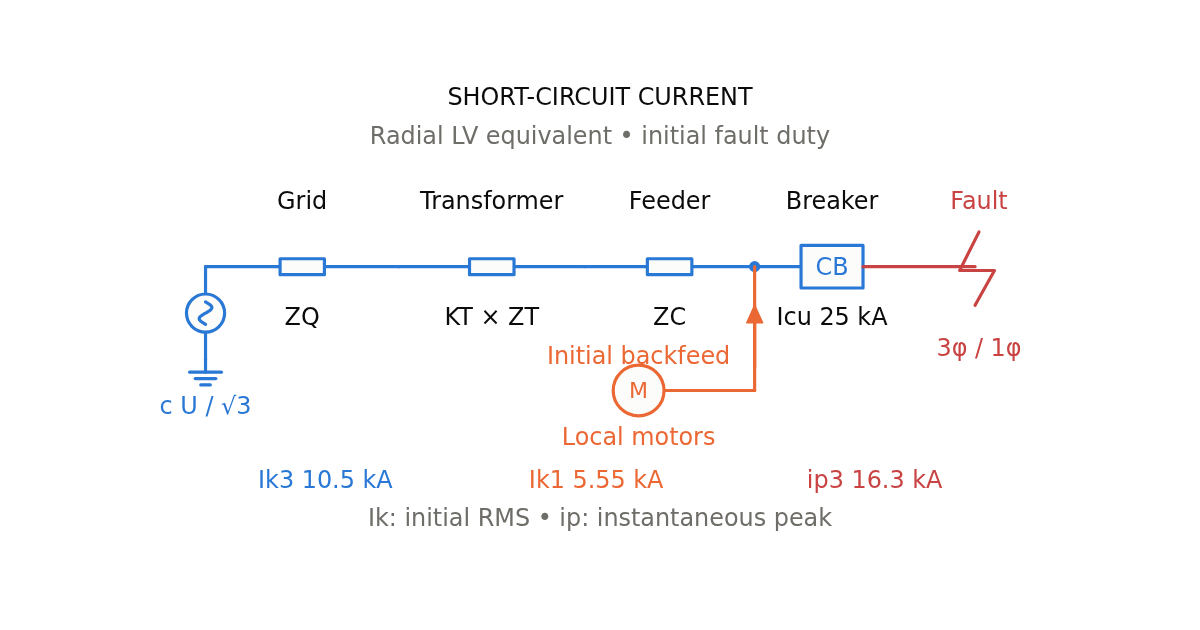
Wired White v1 Estimate three-phase and single-phase fault current, motor backfeed and peak current using a simplified IEC 60909 impedance model. Compare duty with breaker capacity.
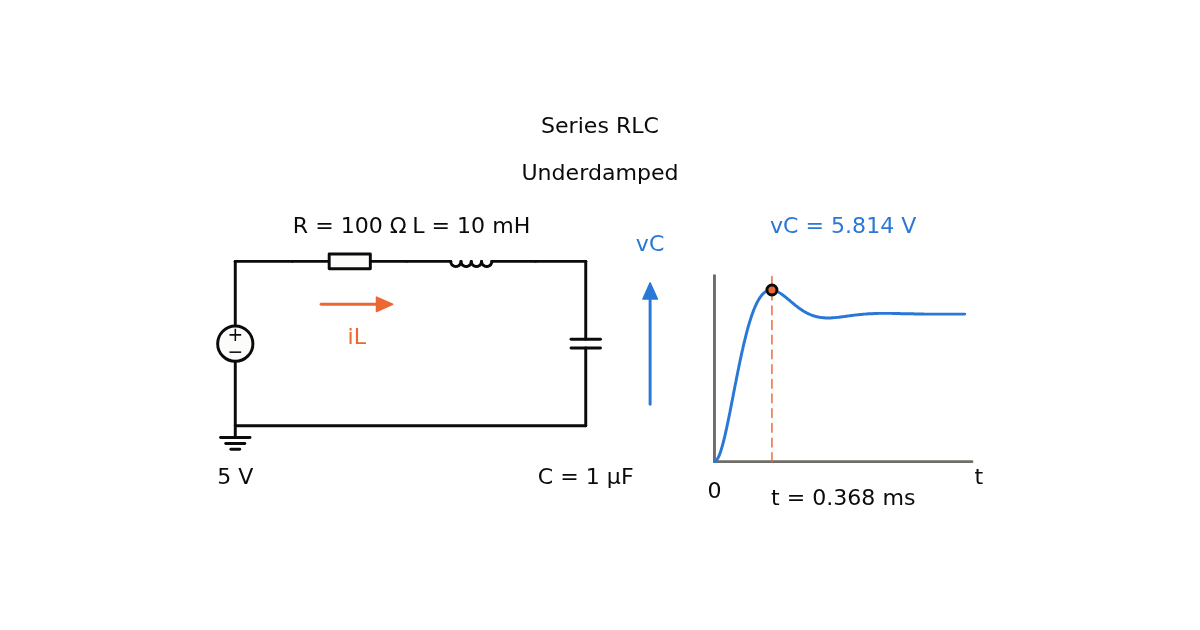
Wired White v1 Calculate RC, RL, and series or parallel RLC step responses, Bode plots, resonance, Q, and damping. Animate the transient and inspect voltage and current.
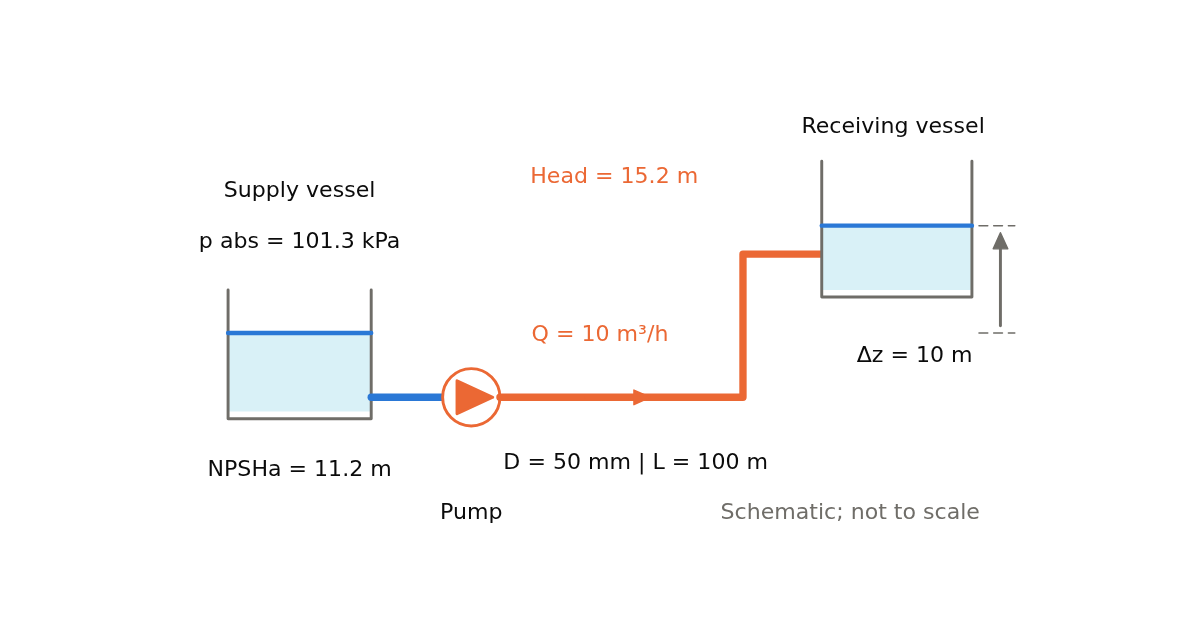
Wired White v1 Calculate pipe pressure drop, pump head, shaft power and NPSHa with Darcy–Weisbach. Compare system and pump curves using Colebrook or Swamee–Jain friction factors.
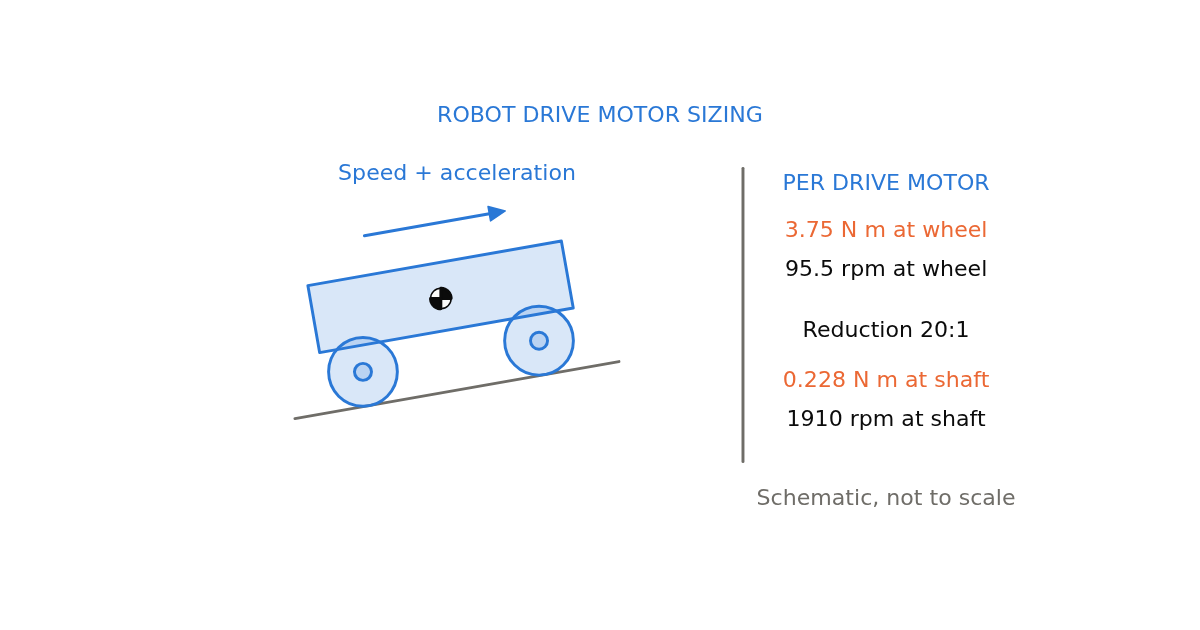
Wired White v1 Size wheel and motor torque, speed, reduction ratio and battery energy for an uphill wheeled robot. Check traction and compare a candidate motor at its loaded operating point.
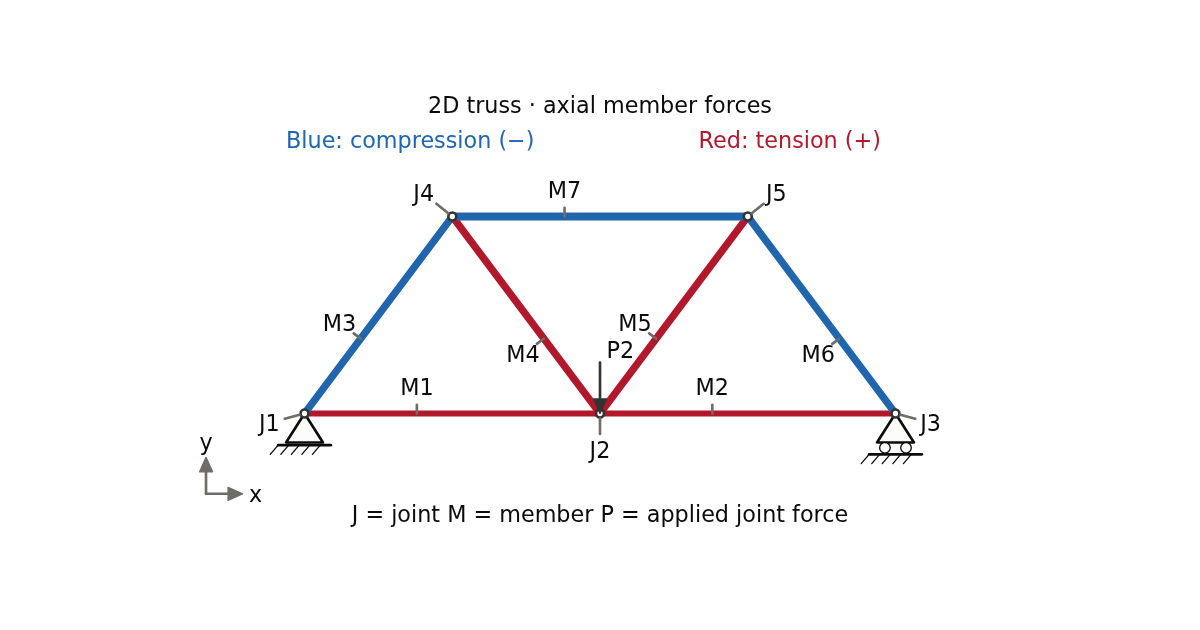
Wired White v1 Analyze 2D pin-jointed trusses by the direct stiffness method. Calculate member forces, stresses, support reactions and joint displacements with force-coloured diagrams.
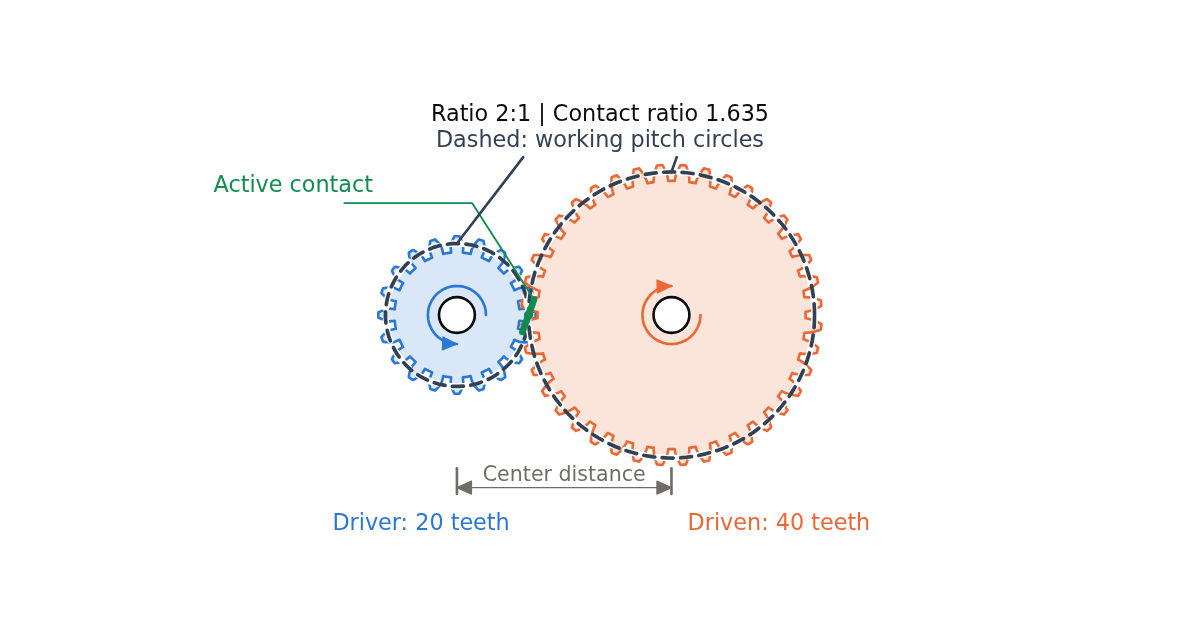
Wired White v1 Calculate gear-train ratio, speed and torque; inspect a rotating involute spur pair with profile shift and contact ratio, then compare road speed by gear.
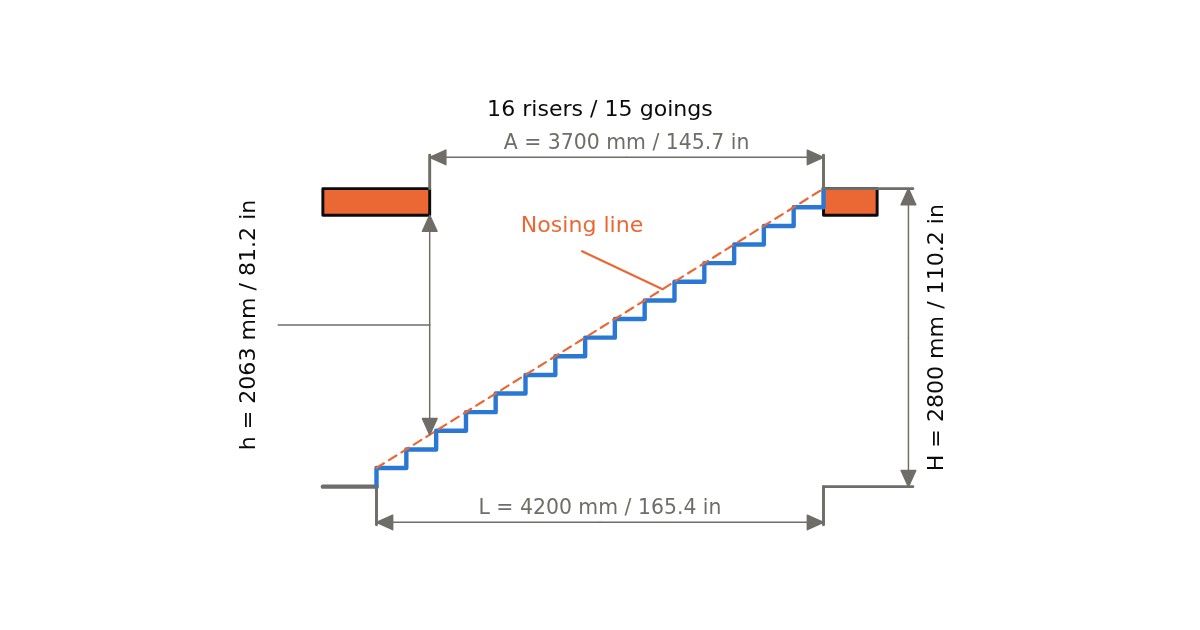
Wired White v1 Calculate stair rise, going, pitch, stringer layout length and headroom from total rise and run. Compare riser counts with explicit IRC or DIN dimensional checks.
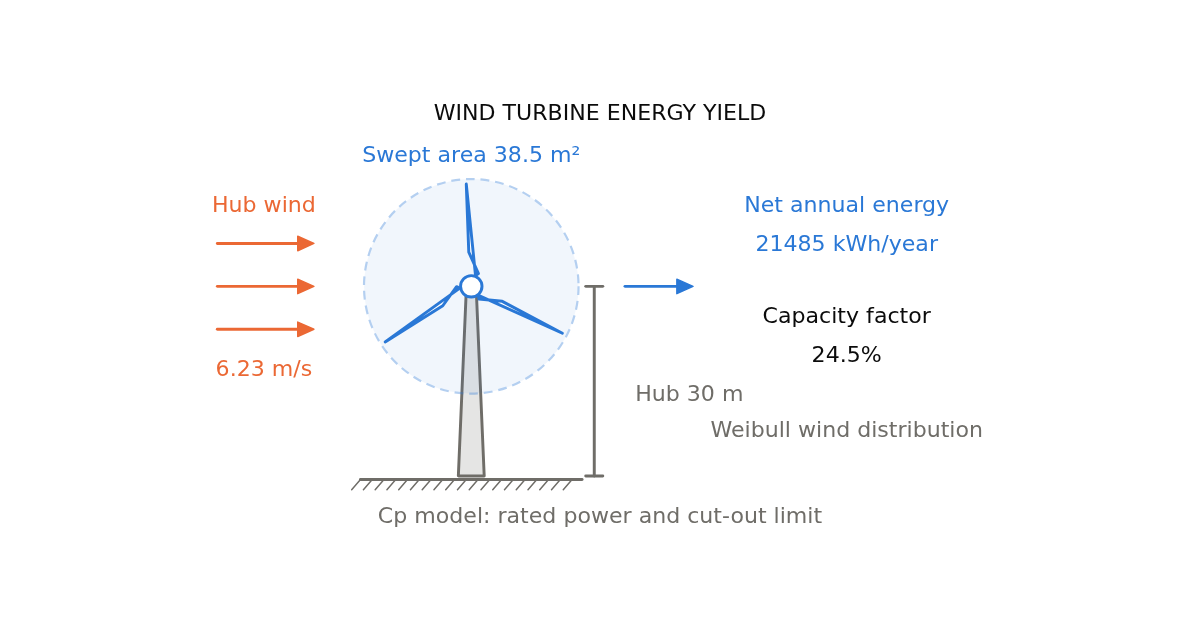
Wired White v1 Estimate annual wind turbine energy and capacity factor using Weibull winds, hub-height shear, and a Cp model or measured power curve. Include availability and site losses.
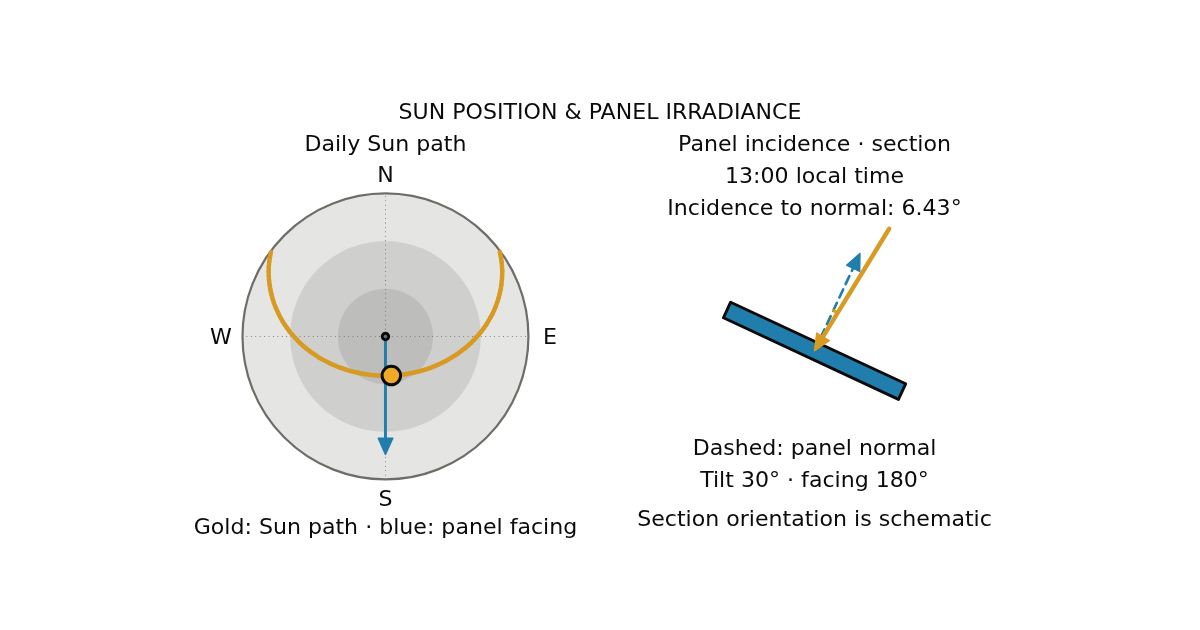
Wired White v1 Find solar elevation, azimuth and clear-sky irradiance on a tilted panel. Animate the sun path, compare panel tilts and estimate daily incident solar energy.
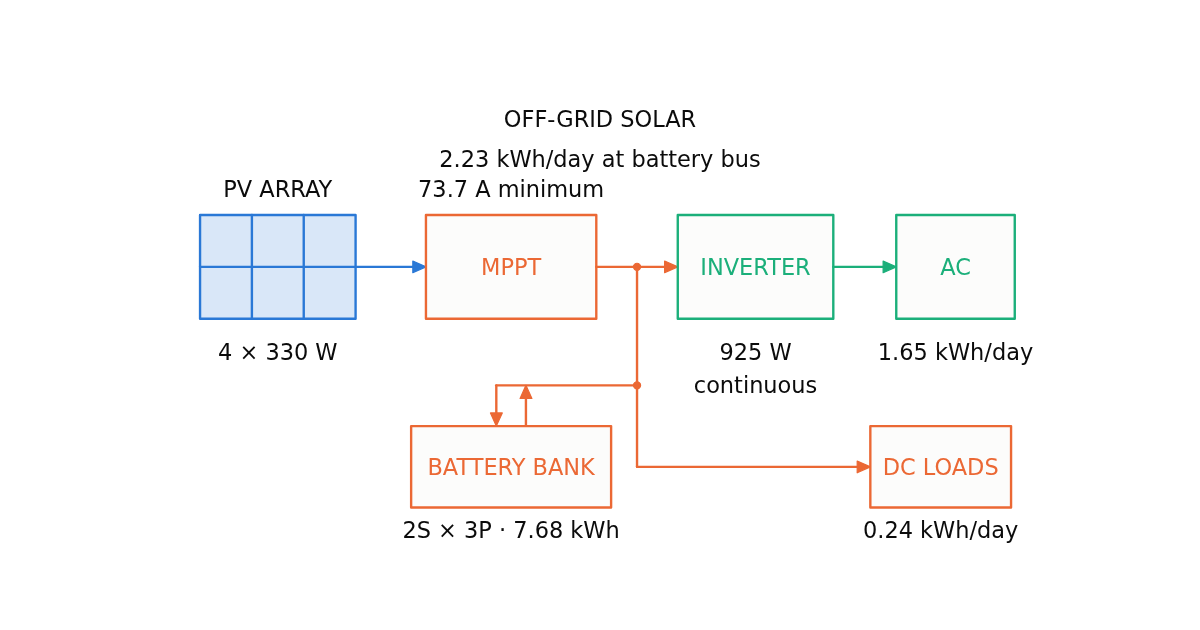
Wired White v1 Size an off-grid solar array, battery bank, MPPT or PWM controller and inverter from daily loads, sunless days and worst-month peak sun hours.
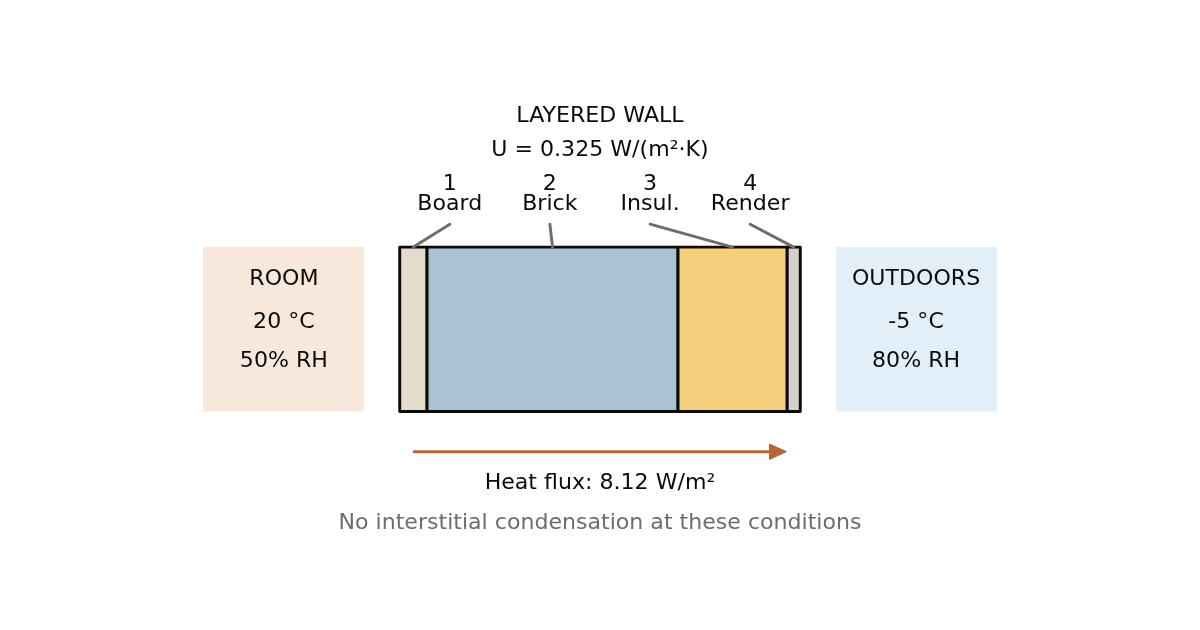
Wired White v1 Calculate a layered wall’s U-value, insulation thickness and condensation risk. See temperature, dew-point and Glaser vapour-pressure profiles through the wall.
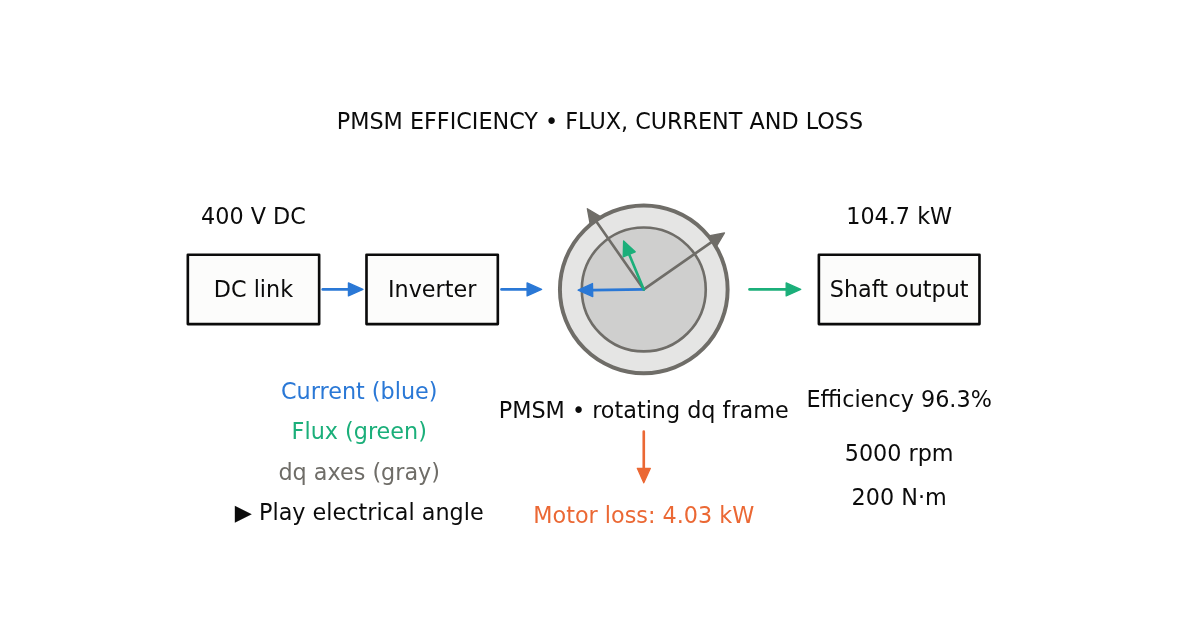
Wired White v1 Calculate a minimum-loss PMSM efficiency map from public nonlinear flux and loss data. Explore current and voltage limits, MTPA/MTPV guides, scaling and optional PWM losses.
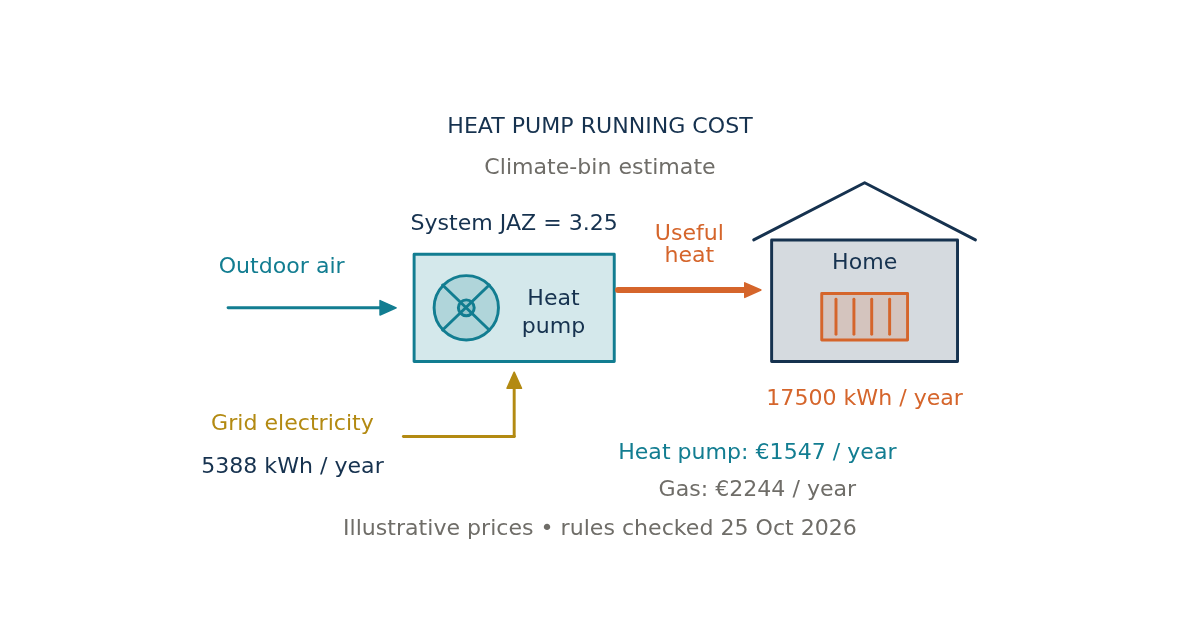
Wired White v1 Estimate heat-pump electricity from climate and flow temperature or a supplied JAZ. Compare gas, oil and kerosene costs with dated German tariffs and carbon-price scenarios.
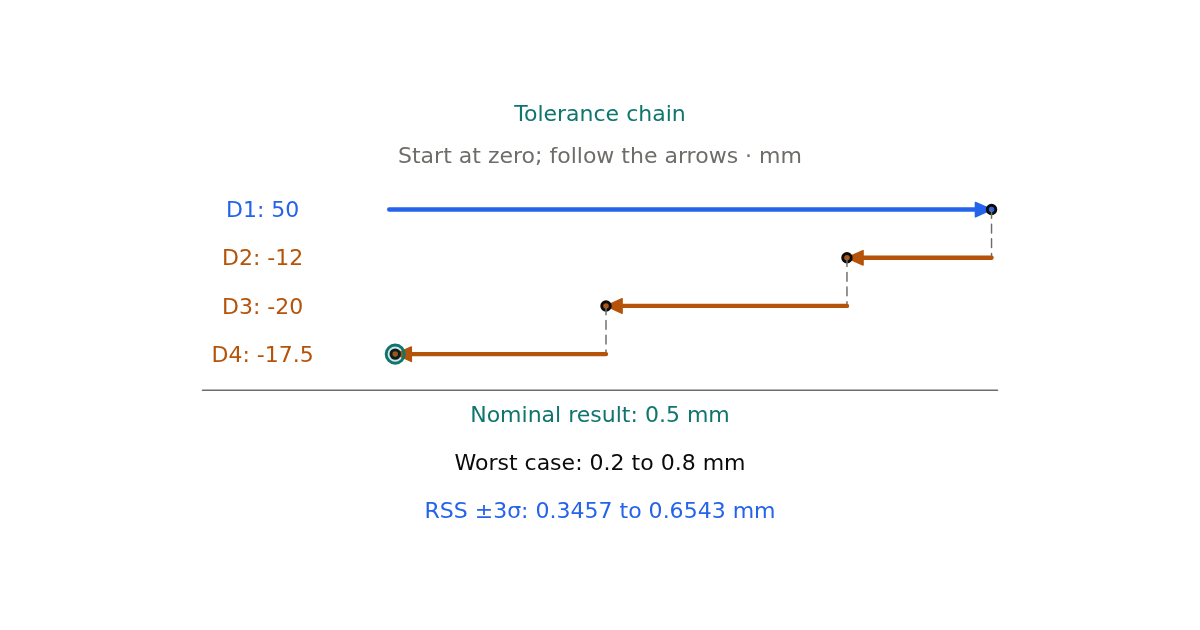
Wired White v1 Analyze a signed 1D dimension chain with worst-case limits, RSS and seeded Monte Carlo. Compare assembly yield and identify the tolerances that dominate variation.






Please confirm you want to block this member.
You will no longer be able to:
Please allow a few minutes for this process to complete.