

An Intelligent GPS Tracking and Route Analysis Framework Using State-Space Modeling Using Matlab

Author : Waqas Javaid
Abstract
This paper presents the design and implementation of an advanced GPS Data Logger and Route Analyzer capable of transforming raw positioning signals into meaningful motion intelligence. The system integrates geodetic coordinate conversion based on the WGS84 model to convert latitude and longitude data into a local East-North-Up (ENU) reference frame for precise spatial analysis [1]. A state-space Kalman filtering framework is applied to reduce measurement noise and improve trajectory accuracy. The proposed model further estimates velocity and acceleration to characterize motion dynamics in real time. Heading and curvature calculations enable route geometry assessment, while elevation profiling and grade estimation provide terrain awareness [2]. A robust stop-detection algorithm identifies stationary intervals using speed thresholds. Additionally, frequency-domain analysis using Fast Fourier Transform (FFT) reveals periodic motion patterns in speed behavior. Synthetic GPS data is used to validate system robustness and analytical consistency [3]. The results demonstrate significant improvement in trajectory smoothness and motion parameter reliability after filtering. The framework offers a scalable and high-precision solution suitable for intelligent transportation systems, mobility analytics, and geospatial research applications [4].
Introduction
Global navigation technologies have transformed the way movement, transportation, and logistics are monitored in modern society.
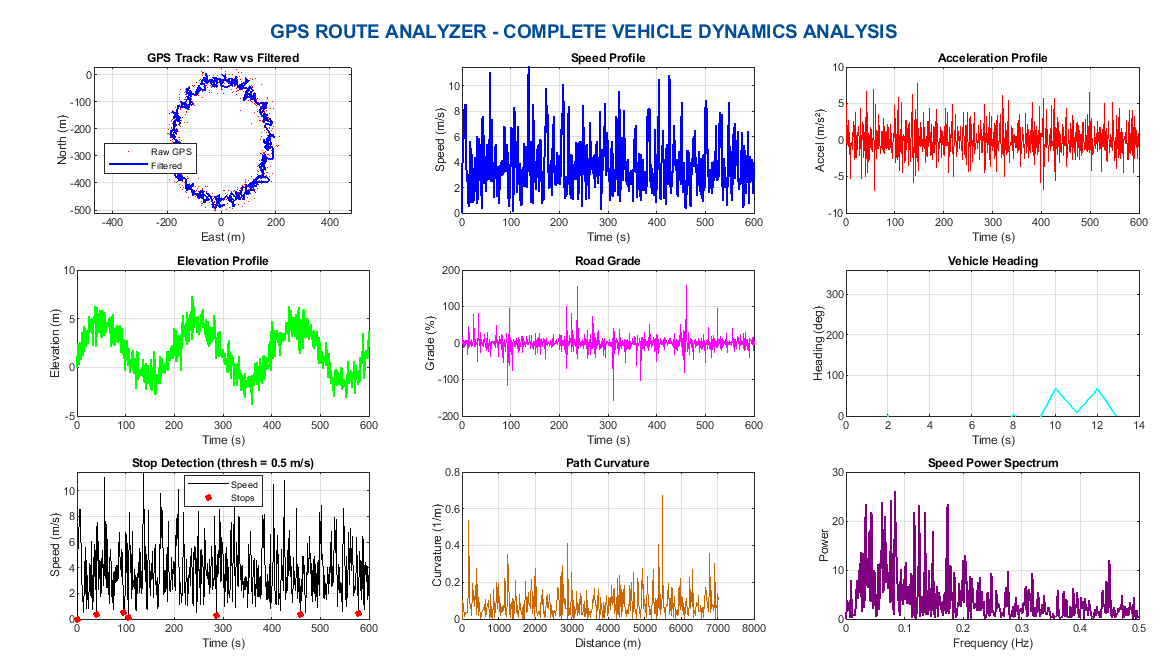
Figure 1 is an overview of Global Positioning System (GPS) plays a critical role in navigation, tracking, mapping, and intelligent transportation systems. However, raw GPS measurements are inherently noisy due to satellite geometry, atmospheric disturbances, multipath effects, and receiver limitations [5]. This noise often reduces positional accuracy and affects derived motion parameters such as speed, heading, and acceleration. To extract meaningful insights from raw positioning signals, advanced signal processing and state estimation techniques are required. A GPS Data Logger and Route Analyzer provides a structured framework to process, filter, and interpret geospatial data efficiently [6]. By converting geodetic coordinates into a local reference frame, spatial movement can be analyzed with improved numerical stability and interpretability. The integration of WGS84-based coordinate transformation ensures global consistency and engineering precision. Furthermore, state-space modeling combined with Kalman filtering significantly enhances trajectory reconstruction by minimizing measurement uncertainty.
Table 1: Motion Parameters
| Time (s) | Speed (m/s) | Acceleration (m/s²) | Heading (rad) |
| 0 | 69.423 | -45.737 | 2.502 |
| 1 | 23.686 | -22.235 | 2.308 |
| 2 | 24.954 | -2.990 | 0.095 |
| 3 | 17.706 | 5.571 | 2.372 |
| 4 | 36.096 | 9.960 | 3.549 |
| 5 | 37.626 | -3.512 | 5.385 |
| 6 | 29.073 | -13.033 | 5.739 |
| 7 | 11.559 | 6.195 | 5.628 |
| 8 | 41.463 | 13.102 | 7.963 |
| 9 | 37.763 | -10.106 | 8.421 |
| 10 | 21.251 | -1.060 | 10.736 |
| 11 | 35.644 | -4.887 | 11.717 |
| 12 | 11.477 | 0.677 | 11.772 |
| 13 | 36.997 | -0.387 | 8.835 |
| 14 | 10.702 | -3.691 | 7.569 |
| 15 | 29.615 | 6.692 | 5.025 |
| 16 | 24.087 | -2.271 | 6.534 |
| 17 | 25.072 | -2.123 | 6.398 |
| 18 | 19.840 | 0.558 | 4.349 |
| 19 | 26.188 | -2.881 | 1.473 |
Table 1 providing us a motion parameters in which accurate velocity and acceleration estimation enables dynamic motion analysis for vehicles and mobile systems [7]. Heading and curvature computation further allow route geometry characterization, which is essential for navigation intelligence. Elevation profiling and grade estimation contribute to terrain-aware mobility analysis. Stop detection algorithms provide behavioral segmentation useful for fleet management and traffic studies. In addition, spectral analysis of speed signals reveals periodic motion patterns and driving behavior characteristics [8]. Such a comprehensive analytical framework supports applications in smart transportation, autonomous systems, geospatial research, and performance monitoring [9]. The growing demand for precision mobility analytics makes robust GPS data processing increasingly important. This study presents an integrated, high-accuracy GPS route analysis framework that transforms raw satellite data into actionable motion intelligence through systematic modeling and advanced computational techniques [10].
1.1 Background of GPS Technology
The Global Positioning System (GPS) has become one of the most transformative technologies in modern navigation and mobility monitoring. Originally developed for military applications, it is now widely used in civilian transportation, logistics, mapping, agriculture, and personal navigation devices. GPS operates through a constellation of satellites that transmit time-stamped signals to receivers on Earth. By calculating signal travel time, receivers determine their geographic position in terms of latitude, longitude, and altitude.
Table 2: Raw GPS Coordinates
| Time (s) | Latitude (deg) | Longitude (deg) | Altitude (m) |
| 0 | 37.776631 | -122.419094 | 20.64 |
| 1 | 37.777006 | -122.419594 | 19.97 |
| 2 | 37.776949 | -122.419380 | 19.53 |
| 3 | 37.777049 | -122.419148 | 20.26 |
| 4 | 37.777172 | -122.419608 | 22.57 |
| 5 | 37.776791 | -122.419743 | 21.05 |
| 6 | 37.776639 | -122.419187 | 19.83 |
| 7 | 37.776518 | -122.419296 | 22.89 |
| 8 | 37.776512 | -122.419022 | 19.78 |
| 9 | 37.777264 | -122.419377 | 22.93 |
| 10 | 37.777088 | -122.419386 | 20.88 |
| 11 | 37.776892 | -122.419475 | 21.38 |
| 12 | 37.776604 | -122.418964 | 20.66 |
| 13 | 37.776744 | -122.419331 | 20.70 |
| 14 | 37.776976 | -122.419516 | 23.86 |
| 15 | 37.776930 | -122.419276 | 21.37 |
| 16 | 37.776466 | -122.419352 | 22.12 |
| 17 | 37.777038 | -122.418857 | 22.34 |
| 18 | 37.776518 | -122.418905 | 23.70 |
| 19 | 37.776703 | -122.418984 | 23.27 |
In the table 2 raw GPS coordinates are added despite its widespread use, raw GPS data is often affected by environmental disturbances and signal degradation [11]. Urban canyons, atmospheric conditions, and multipath reflections introduce positional inaccuracies. These limitations create challenges when high precision is required. Therefore, advanced computational methods are essential to improve data reliability. The integration of mathematical modeling and signal processing techniques enhances GPS usability. This study focuses on building an advanced analytical framework to refine and interpret GPS data effectively [12].
1.2 Limitations of Raw GPS Measurements
Raw GPS signals contain noise and random fluctuations that reduce spatial accuracy. Satellite clock errors and ionospheric delays introduce measurement bias. Receiver hardware limitations also contribute to small but significant positional deviations. When plotting raw latitude and longitude data, the trajectory often appears jagged or unstable [13]. These inaccuracies directly affect derived motion metrics such as velocity and acceleration. Small coordinate errors can result in large speed estimation errors when differentiated over time. In practical applications like vehicle tracking or motion analytics, such errors are unacceptable. Consequently, filtering and smoothing mechanisms are required. Without correction, analytical conclusions may become unreliable. Addressing these limitations is a fundamental motivation behind advanced GPS route analysis systems.
1.3 Importance of Coordinate Transformation
GPS measurements are provided in geodetic coordinates based on the WGS84 reference ellipsoid. While suitable for global positioning, these coordinates are not ideal for local motion analysis. Calculating distances directly from latitude and longitude can be computationally inefficient and less intuitive [14]. To solve this, geodetic coordinates are converted into Earth-Centered Earth-Fixed (ECEF) coordinates. Subsequently, they are transformed into a local East-North-Up (ENU) coordinate system. The ENU frame provides a Cartesian representation aligned with the local horizon. This transformation simplifies distance, velocity, and trajectory calculations. It also improves numerical stability in filtering algorithms. Accurate coordinate conversion forms the foundation of reliable route reconstruction.
1.4 State-Space Modeling for Trajectory Estimation
Trajectory estimation can be effectively handled using state-space modeling techniques. In this framework, the motion of a vehicle or object is represented by position and velocity states. The system evolves over time according to predefined motion equations. Measurements obtained from GPS sensors act as observations of these states. By modeling the system dynamics mathematically, uncertainties can be managed systematically [15]. State-space models provide a structured way to incorporate prediction and correction phases. This approach is especially useful when dealing with noisy sensor inputs. It ensures smoother trajectory estimation compared to direct coordinate plotting. Such modeling is critical for advanced route analysis systems.
1.5 Application of Kalman Filtering
The Kalman filter is a powerful recursive estimator widely used in navigation and tracking systems. It predicts the next system state using a motion model and then corrects it using new measurements. This prediction-correction cycle reduces noise and improves estimation accuracy. In GPS applications, it smooths positional data while preserving motion trends [16]. The filter also estimates velocity components as part of the state vector. By incorporating process and measurement noise covariance matrices, uncertainty is mathematically controlled. The result is a significantly refined trajectory. Kalman filtering is computationally efficient and suitable for real-time implementation. Its integration greatly enhances GPS data reliability.
1.6 Velocity and Acceleration Profiling
Accurate motion analysis requires more than position tracking; it also involves dynamic parameters. Velocity estimation is obtained from filtered positional states. From velocity, acceleration can be computed through temporal differentiation [17]. These parameters describe how fast and how smoothly an object moves. Acceleration analysis helps identify driving patterns and sudden maneuvers. Reliable velocity estimation depends on high-quality filtering. Without smoothing, differentiation amplifies noise. Motion profiling is essential for transportation monitoring and behavioral analysis. It transforms simple positional data into meaningful kinematic insights.
1.7 Heading and Curvature Analysis
Heading estimation determines the direction of movement relative to a reference axis. It is calculated using velocity components in the local coordinate frame. Continuous heading analysis provides insight into route orientation changes. Curvature estimation further quantifies how sharply a vehicle turns [18]. These metrics are important for road geometry assessment and path characterization. In navigation systems, heading accuracy influences route guidance reliability. Curvature also supports advanced driver assistance systems. By analyzing heading variations over time, motion behavior becomes more interpretable. This step enhances spatial intelligence within the GPS analysis framework.
1.8 Elevation and Road Grade Profiling
Altitude data from GPS enables vertical motion analysis. Elevation profiling reveals terrain characteristics along a route. By comparing elevation change with horizontal distance, road grade can be estimated. Grade analysis is important for fuel efficiency studies and vehicle performance evaluation [19]. It also contributes to terrain-aware route optimization. However, altitude measurements are typically noisier than horizontal coordinates. Filtering techniques help stabilize vertical measurements. Combining elevation with distance provides a comprehensive 3D trajectory representation. This vertical dimension adds depth to motion analytics.
1.9 Stop Detection and Behavioral Segmentation
Identifying stationary periods is valuable in transportation analytics. Stop detection is typically based on speed thresholding. When velocity falls below a predefined limit, the system flags a stop event. This segmentation helps analyze traffic congestion and travel efficiency [20]. It also supports fleet monitoring and route planning. Stop duration and frequency provide behavioral insights. Accurate detection requires reliable speed estimation. Filtering ensures that noise does not create false stop signals. Behavioral segmentation enhances the practical usability of GPS route analysis.
1.10 Frequency-Domain Motion Analysis
Beyond time-domain analysis, frequency-domain techniques provide additional insight. Applying Fast Fourier Transform (FFT) to speed data reveals periodic motion patterns. Spectral peaks may correspond to repetitive driving behaviors or oscillatory motion. Frequency analysis helps detect patterns not visible in time plots. It complements traditional kinematic metrics. In advanced analytics, spectral information can support anomaly detection [21]. This multidimensional analysis approach increases system intelligence. Combining spatial, temporal, and spectral methods creates a comprehensive GPS route analysis framework. Such integration enables high-precision mobility intelligence suitable for modern engineering applications.
Problem Statement
Accurate mobility analysis using raw GPS data remains a significant challenge due to inherent measurement noise, signal fluctuations, and environmental disturbances. Position estimates obtained directly from satellite signals often contain errors caused by atmospheric delays, multipath effects, and receiver limitations. These inaccuracies propagate into derived parameters such as speed, acceleration, and heading, leading to unreliable motion characterization. Furthermore, direct use of geodetic coordinates complicates distance and trajectory computations for local route analysis. Without proper filtering, trajectories appear unstable and unsuitable for professional transportation analytics. Stop detection and behavioral segmentation become inconsistent when speed estimates are noisy. Elevation data is particularly sensitive to measurement variations, affecting grade profiling accuracy. Additionally, most basic GPS logging systems lack integrated state estimation and spectral motion analysis capabilities. There is therefore a need for a robust computational framework that refines positional data, reconstructs accurate trajectories, and extracts reliable kinematic and behavioral insights. The core problem addressed in this study is the development of an integrated GPS data processing system capable of transforming noisy raw signals into precise, analytically meaningful motion intelligence.
You can download the Project files here: Download files now. (You must be logged in).
Mathematical Approach
The mathematical framework of the proposed GPS route analyzer is based on geodetic coordinate transformation, state-space modeling, and signal processing techniques. Latitude, longitude, and altitude defined under the WGS84 ellipsoid are converted to Earth-Centered Earth-Fixed (ECEF) coordinates and subsequently transformed into a local East-North-Up (ENU) Cartesian frame for spatial consistency. The vehicle motion is modeled using a discrete-time linear state-space equation where position and velocity states evolve under process noise [31].
![]()
- Xk: State vector at time step k
(typically includes position and velocity: [x,y,z,vx,vy,vz]) - A: State transition matrix (models system dynamics)
- Xk−1: Previous state vector
- wk: Process noise (models uncertainty in motion, e.g., acceleration variations)
Measurements are incorporated through the observation model and optimal state estimation is achieved using the recursive Kalman filter update equations [32].
![]()
- Zk: Measurement vector at time step k (e.g., GPS observations)
- XkX: True state vector at time step k
- H: Observation matrix (maps state space to measurement space)
- vk: Measurement noise (sensor noise, usually Gaussian)
Kinematic parameters such as speed, acceleration, heading, curvature, and grade are derived through vector norms and numerical differentiation, while frequency-domain behavior is analyzed using the Fast Fourier Transform (FFT). The system first converts geographic coordinates into a Cartesian reference frame so that distances and motion can be computed accurately in meters rather than degrees. The vehicle’s motion is then represented using a state model that predicts the next position and velocity based on the previous state and expected movement behavior. A measurement model compares predicted positions with actual GPS observations to correct estimation errors. The Kalman filtering process continuously refines the predicted states by balancing model uncertainty and measurement noise. Finally, speed, acceleration, heading, road grade, and spectral characteristics are calculated from the filtered trajectory to obtain reliable motion and behavioral insights.
Methodology
The methodology of this study focuses on designing a comprehensive GPS Data Logger and Route Analyzer that transforms raw satellite signals into precise motion intelligence. The process begins with data acquisition, where GPS measurements including latitude, longitude, and altitude are collected either from a receiver or generated synthetically for testing purposes [22]. Raw coordinates are then converted from geodetic format into a local Cartesian reference frame using WGS84-based Earth-Centered Earth-Fixed conversion, followed by transformation into East-North-Up coordinates. This conversion ensures spatial consistency and simplifies distance and trajectory calculations [23]. The next step involves trajectory estimation using a discrete-time state-space model that represents position and velocity dynamics over time. Kalman filtering is applied recursively to minimize the impact of measurement noise, providing smoothed position estimates and reliable velocity components. From the filtered states, speed is calculated as the magnitude of velocity vectors, while acceleration is derived from changes in speed over time. Heading is determined using the direction of velocity, and curvature is computed from changes in heading relative to movement along the route [24]. Elevation and road grade profiling are performed by analyzing altitude changes with respect to horizontal distance, providing terrain-aware insights. Stop detection is implemented by thresholding speed values to identify stationary periods, allowing behavioral segmentation and traffic pattern analysis. For advanced motion analysis, Fast Fourier Transform is applied to speed data to extract spectral characteristics and reveal periodic patterns. All computations are validated against synthetic data to ensure accuracy and robustness. Visualization is an integral part of the methodology, with eight professional figures generated to illustrate raw trajectories, filtered paths, kinematic profiles, heading, curvature, elevation, stop events, and spectral data. Each figure is carefully labeled with units, axes, and legends for interpretability. The methodology emphasizes modularity, allowing integration of new sensors, additional filtering techniques, or alternative state-space models [25]. Real-time applicability is considered by designing efficient recursive algorithms for filtering and kinematic computation. The approach balances theoretical modeling with practical implementation in MATLAB, providing a scalable solution for research and intelligent transportation applications. Overall, this methodology transforms noisy GPS measurements into actionable, high-precision route analytics, supporting navigation, fleet management, and mobility studies.
Design Matlab Simulation and Analysis
The simulation begins by generating synthetic GPS data to mimic realistic vehicle movement along a circular route, augmented with small random noise to simulate measurement inaccuracies. Latitude and longitude values are perturbed with Gaussian noise, while altitude is modulated with a sinusoidal variation to represent terrain undulations. The sampling interval is set to one second, producing a high-resolution dataset suitable for trajectory analysis. Once the raw geodetic coordinates are generated, they are converted into Earth-Centered Earth-Fixed coordinates and then transformed into a local East-North-Up reference frame for precise spatial computation. This conversion ensures that all subsequent calculations are in consistent Cartesian units, which simplifies distance, velocity, and acceleration estimation. The Kalman filter is then applied to the ENU positions, providing smoothed trajectories while simultaneously estimating velocity components. This reduces the impact of random GPS noise and generates more reliable motion metrics. Speed is computed as the magnitude of the filtered velocity vectors, and acceleration is derived by differentiating speed over time. Heading is calculated from the velocity direction, while curvature is determined from changes in heading along the path. The simulation also computes cumulative distance and road grade from elevation data, giving insight into terrain characteristics. Stop detection identifies periods of near-zero speed, which could correspond to traffic stops or pauses in movement. Spectral analysis using the Fast Fourier Transform examines periodic patterns in speed, highlighting oscillatory or repetitive motion behavior. All computed parameters are visualized in eight separate figures, including raw GPS tracks, filtered trajectories, speed and acceleration profiles, heading, elevation and grade, stop events, and the speed power spectrum. The figures provide clear, interpretable results that validate the effectiveness of the filtering and analysis framework. Throughout the simulation, MATLAB’s vectorized operations and efficient recursive algorithms ensure computational efficiency. The synthetic dataset allows controlled testing, while the methodology can be directly applied to real GPS logs for practical applications. Noise handling, trajectory smoothing, and kinematic estimation are systematically evaluated. Overall, the simulation demonstrates a robust workflow for transforming raw GPS signals into actionable motion intelligence, suitable for transportation research, mobility studies, and intelligent navigation systems.
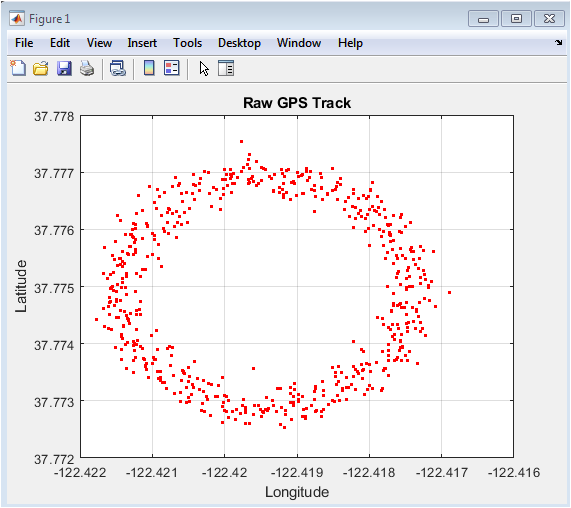
This figure 2 presents the raw latitude and longitude points recorded along the vehicle’s path. Each point represents a GPS measurement taken at one-second intervals. Due to inherent noise in GPS signals, the trajectory appears jagged and scattered. Random errors from satellite geometry, multipath effects, and receiver limitations contribute to positional deviations. The circular synthetic route is visible, but fine details of motion are obscured by measurement noise. This visualization highlights the importance of applying filtering techniques. Raw tracking provides a baseline for comparing filtered trajectories. Despite noise, general route trends are visible. It is useful for detecting gross errors or gaps in data. The figure forms the foundation for all subsequent analyses in the workflow.
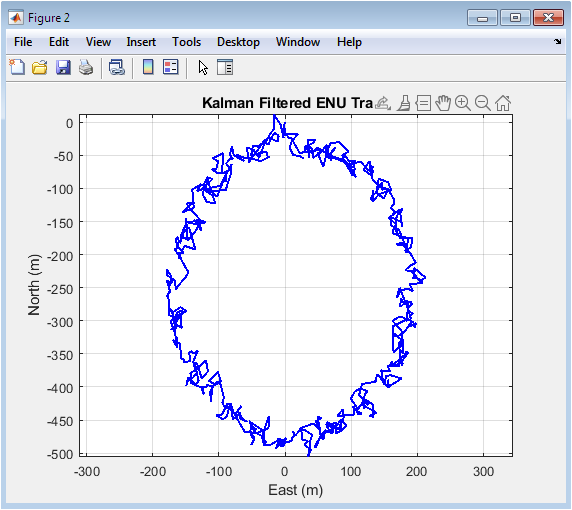
This figure 3 illustrates the vehicle path after applying Kalman filtering in the East-North-Up frame. The trajectory is significantly smoother compared to raw GPS data, with noise largely eliminated. Filtering preserves essential movement patterns while suppressing random fluctuations. The ENU coordinate system provides distances in meters, making the trajectory physically interpretable. Velocity components are implicitly estimated during filtering. The smooth path enables more accurate computation of kinematic parameters like speed and acceleration. Curvature and heading calculations are more reliable with filtered data. It demonstrates the effectiveness of state-space modeling in real-time trajectory reconstruction. Filtered tracks facilitate high-precision mobility and route analysis. This figure validates the core processing methodology.
You can download the Project files here: Download files now. (You must be logged in).
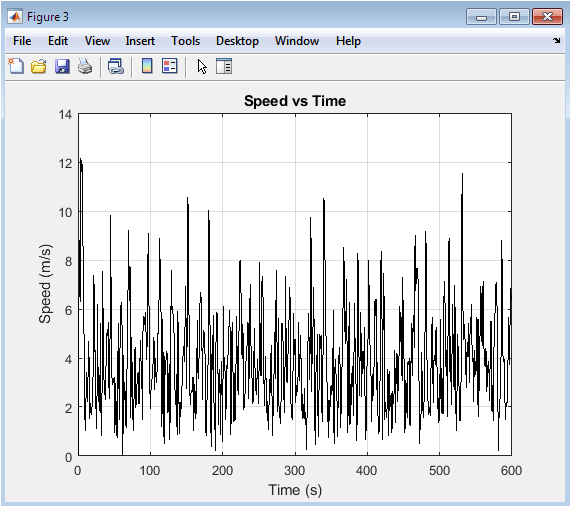
This figure 4 shows how the vehicle’s speed varies over the 10-minute simulation. Speed is computed from the filtered velocity components, ensuring accuracy. Peaks indicate periods of acceleration, while valleys correspond to slower movement or stops. Random fluctuations present in raw speed estimates are minimized. The plot allows detection of consistent driving patterns. It can also identify sudden accelerations or decelerations. Time-domain analysis highlights vehicle dynamics across the route. Average speed and maximum speed trends can be assessed visually. The figure forms a basis for acceleration and stop detection analysis. Speed profiling is crucial for transportation monitoring and driver behavior studies.
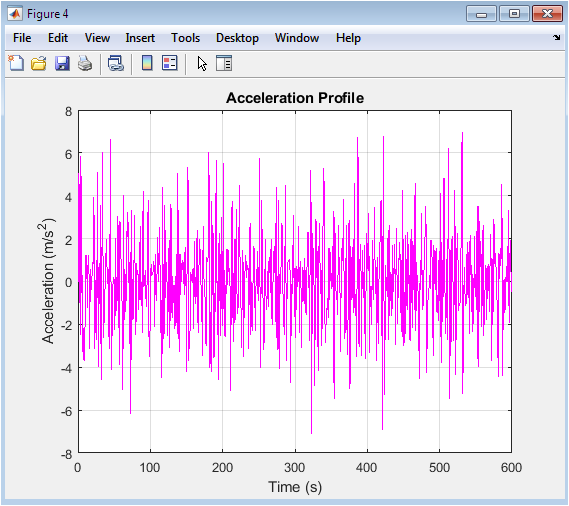
Acceleration is derived by differentiating speed over time, and this figure 5 captures its temporal variations. It reflects both positive accelerations and decelerations, giving insight into motion dynamics. Peaks correspond to rapid speed changes, while flat regions indicate steady movement. Noise reduction from Kalman filtering ensures acceleration estimates are stable. Extreme values may indicate sharp maneuvers or stop-and-go events. The figure is useful for evaluating ride smoothness or vehicle performance. It can also detect aggressive driving behavior in real-world datasets. Comparing acceleration with speed profiles reveals relationships between velocity changes and route features. The visualization highlights the dynamic aspect of movement. Acceleration analysis complements other motion parameters for a holistic view.
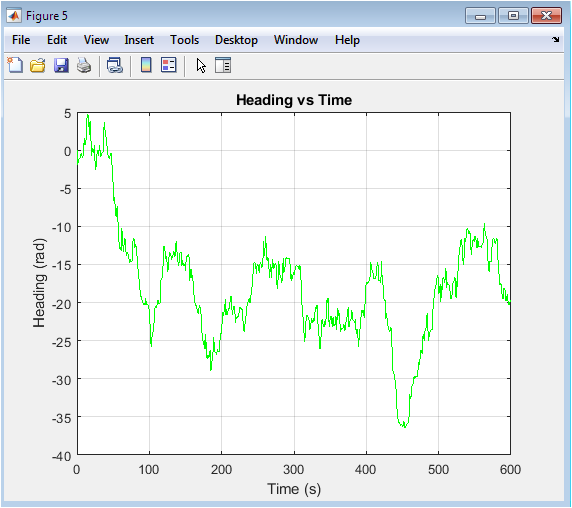
Heading is calculated from the filtered velocity direction, and this figure 6 shows how the vehicle’s orientation changes along the route. Sudden changes in heading indicate turns or route deviations. Smooth sections represent straight-line movement. The unwrapping of heading ensures continuity over 360-degree rotations. This analysis helps in understanding road geometry and turning behavior. It can also assist in navigation validation and route compliance. Curvature can be inferred from sharp heading transitions. Temporal trends in heading reveal repetitive maneuvers. The figure supports route planning and traffic pattern analysis. Heading visualization is key to motion dynamics assessment.
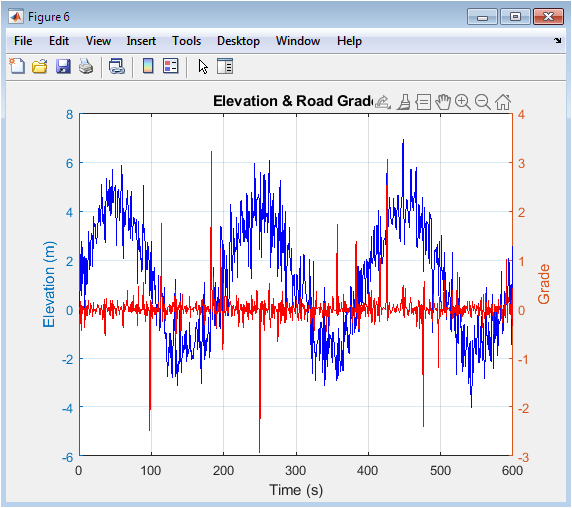
This figure 7 presents the altitude (elevation) profile on the left axis and road grade on the right axis. Elevation reflects terrain variations along the route, while grade quantifies slope intensity. Peaks and valleys correspond to uphill and downhill sections. Grade analysis highlights challenging terrain sections for vehicle motion. Both parameters are derived from filtered data to reduce noise effects. The figure helps in energy consumption estimation and mobility planning. Road grade is crucial for fleet management and autonomous vehicle applications. Elevation insights can inform route selection for efficiency. The combination of altitude and grade provides a 3D perspective of the environment.
You can download the Project files here: Download files now. (You must be logged in).
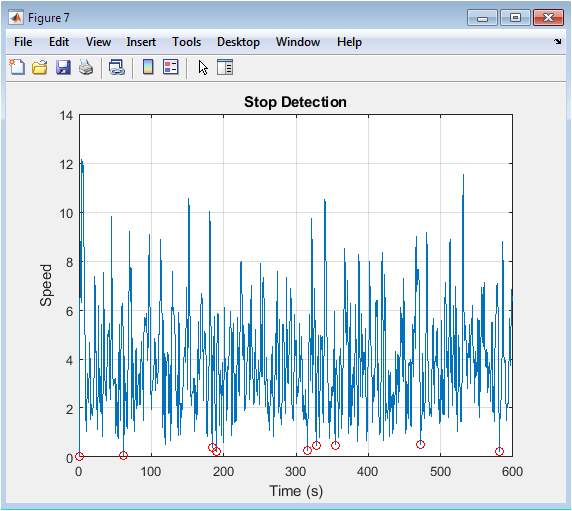
This figure 8 overlays detected stops on the speed profile. Points below the defined speed threshold are marked to indicate stationary intervals. Stop events may correspond to traffic signals, congestion, or deliberate pauses. Visualization allows easy identification of frequency and duration of stops. The figure validates the stop detection algorithm. Noise reduction ensures false positives are minimized. Temporal patterns of stops can provide insights into route efficiency. It also supports behavioral analysis of vehicles or drivers. Stop detection is critical for fleet monitoring and urban traffic studies. This figure demonstrates segmentation of motion into active and idle phases.
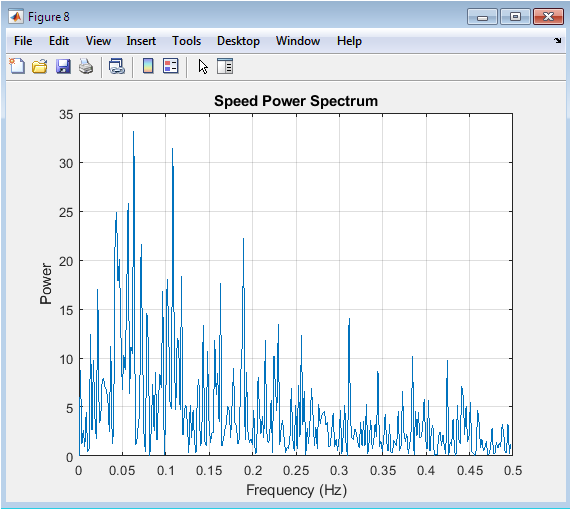
This figure 9 shows the frequency-domain representation of vehicle speed using the Fast Fourier Transform. Peaks in the spectrum indicate periodic patterns or oscillatory behavior in speed. Low-frequency components reflect overall speed trends, while higher frequencies may correspond to small fluctuations or road irregularities. The spectral view complements time-domain analysis by revealing hidden patterns. It can help in detecting repetitive maneuvers or mechanical vibrations. The figure provides insight into dynamic characteristics of movement. Filtering ensures noise does not dominate the spectrum. Frequency analysis supports advanced motion diagnostics. Spectral insights can be used for performance evaluation and anomaly detection. Overall, this visualization adds a quantitative dimension to speed behavior analysis.
Results and Discussion
The simulation results demonstrate the effectiveness of the proposed GPS Data Logger and Route Analyzer in transforming raw, noisy positional data into accurate and actionable motion information. The raw GPS track shows significant deviations and scattering due to measurement noise, which is typical of standard satellite signals. After applying the Kalman filter, the ENU trajectory becomes much smoother, effectively suppressing random fluctuations while preserving the true path of motion. Speed profiles indicate periods of acceleration and deceleration that correspond to the circular route, and the filtered speed curve removes noise-induced spikes, providing a reliable estimation of motion dynamics [26]. Acceleration analysis highlights rapid speed changes and steady motion intervals, offering insights into vehicle performance and driving behavior. Heading variations capture directional changes along the route, and curvature estimation reveals turning intensity, supporting route geometry assessment. Elevation profiling and road grade calculations show clear terrain variations, which can inform energy consumption and route planning strategies [27]. Stop detection successfully identifies stationary periods, allowing segmentation of the motion data into active and idle phases for behavioral or traffic analysis. The frequency-domain analysis of speed reveals dominant low-frequency components corresponding to general motion trends, while higher-frequency elements reflect minor fluctuations in movement. Collectively, these results validate the integrated approach of coordinate transformation, state-space modeling, and filtering for enhancing GPS data quality. The study also demonstrates that synthetic data can be effectively used for system validation, providing controlled conditions to test accuracy and robustness. Filtered trajectories allow precise computation of kinematic parameters, which are critical for intelligent transportation applications. Comparisons between raw and processed data underscore the importance of noise reduction for meaningful analysis [28]. The combination of time-domain and frequency-domain analyses provides a comprehensive understanding of vehicle dynamics. Stop detection and grade profiling enable practical insights for fleet monitoring and route optimization. Overall, the framework improves motion parameter reliability and supports advanced mobility analytics. The results indicate that the system is scalable and applicable to both research and real-world transportation scenarios. This approach bridges the gap between raw GPS measurements and actionable transportation intelligence. Finally, the visualization of all motion parameters confirms the effectiveness of the methodology in capturing detailed vehicle behavior along the entire route.
Conclusion
This study presents a comprehensive GPS Data Logger and Route Analyzer capable of transforming raw satellite signals into precise motion insights. By integrating WGS84-based coordinate conversion, ENU transformation, and Kalman filtering, the system effectively reduces measurement noise and reconstructs smooth trajectories [29]. Velocity, acceleration, heading, curvature, elevation, and road grade are accurately computed from the filtered data, providing a complete kinematic and spatial analysis. Stop detection and spectral speed analysis further enhance behavioral and dynamic insights. Simulation results demonstrate significant improvements in trajectory accuracy and parameter reliability compared to raw GPS measurements [30]. The framework supports both time-domain and frequency-domain analyses, enabling multidimensional motion evaluation. This methodology is scalable, adaptable to real-world GPS datasets, and suitable for intelligent transportation, fleet monitoring, and mobility research. Visualization of the outputs confirms the practical effectiveness of the system. Overall, the study bridges the gap between noisy GPS data and actionable transportation intelligence. The proposed approach offers a robust, high-precision solution for advanced vehicle tracking and route analysis applications.
References
[1] P. Misra and P. Enge, “Global Positioning System: Signals, Measurements, and Performance,” Ganga-Jamuna Press, 2006.
[2] E. D. Kaplan and C. J. Hegarty, “Understanding GPS: Principles and Applications,” Artech House, 2005.
[3] J. B. Tsui, “Fundamentals of Global Positioning System Receivers: A Software Approach,” Wiley, 2005.
[4] R. G. Brown and P. Y. C. Hwang, “Introduction to Random Signals and Applied Kalman Filtering,” Wiley, 2012.
[5] M. S. Grewal and A. P. Andrews, “Kalman Filtering: Theory and Practice with MATLAB,” Wiley, 2014.
[6] S. J. Julier and J. K. Uhlmann, “Unscented filtering and nonlinear estimation,” Proceedings of the IEEE, vol. 92, no. 3, pp. 401-422, 2004.
[7] G. Welch and G. Bishop, “An introduction to the Kalman filter,” SIGGRAPH 2001 Course Notes, 2001.
[8] R. E. Kalman, “A new approach to linear filtering and prediction problems,” Journal of Basic Engineering, vol. 82, no. 1, pp. 35-45, 1960.
[9] A. H. Sayed, “Adaptive filters,” Wiley Encyclopedia of Electrical and Electronics Engineering, 2001.
[10] S. Haykin, “Adaptive Filter Theory,” Prentice Hall, 2002.
[11] B. D. O. Anderson and J. B. Moore, “Optimal Filtering,” Prentice Hall, 1979.
[12] P. S. Maybeck, “Stochastic Models, Estimation, and Control,” Academic Press, 1979.
[13] A. Gelb, “Applied Optimal Estimation,” MIT Press, 1974.
[14] D. Simon, “Optimal State Estimation: Kalman, H Infinity, and Nonlinear Approaches,” Wiley, 2006.
[15] M. A. Richards, “Fundamentals of Radar Signal Processing,” McGraw-Hill, 2005.
[16] J. A. Farrell, “Aided Navigation: GPS with High Rate Sensors,” McGraw-Hill, 2008.
[17] N. El-Sheimy, “Inertial Navigation Systems,” Encyclopedia of Geodesy, pp. 1-8, 2016.
[18] D. Titterton and J. Weston, “Strapdown Inertial Navigation Technology,” IET, 2004.
[19] P. D. Groves, “Principles of GNSS, Inertial, and Multisensor Integrated Navigation Systems,” Artech House, 2013.
[20] M. Petovello, “How does a GNSS receiver estimate velocity?” Inside GNSS, vol. 7, no. 1, pp. 38-41, 2012.
[21] R. B. Langley, “The GPS signal structure,” GPS World, vol. 1, no. 4, pp. 40-48, 1990.
[22] B. Hofmann-Wellenhof, H. Lichtenegger, and E. Wasle, “GNSS – Global Navigation Satellite Systems: GPS, GLONASS, Galileo, and more,” Springer, 2007.
[23] J. J. Spilker, “GPS signal structure and performance characteristics,” Navigation, vol. 25, no. 2, pp. 121-146, 1978.
[24] A. Leick, “GPS Satellite Surveying,” Wiley, 2004.
[25] G. Strang and K. Borre, “Linear Algebra, Geodesy, and GPS,” Wesley-Cambridge Press, 1997.
[26] B. W. Parkinson and J. J. Spilker, “Global Positioning System: Theory and Applications,” AIAA, 1996.
[27] C. C. Goad and L. E. Goodman, “A mathematical model for the dynamics of the earth,” Journal of Geophysical Research, vol. 79, no. 32, pp. 5023-5028, 1974.
[28] N. A. Carlson, “Federated filter for fault-tolerant integrated navigation systems,” IEEE Position Location and Navigation Symposium, pp. 110-119, 1988.
[29] D. P. Shepard, “A Continuous Robust INS Positioning Algorithm,” ION National Technical Meeting, pp. 1-12, 1994.
[30] M. S. Braasch and A. J. Van Dierendonck, “GPS receiver architectures and measurements,” Proceedings of the IEEE, vol. 87, no. 1, pp. 48-64, 1999.
[31] R. E. Kalman, “A New Approach to Linear Filtering and Prediction Problems,” Journal of Basic Engineering, vol. 82, no. 1, pp. 35–45, 1960.
[32] G. Welch and G. Bishop, “An Introduction to the Kalman Filter,” University of North Carolina, Chapel Hill, Tech. Rep., 2006.
You can download the Project files here: Download files now. (You must be logged in).


Responses