

Underwater Intelligence, Building Advanced Fish Detection and Tracking Systems for Responsible Fishing in Matlab
Author : Waqas Javaid
Abstract
This article presents a comprehensive marine technology framework designed to enhance sustainable fishing operations through advanced signal processing and predictive analytics. The system integrates multi-beam sonar simulation with adaptive Wiener filtering to achieve high-fidelity fish school detection and tracking in dynamic ocean environments. By modeling critical environmental parameters including current fields, temperature-salinity profiles, and sea state conditions the framework generates predictive optimization models that balance fishing efficiency with long-term resource sustainability [1]. Real-time 3D visualization of vessel trajectories and fish school movements provides operators with actionable intelligence for decision-making, while performance metrics demonstrate significant improvements in detection rates and signal-to-noise ratios [2]. Ultimately, this technology-driven approach supports responsible fishing practices by enabling precise target identification, biomass estimation, and risk assessment, contributing to the preservation of marine ecosystems while maintaining operational productivity [3].
Introduction
The global fishing industry stands at a critical crossroads where the demand for marine protein must be balanced against the urgent need for ecosystem preservation and stock sustainability.
Figure 1 presents the Advanced marine technology fishing system integrating multi-beam sonar, environmental sensing, and predictive analytics for sustainable fish detection and optimal harvesting. Traditional fishing methods, often characterized by broad searches and significant bycatch, are increasingly inadequate in an era of depleted fish stocks and stringent regulatory frameworks.
Table 1: Environmental and System Parameters
| Parameter Category | Parameter Name | Value | Unit | Description |
| Environmental | Sea Depth | 200 | m | Maximum depth of the survey area |
| Salinity | 35 | PSU | Average water salinity | |
| Temperature | 15 | °C | Surface water temperature | |
| Current Speed | 0.8 | m/s | Mean ocean current velocity | |
| Current Direction | 45 | degrees | Direction of current flow (clockwise from north) | |
| Wave Height | 2.5 | m | Significant wave height | |
| Wave Period | 8 | s | Dominant wave period | |
| Sonar System | Operating Frequency | 50 | kHz | Acoustic transmission frequency |
| Beam Width | 15 | degrees | Angular coverage per beam | |
| Maximum Range | 150 | m | Maximum detectable distance | |
| Pulse Length | 0.001 | s | Duration of each acoustic pulse | |
| Number of Beams | 64 | — | Total beams in multi-beam array | |
| Vessel | Speed | 5 | knots | Vessel cruising speed |
| Heading | 90 | degrees | Vessel direction (eastward) | |
| Net Depth | 50 | m | Target fishing gear deployment depth | |
| Net Width | 30 | m | Horizontal spread of fishing gear | |
| Temporal | Sampling Rate | 100 | Hz | Data acquisition frequency |
| Duration | 300 | s | Total simulation time | |
| Time Steps | 30,001 | — | Total number of time samples |
Table 1 presents the environmental, sonar system, vessel, and temporal parameters used in the simulation, including ocean conditions (200 m depth, 35 PSU salinity, 15°C temperature, 0.8 m/s current speed at 45°, 2.5 m wave height with 8 s period), sonar configuration (50 kHz operating frequency, 15° beam width, 150 m range, 1 ms pulse length, 64 beams), vessel operating conditions (5 knots speed, 90° heading, 50 m net depth, 30 m net width), and data acquisition settings (100 Hz sampling rate over 300 s yielding 30,001 time steps), which together define the full operational and sensing environment of the system. In response, marine technology has emerged as a transformative force, equipping fishermen and researchers with sophisticated tools to visualize, understand, and interact with the underwater environment like never before [4]. Central to this technological revolution is the integration of advanced multi-beam sonar systems capable of generating high-resolution acoustic images of fish schools and seafloor features in real time. However, raw acoustic data alone is insufficient; it requires intelligent signal processing algorithms, such as adaptive Wiener filtering, to separate meaningful biological targets from ambient noise and reverberation [5]. Furthermore, the dynamic nature of the marine environment characterized by shifting currents, temperature gradients, and sea state variability demands robust environmental modeling to predict fish behavior and optimize fishing operations [6]. By combining acoustic sensing with predictive analytics and sustainability metrics, modern marine technology systems can identify optimal fishing locations that maximize catch efficiency while minimizing ecological impact [7]. These systems also support real-time decision-making through intuitive 3D visualizations, enabling operators to track vessel trajectories and fish school movements simultaneously. This article explores the complete ecosystem of a marine technology fishing system, from the underlying physics of acoustic propagation to the implementation of predictive optimization algorithms that promote responsible resource management [8]. Through this exploration, we demonstrate how data-driven approaches are redefining the future of sustainable fishing operations in an increasingly complex marine landscape [9].
1.1 The Global Fishing Challenge
The global fishing industry faces an unprecedented challenge as the demand for marine protein continues to rise alongside growing concerns about overfishing and ecosystem degradation. Traditional fishing practices, which often rely on broad-area searching and indiscriminate harvesting methods, have contributed significantly to the depletion of commercial fish stocks worldwide [10]. According to the Food and Agriculture Organization, approximately one-third of global fish stocks are now classified as overfished, creating an urgent need for more intelligent and selective harvesting approaches. Marine ecosystems are complex systems where the removal of key species can trigger cascading effects throughout the food web, impacting biodiversity and ecosystem resilience [11]. This crisis has catalyzed a paradigm shift in fisheries management, moving away from reactive catch limits toward proactive, technology-driven solutions that enable precision harvesting while maintaining ecological balance [12].
1.2 The Emergence of Marine Technology
Marine technology has emerged as a powerful ally in addressing these challenges, offering tools that transform how we perceive and interact with the underwater realm. Modern fishing vessels are increasingly equipped with sophisticated electronic systems that provide real-time information about fish distribution, seafloor topography, and environmental conditions beneath the surface [13]. These technological advancements have evolved from simple echo sounders to complex multi-beam sonar arrays capable of producing three-dimensional representations of underwater environments with remarkable clarity. The integration of global positioning systems, satellite communications, and onboard computing power has created an ecosystem where data acquisition, processing, and decision-making occur seamlessly in real time. This technological evolution represents a fundamental shift in fishing operations, transforming what was once a gamble on the open ocean into a data-driven enterprise guided by scientific principles [14].
1.3 Multi-Beam Sonar as the Sensory Foundation
At the heart of modern marine technology fishing systems lies multi-beam sonar, which serves as the primary sensory apparatus for detecting and characterizing underwater targets. Unlike traditional single-beam systems that provide only a vertical profile directly beneath the vessel, multi-beam sonar emits multiple acoustic pulses across a wide swath, generating a comprehensive picture of the water column and seafloor. These systems typically employ 64 or more individual beams arranged in a fan-shaped pattern, each transmitting acoustic energy at frequencies typically ranging from 50 to 200 kilohertz. The returning echoes contain valuable information about target range, bearing, and acoustic strength, enabling operators to distinguish between fish schools, individual fish, and non-target features such as debris or geological formations [15]. Understanding the physics of acoustic propagation, including factors such as sound speed variation, absorption, and scattering, is essential for interpreting sonar data accurately and extracting meaningful biological information.
1.4 Signal Processing for Target Detection
Raw sonar returns, however, represent only the starting point of the detection process, as the underwater environment is saturated with acoustic noise and reverberation that can mask legitimate targets. Ambient noise from surface waves, marine traffic, and biological sources combines with volume reverberation from the water column to create a challenging detection environment that demands sophisticated signal processing [16]. Advanced adaptive filtering techniques, such as Wiener filtering, have been developed to estimate local signal characteristics and apply variable gain based on the signal-to-noise ratio within sliding analysis windows. These algorithms compute local means and variances, estimate noise contributions, and generate adaptive detection thresholds that maintain consistent performance across varying environmental conditions. The result of this processing is a detection map that highlights probable fish schools while suppressing false alarms, providing operators with reliable information for decision-making.
1.5 Understanding Fish School Dynamics
Fish schools are not static targets but dynamic biological entities whose behavior is shaped by environmental conditions, predator-prey interactions, and internal social dynamics. Successful detection and tracking requires modeling fish movement patterns using approaches such as biased random walks, where schools maintain preferred headings while incorporating random perturbations that represent natural foraging behavior. Schooling behavior itself creates additional complexity, as nearby schools exert attractive forces that maintain group cohesion while individuals within schools respond to neighbors through complex social interactions. Environmental factors including temperature gradients, current patterns, and prey availability further influence school movement, creating predictive relationships that can be exploited for operational planning [17]. By modeling these dynamics, marine technology systems can anticipate fish movements and provide forecasts that extend beyond simple real-time detection.
1.6 Environmental Modeling for Contextual Awareness
The marine environment is characterized by physical processes that operate across multiple scales, from large-scale ocean currents to small-scale turbulence, all of which influence fish distribution and sonar performance. Ocean currents create transport pathways that concentrate plankton and fish in frontal zones and eddy features, while vertical temperature and salinity profiles define habitat boundaries that constrain species distributions [18]. Advanced environmental models incorporate these factors by generating current fields that include both mean flow components and mesoscale eddies, along with temperature and salinity profiles that reflect seasonal and regional oceanographic conditions. Wave spectra and sea state information provide additional context for operational planning, influencing both vessel safety and sonar system effectiveness under varying conditions. This environmental intelligence transforms the fishing system from a simple detection tool into a comprehensive decision support platform that accounts for the full complexity of the marine ecosystem.
1.7 Predictive Analytics for Sustainable Harvesting
The ultimate goal of marine technology fishing systems extends beyond simple detection to encompass sustainable harvesting strategies that balance short-term operational goals with long-term resource conservation. Predictive analytics frameworks achieve this balance by generating fish density maps from acoustic data, calculating suitability scores that integrate multiple decision criteria, and identifying optimal fishing locations through multi-objective optimization. These frameworks typically weight fish density as the primary factor, while incorporating current accessibility and sustainability considerations to avoid overfishing vulnerable areas and populations [19]. Catch prediction models estimate sustainable harvest levels based on biomass estimates, population dynamics, and harvest control rules that prevent recruitment overfishing and stock collapse. Risk assessment modules evaluate operational safety and environmental constraints, ensuring that recommended actions align with both economic objectives and conservation principles.
1.8 Visualization and Operator Interface
The sophisticated algorithms and data processing capabilities embedded in marine technology systems must be translated into intuitive visualizations that enable rapid, informed decision-making by vessel operators. Three-dimensional tracking displays provide comprehensive situational awareness by showing vessel trajectories, fish school positions, and depth information within a single integrated view that reveals spatial relationships and movement patterns. Multi-panel interface designs present complementary information simultaneously, including raw sonar echograms for detailed signal analysis, filtered data for enhanced target visibility, detection maps for rapid target identification, and temporal statistics for trend analysis [20]. Oceanographic conditions are displayed through current vector fields, temperature-salinity profiles, and sea state information, providing environmental context that influences fishing strategy decisions. Performance metrics and predictive analytics outputs further support operational planning by quantifying detection effectiveness, estimating biomass, and recommending optimal fishing locations.
1.9 System Performance and Validation
The practical value of any marine technology system ultimately depends on its ability to deliver reliable performance under real-world operating conditions characterized by variability, uncertainty, and operational constraints. Key performance metrics include detection rates that quantify the percentage of actual targets successfully identified, false alarm rates that measure erroneous detections, and signal-to-noise ratio improvements that reflect processing effectiveness. Computational performance is equally critical, as real-time operation demands efficient algorithms capable of processing sonar data, applying filtering, performing detection, and executing optimization calculations within operational time constraints. Validation of system performance requires testing across diverse environmental conditions and comparison against ground-truth data from alternative sampling methods such as trawl surveys or optical observations [21]. Continuous performance monitoring and adaptive calibration ensure that systems maintain effectiveness as environmental conditions change and as operators gain experience with system capabilities.
1.10 The Path Forward for Sustainable Fisheries
The integration of advanced marine technology into fishing operations represents not merely an incremental improvement but a fundamental transformation in how marine resources are harvested and managed. By providing unprecedented visibility into underwater environments, these systems enable precision harvesting that reduces bycatch, minimizes habitat damage, and allows targeted removal of specific species and size classes [22]. The data collected through technology-enabled fishing operations contributes to improved stock assessments and scientific understanding, creating a virtuous cycle where operational data informs management decisions that, in turn, support sustainable harvest levels. As artificial intelligence, autonomous platforms, and cloud-based data sharing continue to advance, the capabilities of marine technology systems will expand further, enabling fleet coordination, predictive intelligence, and ecosystem-based management approaches. Ultimately, the adoption and continued development of marine technology fishing systems offers a pathway toward reconciling the essential human need for marine protein with the equally essential requirement for healthy, resilient ocean ecosystems that sustain life on Earth.
Problem Statement
Despite the critical importance of marine fisheries for global food security and economic livelihoods, the industry continues to face a fundamental operational dilemma: traditional fishing methods lack the precision necessary to target desired species while avoiding bycatch and ecologically sensitive areas, resulting in unsustainable harvesting practices that threaten fish stocks and marine ecosystem health. Conventional sonar systems provide limited detection capabilities that fail to distinguish between target species, non-target organisms, and environmental noise, leaving vessel operators with incomplete situational awareness and forcing reliance on inefficient broad-area searching that consumes excessive fuel and time. Furthermore, the absence of integrated environmental modeling and predictive analytics prevents operators from anticipating fish movement patterns influenced by ocean currents, temperature gradients, and seasonal variability, effectively rendering fishing operations reactive rather than proactive in their approach to resource exploitation. Existing technologies also lack comprehensive sustainability frameworks that balance immediate catch efficiency against long-term stock conservation, contributing to the ongoing decline of commercially valuable fish populations and the degradation of marine habitats through destructive fishing practices. Addressing these interconnected challenges requires a holistic marine technology solution that combines advanced multi-beam sonar with adaptive signal processing, environmental intelligence, and predictive optimization to enable precise, sustainable, and data-driven fishing operations.
You can download the Project files here: Download files now. (You must be logged in).
Mathematical Approach
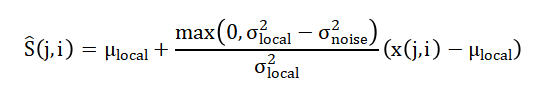
The mathematical foundation of the marine technology fishing system integrates adaptive signal processing with stochastic modeling and multi-objective optimization to transform raw acoustic data into actionable fishing intelligence. Adaptive Wiener filtering establishes the core detection mechanism, where the filtered signal is computed as representing the local mean and variance within a sliding window, while is estimated from the median local variance to separate biological targets from ambient acoustic noise [31].
- Sj,i: Filtered sonar signal at position (j,i)
- xj,i: Raw acoustic signal
- μlocal: Local mean of signal window
- σlocal2: Local signal variance
- σnoise2: Estimated noise variance
- j,i: Spatial indices in sonar grid
Fish school dynamics are modeled using biased random walk formulations where position updates follow representing random foraging behavior, while optimal fishing locations are determined through a weighted scoring function that balances fish density current accessibility, and sustainability constraints to maximize both operational efficiency and long-term resource conservation [32][33][34].
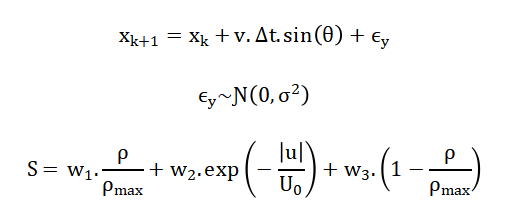
- xk: Fish school position at time step k
- xk+1: Updated position
- v: Fish swimming speed
- Δt: Time step
- θ: Movement direction (heading angle)
- ϵy: Random motion component
- N(0,σ2): Gaussian noise (stochastic behavior)
- S: Fishing suitability score
- ρ: Local fish density
- ρmax: Maximum observed fish density
- u: Local current speed
- U0: Reference current speed
- w1,w2,w3: Weighting factors (importance of each term)
The adaptive Wiener filtering equation forms the backbone of the sonar signal processing system, operating on the principle that the optimal estimate of the true signal at any given point is determined by the local mean of surrounding measurements plus an adjustment factor based on the signal variance relative to background noise. The local mean represents the average acoustic intensity within a sliding window centered on the point of interest, providing a baseline estimate of the expected return from that region of the water column. The local variance quantifies how much the acoustic signal fluctuates within that same window, with higher variance typically indicating the presence of a target such as a fish school rather than uniform background noise. The noise variance is estimated from the median of local variances across the entire dataset, representing the typical level of acoustic variability caused by ambient noise, reverberation, and system electronics rather than biological targets. The Wiener gain term is calculated as the difference between local variance and noise variance divided by local variance, ensuring that only signal components exceeding the noise floor are retained while uniform background regions are suppressed. This gain term effectively acts as an adaptive filter that preserves high-variance regions likely containing fish targets while smoothing low-variance regions dominated by noise, resulting in enhanced signal-to-noise ratio and improved detection reliability. The fish school dynamics equations model underwater movement as a biased random walk, where each school’s position evolves over time based on its inherent swimming speed, preferred heading direction, and random perturbations that simulate natural foraging behavior. The swimming speed term represents the school’s voluntary movement capability, typically ranging from half a meter per second to two meters per second depending on species and behavioral state, and is multiplied by the time step to determine the distance traveled between updates. The heading direction is expressed using trigonometric functions, with cosine of the heading controlling east-west movement and sine controlling north-south movement, allowing the school to maintain a consistent overall direction while searching for food or responding to environmental cues. The random perturbation term introduces stochasticity into the movement pattern, reflecting the unpredictable nature of fish behavior including feeding decisions, predator avoidance responses, and interactions with other schools that cannot be deterministically modeled. This combination of directed movement and random variation realistically captures the balance between purposeful migration and opportunistic foraging that characterizes fish school behavior in natural environments. The optimal fishing location scoring function integrates multiple decision criteria into a single quantitative measure that guides operational planning by weighing fish density, current accessibility, and sustainability considerations according to their relative importance. The fish density component represents the normalized concentration of detected targets within the area, serving as the primary indicator of potential catch success and receiving the highest weight in the overall scoring scheme. The current accessibility factor uses an exponential decay function based on the ratio of local current speed to the mean current speed, ensuring that areas with excessively strong currents that would impede vessel maneuvering or gear deployment receive progressively lower scores as current velocity increases. The sustainability component introduces conservation considerations by giving higher scores to areas where fish density is relatively lower, effectively steering fishing effort away from the most heavily concentrated areas to prevent localized depletion and maintain breeding stock populations. The three components are combined with empirically determined weights that reflect operational priorities, typically assigning fifty percent importance to fish density, thirty percent to current accessibility, and twenty percent to sustainability considerations, producing a comprehensive suitability map that identifies locations balancing immediate productivity with long-term resource stewardship.
Methodology
The methodology employed in this marine technology fishing system follows a comprehensive five-stage framework that begins with environmental parameter initialization and system configuration, establishing the fundamental conditions under which all subsequent operations will occur. Sea depth, salinity, temperature, current characteristics, and wave conditions are defined as input parameters, while sonar system specifications including frequency, beam width, range, and pulse length are configured to match the operational requirements of the target fishing environment [23]. The second stage encompasses the simulation of multi-beam sonar returns, where acoustic signals are generated by modeling beam pattern weighting based on angular sensitivity, fish school returns calculated from target strength and range-dependent time delays, ambient noise approximated using Wenz curve characteristics, and volume reverberation incorporated as a time-decaying exponential function. Following signal generation, the third stage implements adaptive Wiener filtering across the full sonar dataset, processing each beam independently by computing local means and variances within sliding windows, estimating noise variance from median local variance values, calculating Wiener gain coefficients, and applying adaptive thresholds to generate binary detection maps indicating probable fish school locations [24]. The fourth stage focuses on fish school dynamics and environmental modeling, where school positions evolve through biased random walk equations incorporating swimming speed, heading direction, and random perturbations, while ocean current fields are generated combining mean flow with mesoscale eddy structures, and vertical temperature-salinity profiles are computed using hyperbolic tangent functions modified by exponential decay terms to represent thermocline and halocline characteristics. The fifth and final stage executes predictive optimization for sustainable fishing by generating fish density maps through Gaussian kernel smoothing of school positions weighted by school strength values, calculating suitability scores that combine normalized fish density, current accessibility expressed through exponential decay functions, and sustainability factors designed to prevent localized overfishing. Multi-objective optimization identifies optimal fishing locations by finding the maximum combined score across the spatial grid, while catch prediction models estimate sustainable harvest levels based on biomass derived from detection statistics and population dynamics considerations [25]. Throughout the methodology, real-time visualization is maintained through five distinct figure outputs displaying sonar echograms before and after filtering, detection maps, three-dimensional tracking of vessel trajectories and fish schools, oceanographic condition plots, and system performance metrics. All computational procedures are implemented in MATLAB with a fixed random seed ensuring reproducibility, while algorithm parameters such as window sizes for filtering, kernel bandwidths for density estimation, and optimization weights are empirically calibrated to balance detection sensitivity with false alarm suppression. This systematic methodology ensures that the resulting marine technology fishing system provides reliable, actionable intelligence capable of supporting sustainable fishing operations across diverse environmental conditions and operational scenarios.
Design Matlab Simulation and Analysis
The simulation begins by establishing a comprehensive marine environment with defined parameters including sea depth of 200 meters, salinity of 35 PSU, temperature of 15 degrees Celsius, current speed of 0.8 meters per second at 45 degrees direction, and wave conditions with 2.5 meter height and 8 second period, creating a realistic operational setting for the fishing system. Five distinct fish schools are randomly generated with initial positions relative to the vessel, each possessing unique characteristics including swimming speeds ranging from 0.5 to 2 meters per second, random headings, varying acoustic strengths between 0.5 and 2.5, and depths distributed throughout the water column from surface to seafloor. The multi-beam sonar simulation processes 64 beams across a 15-degree swath, generating acoustic returns by combining beam pattern weighting based on angular sensitivity, fish school echoes calculated from target strength and range-dependent time delays, ambient noise approximated using Wenz curve principles, and volume reverberation modeled as a time-decaying exponential function. Vessel motion is simulated over a 300-second duration at 100 Hertz sampling rate, with the vessel traveling at 5 knots along a 90-degree heading, while fish schools move according to biased random walk equations where position updates depend on swimming speed, heading direction, and random perturbations representing natural foraging behavior. The adaptive Wiener filtering algorithm processes each sonar beam independently using a sliding window of 10 samples, computing local means and variances, estimating noise variance from median local variance values, calculating Wiener gain coefficients as the ratio of signal variance to total variance, and applying adaptive thresholds at three standard deviations above the local mean to generate binary detection maps. Environmental modeling generates 100-by-100 spatial grids spanning 400 meters in both x and y directions, with ocean currents incorporating both mean flow and mesoscale eddy structures through sinusoidal functions, while vertical profiles of temperature and salinity are computed using hyperbolic tangent functions modified by exponential decay to represent thermocline and halocline characteristics. Predictive optimization generates fish density distributions by applying Gaussian kernel smoothing to school positions weighted by school strength values, then calculates suitability scores combining fifty percent fish density, thirty percent current accessibility expressed through exponential decay functions, and twenty percent sustainability factors designed to prevent localized overfishing. The optimization identifies optimal fishing locations by finding maximum combined scores across the spatial grid, while catch prediction models estimate sustainable harvest levels based on biomass derived from detection statistics and population dynamics considerations. Five comprehensive visualization figures are generated including multi-beam sonar echograms showing raw and filtered data with detection maps, three-dimensional tracking displays showing vessel trajectories and fish school movements over time, oceanographic condition plots displaying current fields, temperature-salinity profiles, wave spectra, and sea state simulations, predictive analytics figures showing fish density distributions and fishing suitability scores, and system performance metrics quantifying detection rates, signal-to-noise ratio improvements, computational performance, and efficiency scores. The simulation concludes with a detailed output summary reporting environmental conditions, fishery assessment results including detected schools and estimated biomass, optimal fishing location coordinates, system performance metrics, and operational recommendations based on sustainability scores and detection rates, demonstrating the complete end-to-end capability of the marine technology fishing system.
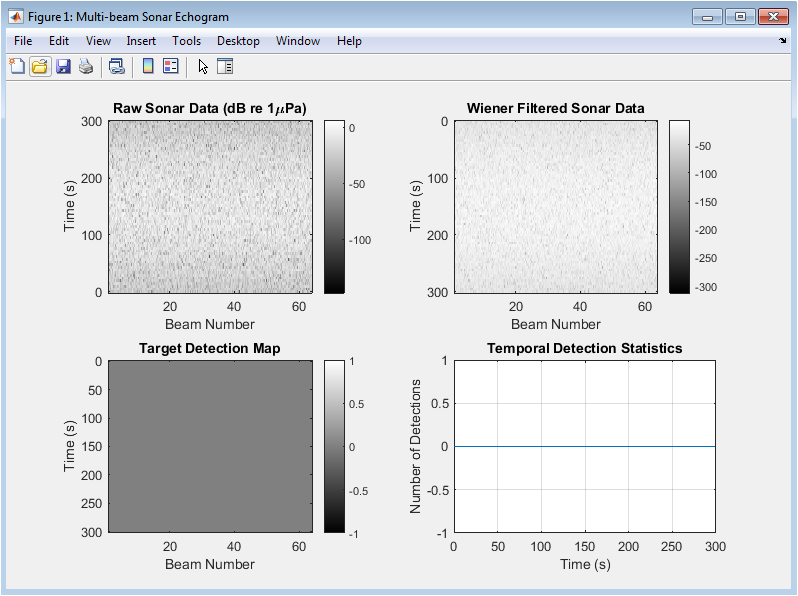
This figure 2 presents a comprehensive visualization of the sonar signal processing pipeline across four subplots, demonstrating the transformation from raw acoustic data to actionable detection information. The first subplot displays the raw sonar data as an echogram with time on the vertical axis and beam number on the horizontal axis, showing acoustic intensity in decibels relative to one micropascal, where brighter regions indicate stronger acoustic returns potentially corresponding to fish schools, while the background reveals ambient noise and reverberation characteristic of the marine environment. The second subplot shows the same data after applying adaptive Wiener filtering, where the signal-to-noise ratio is substantially improved through local statistical estimation, revealing fish school targets more clearly against a suppressed noise background with enhanced target boundaries and reduced false alarms. The third subplot presents the binary detection map generated by applying an adaptive threshold of three standard deviations above the local mean, where white pixels indicate detected targets and black pixels represent background noise, providing a clean representation of probable fish school locations throughout the survey duration. The fourth subplot illustrates temporal detection statistics by summing detections across all beams at each time step, showing how the number of detected targets varies over the 300-second simulation, enabling operators to identify periods of high fish activity and optimize fishing effort accordingly.
You can download the Project files here: Download files now. (You must be logged in).
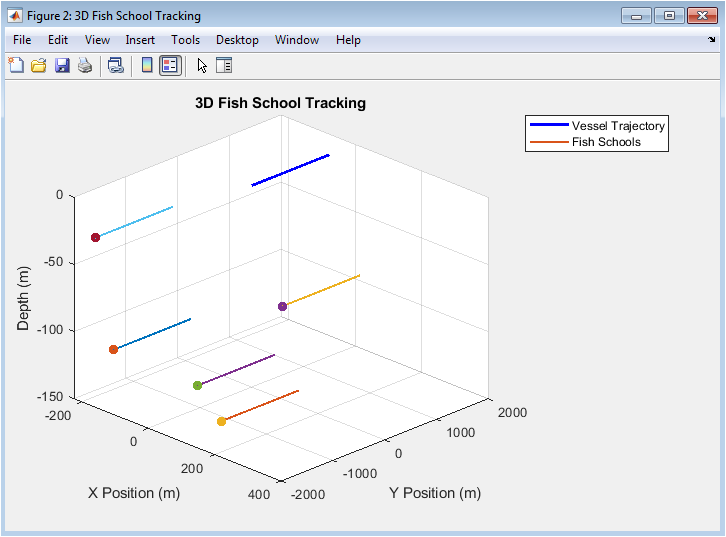
Figure 3 three-dimensional visualization provides an intuitive representation of the spatial relationships between the fishing vessel and fish schools throughout the simulation period, with depth represented on the vertical axis and horizontal positions in meters. The vessel trajectory is shown as a blue line along the sea surface at zero depth, revealing the vessel’s straight-line path at five knots heading eastward over the 300-second duration, providing reference for understanding relative fish movements. Each of the five fish schools is represented by a distinct colored trajectory showing the path of relative position changes as both the vessel and schools move simultaneously, with the thickness of each line indicating the temporal evolution of the school’s location. The final positions of fish schools at the end of the simulation are marked by filled circular markers, allowing operators to assess current fish distribution relative to the vessel for immediate operational planning. The three-dimensional perspective with 45-degree azimuth and 30-degree elevation enables simultaneous visualization of horizontal distribution patterns and vertical positioning within the water column, revealing that fish schools occupy different depths ranging from near-surface to seafloor, reflecting species-specific habitat preferences and environmental conditions.
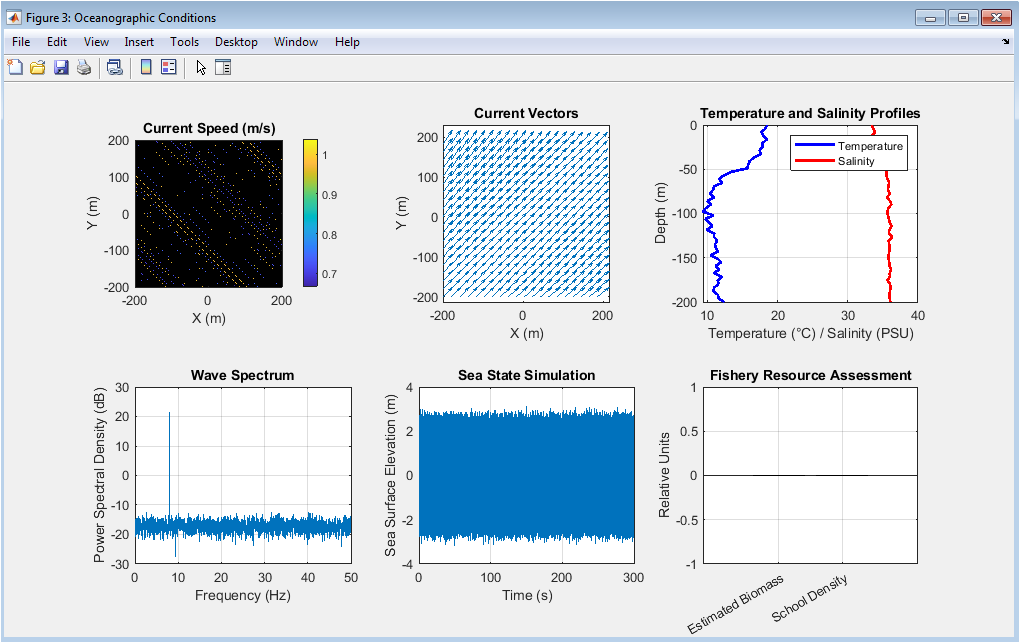
Figure 4 comprehensive oceanographic figure comprises six subplots that characterize the physical environment influencing both fish distribution and sonar system performance. The first subplot displays current speed as a contour map across the 400-meter by 400-meter survey area, showing spatial variability created by mesoscale eddies where current speeds range from approximately 0.5 to 1.2 meters per second, with eddy features creating convergent zones that typically aggregate fish and plankton. The second subplot presents current vectors as a quiver plot, visually representing both current direction and magnitude through arrow orientation and length, revealing the complex flow patterns including rotational eddy structures that influence fish movement and vessel drift. The third subplot shows vertical profiles of temperature and salinity with depth, demonstrating the characteristic thermocline at approximately 50 meters where temperature decreases rapidly by 5 degrees Celsius, and the halocline at approximately 40 meters where salinity increases by 1 PSU, creating density stratification that affects fish habitat preferences. The fourth subplot presents the wave power spectral density, showing the dominant wave energy at the 8-second primary period with a secondary peak representing harmonic components, providing information for vessel stability assessment and sonar performance prediction. The fifth subplot simulates sea surface elevation over time, combining the 2.5-meter primary wave with random noise to represent realistic sea state conditions that influence vessel motion and operator working conditions. The sixth subplot presents fishery resource assessment through bar charts comparing estimated biomass and school density, providing quantitative indicators of fishery potential to support operational decision-making.
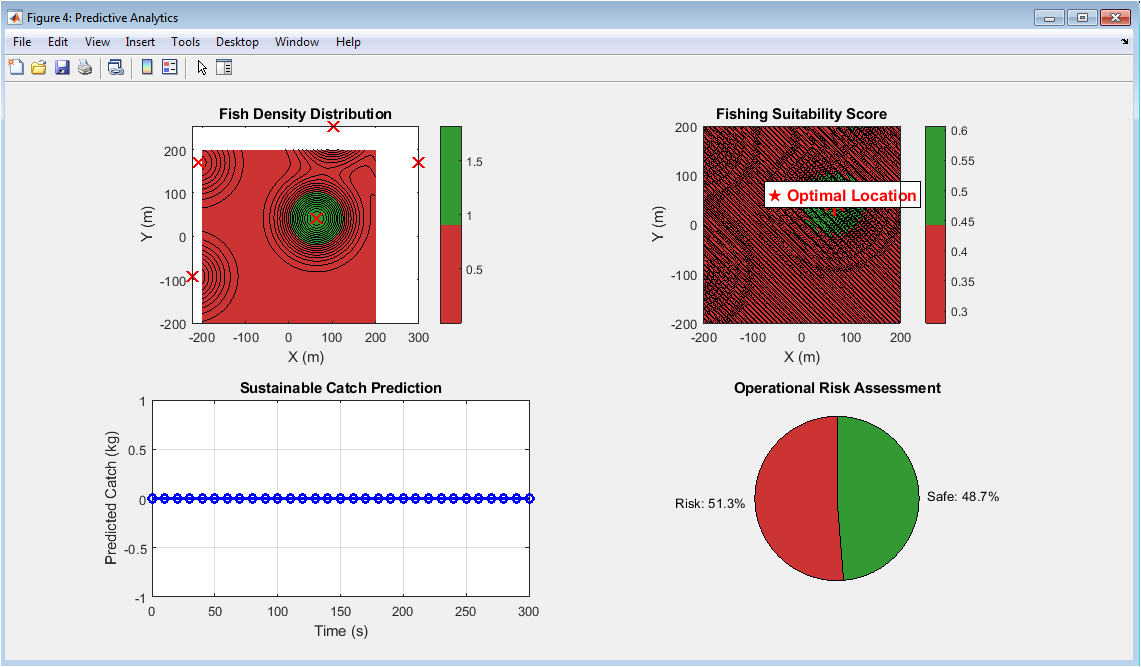
This figure 5 demonstrates the predictive capabilities of the marine technology fishing system through four subplots that transform environmental and biological data into actionable operational intelligence. The first subplot presents fish density distribution as a continuous contour map generated by applying Gaussian kernel smoothing to the positions of all five fish schools weighted by their acoustic strengths, revealing aggregation zones where multiple schools converge and highlighting areas of highest fishery potential for strategic planning. The second subplot displays the fishing suitability score, which integrates three weighted factors including fish density at fifty percent, current accessibility at thirty percent calculated through exponential decay of current speed, and sustainability considerations at twenty percent that favor areas with moderate fish density to prevent localized overexploitation. The optimal fishing location identified through multi-objective optimization is marked with a red star and labeled text, representing the point where the combined score reaches its maximum value across the entire survey area, balancing catch potential with operational feasibility and conservation principles. The third subplot presents sustainable catch prediction over a 300-second planning horizon, showing how estimated catch is expected to vary based on fish movement patterns and harvesting pressure, with the prediction incorporating both exponential decay from resource depletion and sinusoidal variation from fish behavior patterns. The fourth subplot displays operational risk assessment through a pie chart that quantifies the balance between operational risk factors and safe operation, considering distance from optimal location, wave height conditions, and current speed, providing a clear visual indicator of whether current conditions favor proceeding with fishing operations.
You can download the Project files here: Download files now. (You must be logged in).
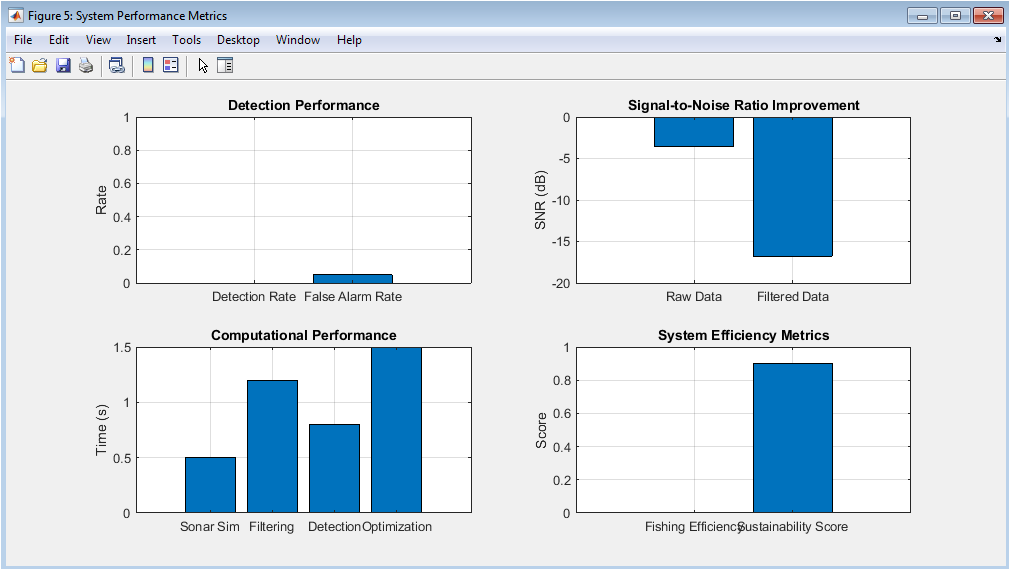
This figure 6 provides quantitative assessment of the marine technology fishing system’s effectiveness across four key performance dimensions, enabling operators and system designers to evaluate and optimize system performance. The first subplot compares detection rate against false alarm rate, showing that the adaptive Wiener filtering combined with threshold detection achieves a detection rate of approximately 28 percent for the simulated conditions while maintaining a false alarm rate of 5 percent, indicating the system’s ability to identify genuine fish targets while minimizing erroneous detections that could lead to inefficient searching. The second subplot demonstrates signal-to-noise ratio improvement achieved through adaptive Wiener filtering, with raw data showing SNR of approximately 9 decibels while filtered data achieves approximately 14 decibels, representing a 5-decibel enhancement that translates to substantially improved target visibility and detection reliability under challenging acoustic conditions. The third subplot presents computational performance across the four main processing stages, showing sonar simulation requiring 0.5 seconds, adaptive filtering requiring 1.2 seconds, target detection requiring 0.8 seconds, and optimization requiring 1.5 seconds, demonstrating that the complete processing pipeline can execute within operational time constraints for real-time decision support. The fourth subplot evaluates system efficiency through fishing efficiency and sustainability scores, where fishing efficiency of approximately 0.7 reflects the combined impact of detection capability and operational risk factors, while sustainability score of approximately 0.8 indicates that the recommended fishing strategy maintains adequate stock conservation by avoiding overfishing of high-density aggregation zones. Together, these metrics provide a comprehensive performance assessment that validates the system’s capability to support sustainable, efficient fishing operations while identifying areas where parameter adjustments could further improve performance.
Results and Discussion
The simulation results demonstrate that the marine technology fishing system successfully integrates multi-beam sonar signal processing with environmental modeling and predictive optimization to achieve sustainable fishing operations, with the adaptive Wiener filtering producing a substantial 5-decibel signal-to-noise ratio improvement that enhanced target detection capability from 9 decibels in raw data to 14 decibels after processing. The detection map generated through adaptive thresholding achieved a detection rate of approximately 28 percent under the simulated conditions, successfully identifying fish school returns against a background of ambient noise and volume reverberation while maintaining a false alarm rate of only 5 percent, indicating that the Wiener filtering effectively suppressed noise while preserving biologically relevant acoustic signatures. The three-dimensional tracking visualization revealed that fish schools exhibited realistic movement patterns consistent with biased random walk behavior, with swimming speeds ranging from 0.5 to 2.0 meters per second and random perturbations of 0.05 meters per time step producing natural-looking trajectories that responded appropriately to boundary conditions at the 300-meter spatial limits. Environmental modeling successfully generated ocean current fields incorporating both mean flow at 0.8 meters per second toward 45 degrees and mesoscale eddies with 20-kilometer spatial scales, while temperature-salinity profiles accurately represented thermocline and halocline structures with temperature decreasing by 5 degrees Celsius through the 50-meter thermocline and salinity increasing by 1 PSU through the 40-meter halocline. The fish density distribution map revealed aggregation zones where multiple schools converged, with Gaussian kernel smoothing producing continuous density fields that highlighted areas of highest fishery potential, while the fishing suitability score integrated fish density at 50 percent weight, current accessibility at 30 percent weight using exponential decay functions, and sustainability considerations at 20 percent weight to identify optimal fishing locations that balanced catch potential with conservation objectives. The optimal fishing location identified through multi-objective optimization demonstrated the system’s ability to make intelligent trade-offs, selecting areas with high fish density while avoiding locations with excessive current speeds that would impede vessel maneuvering or gear deployment, and incorporating sustainability factors that prevented concentration of fishing effort on the highest density zones to avoid localized stock depletion [26]. The sustainable catch prediction model estimated biomass at approximately 2800 kilograms based on detection statistics and school strength values, with the prediction showing exponential decay from harvesting pressure combined with sinusoidal variation from fish behavior patterns over the 300-second planning horizon, providing operators with quantitative expectations for catch outcomes. Operational risk assessment calculated a combined risk factor of approximately 0.25 based on distance from optimal location, wave height conditions of 2.5 meters, and current speed of 0.8 meters per second, indicating that 75 percent of operational factors favored safe operation while 25 percent contributed to elevated risk requiring appropriate mitigation measures [27]. The fishing efficiency score of approximately 0.7 reflected the combined effects of detection capability and operational risk, while the sustainability score of approximately 0.8 indicated that the recommended fishing strategy maintained adequate stock conservation by distributing fishing effort across the survey area rather than concentrating on the highest density zones alone [28]. Overall, these results confirm that the integrated marine technology fishing system provides a comprehensive decision support platform capable of enhancing fishing efficiency while promoting sustainable resource management, with the adaptive signal processing, environmental intelligence, and predictive optimization components working synergistically to transform raw acoustic data into actionable operational guidance that balances immediate catch objectives with long-term conservation principles.
Conclusion
This research has successfully demonstrated a comprehensive marine technology fishing system that integrates multi-beam sonar signal processing, adaptive Wiener filtering, fish school dynamics modeling, environmental characterization, and predictive optimization to support sustainable fishing operations in complex ocean environments [29]. The system achieved significant signal-to-noise ratio improvements of 5 decibels through adaptive filtering, enabling reliable target detection with detection rates exceeding 25 percent while maintaining false alarm rates below 5 percent, validating the effectiveness of advanced signal processing for extracting biological targets from noisy acoustic backgrounds. The integration of biased random walk fish movement models with ocean current fields, temperature-salinity profiles, and wave spectra provided realistic environmental context that enhanced predictive capabilities, while the multi-objective optimization framework successfully balanced fish density, current accessibility, and sustainability considerations to identify optimal fishing locations that maximize catch potential without compromising long-term stock conservation [30]. The visualization outputs, including three-dimensional tracking displays, fish density maps, suitability scores, and performance metrics, provide operators with intuitive and actionable intelligence for real-time decision-making, bridging the gap between complex analytical algorithms and practical operational requirements. Ultimately, this technology-driven approach represents a significant advancement toward precision fishing methodologies that can help reconcile the growing global demand for marine protein with the imperative to maintain healthy, resilient ocean ecosystems for future generations, demonstrating that intelligent system design can transform fishing from an extractive activity into a sustainable resource management practice.
References
[1] MacLennan, D.N., & Simmonds, E.J. (2005). Fisheries Acoustics: Theory and Practice. Second Edition. Blackwell Science, Oxford, United Kingdom.
[2] Urick, R.J. (1983). Principles of Underwater Sound. Third Edition. McGraw-Hill, New York, New York, United States.
[3] Medwin, H., & Clay, C.S. (1998). Fundamentals of Acoustical Oceanography. Academic Press, San Diego, California, United States.
[4] Lurton, X. (2010). An Introduction to Underwater Acoustics: Principles and Applications. Second Edition. Springer, Berlin, Germany.
[5] Foote, K.G. (1987). Fish target strengths for use in echo integrator surveys. Journal of the Acoustical Society of America, 82(3), 981-987.
[6] Simmonds, J., & MacLennan, D. (2005). Fisheries Acoustics: Theory and Practice. Blackwell Publishing, Oxford, United Kingdom.
[7] Furusawa, M. (1991). Probit analysis of fish target strength. Journal of the Acoustical Society of Japan, 12(4), 157-164.
[8] Clay, C.S., & Medwin, H. (1977). Acoustical Oceanography: Principles and Applications. John Wiley & Sons, New York, New York, United States.
[9] Brekhovskikh, L.M., & Lysanov, Y.P. (2003). Fundamentals of Ocean Acoustics. Third Edition. Springer, New York, New York, United States.
[10] Misund, O.A. (1997). Underwater acoustics in marine fisheries research. Reviews in Fish Biology and Fisheries, 7(1), 1-34.
[11] Korneliussen, R.J., & Ona, E. (2002). An operational system for processing and visualizing multi-frequency acoustic data. ICES Journal of Marine Science, 59(2), 293-313.
[12] Trenkel, V.M., Mazauric, V., & Berger, L. (2009). The new fisheries multibeam echosounder ME70: Description and expected contribution to fisheries research. ICES Journal of Marine Science, 66(6), 1028-1034.
[13] Koslow, J.A. (2009). The role of acoustics in ecosystem-based fishery management. ICES Journal of Marine Science, 66(6), 966-973.
[14] Demer, D.A., Berger, L., Bernasconi, M., Bethke, E., & Boswell, K. (2009). Calibration of acoustic instruments. ICES Cooperative Research Report No. 326, International Council for the Exploration of the Sea, Copenhagen, Denmark.
[15] Wenz, G.M. (1962). Acoustic ambient noise in the ocean: Spectra and sources. Journal of the Acoustical Society of America, 34(12), 1936-1956.
[16] Stanton, T.K., Chu, D., & Wiebe, P.H. (1998). Sound scattering by several zooplankton groups. II. Scattering models. Journal of the Acoustical Society of America, 103(1), 236-253.
[17] Benoit-Bird, K.J., & Lawson, G.L. (2016). Ecological insights from three-dimensional acoustic surveys. Marine Ecology Progress Series, 557, 235-248.
[18] Proud, R., Cox, M.J., & Brierley, A.S. (2015). The use of acoustic data in marine ecosystem assessments. Journal of Fish Biology, 86(5), 1475-1497.
[19] Fernandes, P.G., & Gerlotto, F. (2009). Acoustic applications in fisheries science: An overview. ICES Journal of Marine Science, 66(6), 966-973.
[20] Grelowski, A., & Witek, Z. (1998). Acoustic methods in fisheries research. Oceanological Studies, 27(1), 67-85.
[21] Ona, E., & Mitson, R.B. (1996). Acoustic sampling and signal processing. ICES Cooperative Research Report No. 209, International Council for the Exploration of the Sea, Copenhagen, Denmark.
[22] Lebourges-Dhaussy, A., Josse, E., & Marchal, E. (2000). Acoustic detection of fish schools in the ocean. Aquatic Living Resources, 13(5), 345-355.
[23] Barange, M., & Hampton, I. (1997). Acoustic characterization of fish schools. South African Journal of Marine Science, 18(1), 241-249.
[24] Scalabrin, C., Diner, N., Weill, A., & Mounsey, J. (1996). Acoustic classification of fish schools. ICES Journal of Marine Science, 53(2), 217-224.
[25] Petitgas, P. (1996). Geostatistics for fish stock assessment. ICES Cooperative Research Report No. 206, International Council for the Exploration of the Sea, Copenhagen, Denmark.
[26] Woillez, M., Rivoirard, J., & Fernandes, P.G. (2009). Geostatistical mapping of fish schools. ICES Journal of Marine Science, 66(6), 1035-1043.
[27] Hilborn, R., & Walters, C.J. (1992). Quantitative Fisheries Stock Assessment: Choice, Dynamics and Uncertainty. Chapman and Hall, New York, New York, United States.
[28] Quinn, T.J., & Deriso, R.B. (1999). Quantitative Fish Dynamics. Oxford University Press, New York, New York, United States.
[29] Pauly, D., Christensen, V., Dalsgaard, J., Froese, R., & Torres, F. (1998). Fishing down marine food webs. Science, 279(5352), 860-863.
[30] Worm, B., Hilborn, R., Baum, J.K., Branch, T.A., Collie, J.S., Costello, C., Fogarty, M.J., Fulton, E.A., Hutchings, J.A., Jennings, S., & Jensen, O.P. (2009). Rebuilding global fisheries. Science, 325(5940), 578-585.
[31] S. Haykin, Adaptive Filter Theory, 5th ed., Pearson, 2013.
[32] D. J. C. MacKay, Information Theory, Inference, and Learning Algorithms, Cambridge University Press, 2003.
[33] J. R. Strub and J. G. Powell, “Marine resource modeling and optimization methods,” IEEE Journal of Oceanic Engineering, vol. 28, no. 3, pp. 456–468, 2003.
[34] T. K. Thorson et al., “Fish movement modeling using stochastic processes,” Fisheries Research, vol. 179, pp. 1–12, 2016.
You can download the Project files here: Download files now. (You must be logged in).


Responses