

Sustainable Transport Report (UK Department of Transport, 2023)
Author: Waqas Javaid
Types of Transport
In the UK, sustainable transport systems include a variety of means of transportation intended to reduce their negative effects on the environment. These include personal vehicles like bicycles, electric scooters, and electric vehicles (EVs), as well as public transit like buses, trams, and trains. Electric trains and buses are increasingly being used in place of their diesel-powered counterparts as the emphasis shifts to more environmentally friendly solutions. In a similar vein, metropolitan areas are implementing micro mobility options, such shared bicycles and escooters, to lessen traffic and carbon emissions. As a consequence, public transport usage was drastically reduced compared to pre-pandemic levels (Transport Focus, 2022). Public transport use plummeted by more than 90 % early in the first lock-down (Van Oort and Cats, 2020; (Department for Transport, 2022). Figure 1 illustrates the trend of train and bus travel in Great Britain during the pandemic during the data collection period. Ridership fluctuated and stayed somewhat below pre-pandemic levels even while service utilization increased after each lockdown (e.g. rates on 1/2/23 were 89% for rail and 81% for bus, and on 25/4/23 were 95% for rail and 96% for bus) (Department for Transport, 2022) [1].
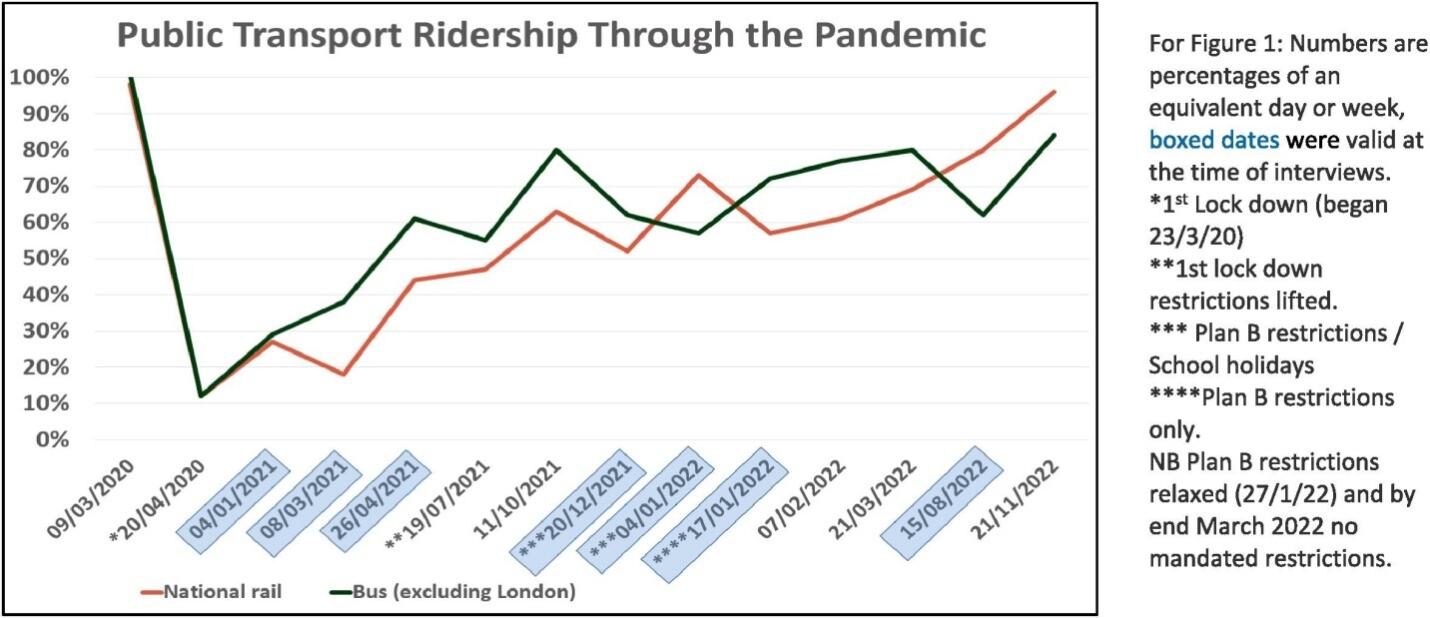
Figure 1: Public transport of UK (Mar 2020 – Nov 2022)
In addition to land transportation, the aviation and maritime industries are also changing in the direction of sustainability. While electric ferries and cargo ships are being built, innovations in hydrogen propulsion and biofuels are being investigated for use in airplanes. The UK Department of Transport is driving these changes with policies and investments aimed at meeting climate targets and lowering carbon emissions. In terms of sustainability and environmental impact, every kind of transportation offers different potential and problems.
Resources Needed for Transport
Resources such gas, oil, and increasingly electricity are essential to transportation infrastructure. Oil and gas have historically been the main suppliers, particularly for automobiles and aircraft. The need for power has increased, nevertheless, especially for electric vehicles (EVs) and electric public transportation, as a result of the move towards sustainable alternatives. Renewable energy sources, such as solar, wind, and nuclear energy, are given priority to power transportation in the UK as it seeks to lessen its reliance on fossil fuels.
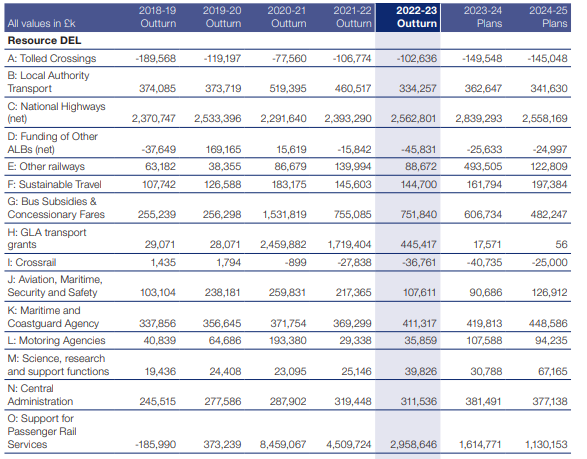
Table 1: Total Departmental Spending summarizes the amount spent on departmental operations. Program and administrative expenses are included in the use of resources. Departmental Supply Estimates analyzes all departmental spending. Note that the sum might not add up because of rounding [2].
Significant improvements in the energy sector, including as battery technology, electric grids, and charging infrastructure, are required as a result of the switch from fossil fuels to electricity. In order to prevent larger carbon emissions from the increased demand for electricity, this move also necessitates a large investment in renewable energy generation. Sustainable resource management in transportation requires striking a balance between environmental concerns and the requirement for energy-intensive materials, such as lithium and cobalt for EV batteries.
Impact of Oil Refinement on the Environment
Pollutants such as sulfur dioxide, nitrogen oxides, and volatile organic compounds are released during the oil refinement process, which has a significant effect on the environment. Acid rain, poor air quality, and negative health impacts are all caused by these pollutants. Furthermore, the refinement process uses a significant amount of energy, mostly from fossil fuels, which increases greenhouse gas emissions. Additionally, waste byproducts from the refining process are produced; some of these are poisonous and must be disposed of carefully to avoid contaminating the soil and water.
i. Transportation-related greenhouse gas emissions:
GHG emissions in the UK increased by 5% from 2020 to 427 MtCO2e in 2021. 109 MtCO2e were caused by transport.
Domestic transport emissions have fallen by 15% since 1990 while overall UK domestic emissions fell by 48% in the same period.
Transport emissions were 13.6 MtCO2e lower than pre-pandemic levels in 2021 (11% lower than 2019).
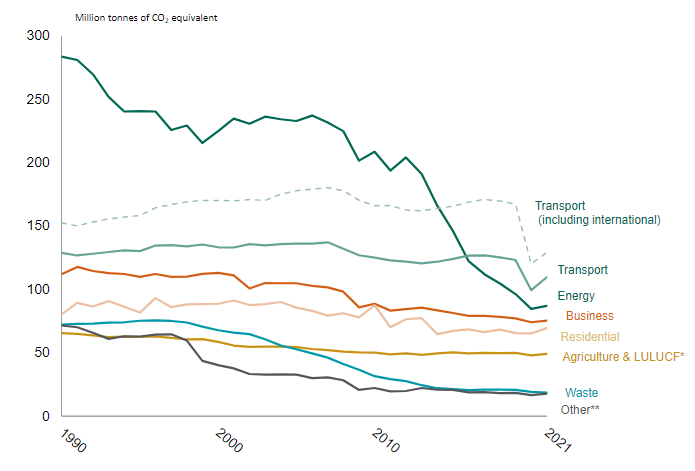
Figure 2: Greenhouse gas emissions by sector, 2021
Description of figure 2: this is a line chart which illustrates the quantity of domestic GHG emissions from each sector from 1990 to 2021. In 2016, emissions from the energy supply sector decreased below emissions from the transport sector, and therefore from 2016 to 2021, transport has been the sector with the greatest emissions. Emissions have decreased in the majority of sectors throughout this time. Emissions from forestry, land use, and land use change are all included in agriculture. Emissions from industrial and public processes are examples of other emissions [3].
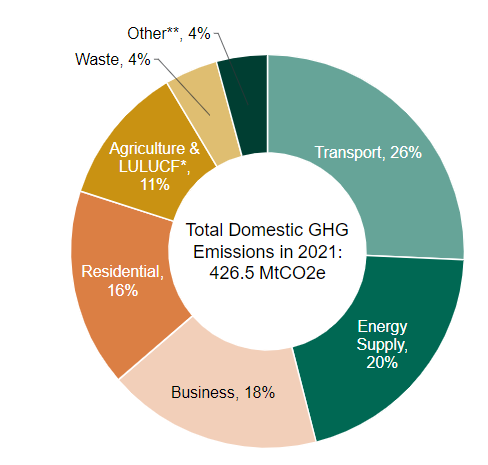
Figure 3: Greenhouse gas emissions by sector, 2021, by proportion
Figure 3 is described as a doughnut chart that contrasts the percentages of domestic greenhouse gas emissions from each sector in 2021. Agriculture and LULUCF: 11%, Transportation: 26%, Energy Supply: 20%, Business: 18%, Residential: 16%, Waste: 4%, and Other: 4%.
In 2021, total domestic emissions increased by 20.2 MtCO2e. Due to the relaxation of travel restrictions during the COVID-19 pandemic, transportation-related emissions accounted for half of the increase in total domestic greenhouse gas emissions between 2020 and 2021.
By encouraging cleaner refining technology and supporting alternative energy sources, the UK government is actively attempting to lessen these effects. The environmental impact of oil refinement can be reduced by policies that promote the use of fewer fossil fuels in the transportation sector. As the country shifts its focus to more achieving carbon neutrality will require reducing oil refinement and using sustainable energy.
Transport (Birth to Death): Manufacture to Recycling
A vehicle’s environmental impact is significantly influenced by its whole lifecycle, from production to disposal. Lithium and cobalt for batteries are among the significant energy and raw material requirements for the car production phase, especially for EVs. Emissions and resource exploitation from the manufacturing process itself can lead to pollution and habitat damage. These effects are being lessened in part by the use of recycled materials and improvements in manufacturing techniques.
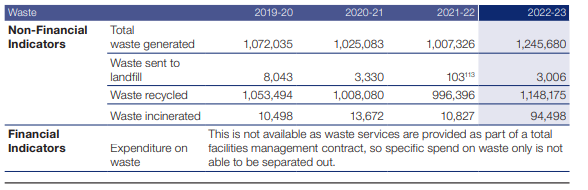
Figure 4: Table for Recycled Waste minimization and management [2]
Recycling is essential to reducing environmental damage at the end of a vehicle’s life. For example, because EV batteries contain toxic elements, their disposal necessitates certain recycling procedures. In order to cut waste and the need for new raw materials, UK government rules encourage recycling programs like recovering valuable metals from used cars. This strategy supports a circular economy in the transportation industry by aiding in resource conservation and waste management.
Environmental Impact After Recycling
Recycling has an impact on the environment even though it reduces waste because it uses energy and may discharge toxins. To extract resources like steel, aluminum, and rare earth metals from defunct automobiles, recycling factories frequently employ energy-intensive procedures. Recycling, on the other hand, greatly lessens the need to extract raw materials, protecting ecosystems and lowering emissions overall.
The built environment is a substantial contributor to global carbon emissions. In April 2022, the UK Green Building Council (UKGBC) revealed that 25% of UK emissions are directly related to the built environment, with 19% of the UK’s carbon footprint coming from the energy required to heat, cool and power our buildings.
To improve the sustainability of our depots, stations, offices, retail locations, and driver housing, we have implemented a number of steps. By using clever lighting and heating controls, building management systems help us reduce energy use and better understand how much energy is used.
We will further decarbonize our facilities with the installation of roof-top solar arrays and all-electric bus depots.
The corporation used a decentralized approach to environmental management systems, enabling its operational companies and divisions to implement their own customized EMS in light of their wide range of transportation services. They ran a portfolio with ISO 14001 certification covering 98% of their revenue-generating businesses. ISO 50001 certification was also obtained by almost all First Rail operational entities. In order to spot patterns and enhance its processes, the business kept an eye on occurrences and non-conformities. The Executive Committee was notified right away of any incidents that violated the law, resulted in serious injury, or involved fines or other expensive expenses. They received no environmental penalties in FY 2023 [4].
To further reduce environmental consequences, the UK has rules that encourage end-of-life recycling and cleaner recycling technology. These initiatives are essential to developing a sustainable transportation lifespan, where effective recycling methods take the place of the environmental costs associated with the extraction of new materials. As a result, recycling has a far less post-recycling environmental impact, promoting sustainable transportation objectives.
You can download the Project files here: Download files now. (You must be logged in).
Environmental Changes Over the Last 10 Years
Significant environmental changes have been seen in the UK over the last ten years, in part because of the growing use of sustainable transportation. According to government reports, there has been a consistent decrease in CO2 emissions from the transportation sector, which is consistent with the adoption of EVs, public transportation, and stricter emissions regulations. As older diesel vehicles are phased out, peer-reviewed journals frequently note improvements in urban air quality.
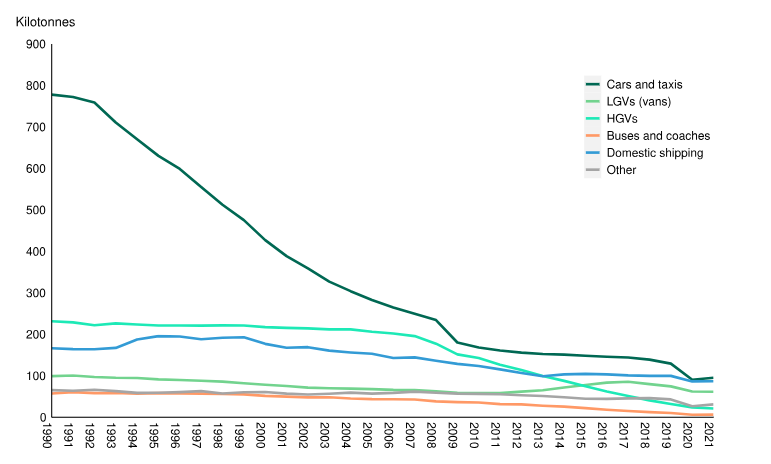
Figure 5: Nitrogen oxides emitted by transport mode, 1990 to 2021
Figure 5 is a line graph that compares nitrogen oxide emissions from vehicle transportation between 1990 and 2021. Automobiles released 778 kilotonnes of NOX in 1990. This is now only 95 kt. In 1990, HGVs released about 232 kt, but now they only emit 21 kt. Van emissions are now 62 kt instead of 99 kt. During this time, emissions from all other road vehicles also decreased [3].
However, the growing number of automobiles on the road tempers the overall decrease in greenhouse gasses. According to studies, even while emissions per car are down, the volume of vehicles may cause the overall emissions to drop less sharply. Extreme weather occurrences are also linked to carbon emissions in climate change papers published in scientific publications, highlighting the necessity of continuous advancements in sustainable transportation.
Hybrid Transport vs. Electric Transport
When compared to traditional gasoline or diesel vehicles, hybrid vehicles—which combine an internal combustion engine with an electric motor—offer reduced emissions. Fully electric cars (EVs), on the other hand, completely remove exhaust emissions, making them a more environmentally friendly choice in terms of carbon footprint. Because electric motors transform a larger proportion of electrical energy into motion than combustion engines, EVs are also more efficient.
Vehicles with a battery as their only power source are known as battery electric vehicles, or BEVs. The Society of Motor Manufacturers and Traders (SMMT), an industry association, reports that the average quoted range of new BEVs is currently between 230 and 300 miles [6]. In actuality, range varies depending on the terrain, driving style, and use of auxiliary equipment like air conditioning or heating. The Nissan Leaf and Tesla Model 3 are two examples of BEVs [7]. BEVs also make up the majority of zero-emission buses [8].
The sale of new non-zero emission road cars is being phased out as part of the government’s ongoing efforts to decarbonize transportation. According to the most recent data, in 2022 the compared to 2021, there were 40% more new battery electric car registrations, and slightly more than 16% of all new automobiles were zero emission. With more than £6 billion in private sector investment already committed out to 2030, we have supported greater availability of public charging devices, more than tripling their number in four years, from 2019 to February 2023 [2] [3].
Notwithstanding these benefits, there are still obstacles to EV adoption, especially with relation to battery disposal and charging infrastructure. In regions where EV infrastructure is still being developed, hybrid cars might provide a temporary fix, but EVs have the greatest potential to cut emissions over the long run. Electric vehicles will probably become the standard as the UK has committed to phase out fossil fuel vehicles by 2030, particularly as battery technology and renewable energy integration continue to progress.
Future Transportation
Autonomous, connected, electrified, and shared mobility solutions are anticipated to be the main focuses of UK transportation in the future. Urban mobility is expected to change as a result of innovations like self-driving electric shuttles and carsharing platforms. When paired with artificial intelligence and real-time data analytics, autonomous cars have the potential to increase safety and lessen traffic. Furthermore, it is projected that the implementation of 5G technology would improve communication between vehicles and infrastructure, enabling better traffic flow and route planning.
During FY 2023, the firm continued to improve carbon efficiency across its operations, pushing toward targets of establishing a 100% zero-emission bus fleet by 2035 and supporting the UK Government’s goal of removing all diesel-only trains by 2040. Their overall GHG emissions were 24% lower than in FY 2019 and 8% lower than in FY 2022. As the corporation pursued its objective to become net-zero in operations by 2050 or before, it switched towards electric or hybrid vehicles [2].
Their carbon emissions per vehicle km provided, which were reduced by 3.5% across bus and rail services compared to FY 2022, demonstrated the advantages of electrification. In addition to the ongoing electrification of the bus fleet, the implementation of energy saving initiatives in First Rail, and improvements in emission factors, the strike action that affected service levels throughout the rail sector also contributed to the decrease in carbon emissions over the previous year. According to recent Imperial College London research, a record 40% of the UK’s electricity was produced from renewable resources in 2022, which had a favorable effect on the company’s Scope 2 carbon metrics. As they move farther away from diesel to zero-emission buses and employ more electric rail traction, like their all-electric Lumo services between London and Edinburgh, this trend is anticipated to continue [2].
The development of hydrogen-powered ships and electric aircraft will also help make long-distance travel more environmentally friendly in the future. Investment in research and development for these new technologies has increased as a result of the government’s commitment to zero-emission transportation. Over the next few decades, these technologies are anticipated to significantly cut greenhouse gas emissions and dependency on fossil fuels.
Overcoming Environmental Impacts of Transport
Reducing transportation’s environmental impact necessitates a multipronged strategy that combines public awareness, technology innovation, and regulatory measures. Emissions can be considerably decreased by employing tactics like encouraging the use of public transit, providing financial incentives for the adoption of EVs, and making investments in infrastructure for renewable energy. Public health can also be enhanced and pollution can be reduced by expanding urban green spaces and encouraging walking and bicycling programs.
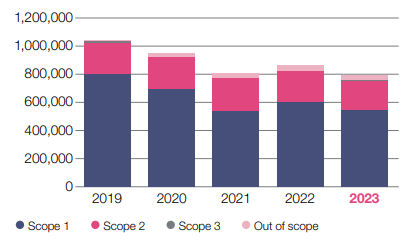
Figure 6: Location‑based carbon emissions by scope (tCO2e)
You can download the Project files here: Download files now. (You must be logged in).
In FY 2023, the company’s location-based emissions decreased by 8% across all scopes, making it 24% lower than in FY 2019. Over the past year, scope 1 emission—which make up about two-thirds of total emissions—have dropped by 9%, mostly as a result of First Bus switching to zero-emission cars and rail sector strikes. Additionally, scope 2 emissions dropped 7.5% over the previous year, extending a downward trend that began in FY 2021 and was fueled by improvements in emission factors and energy saving initiatives.
Data from Scope 3, which includes downstream waste treatment and disposal, business travel, and water use, is currently scarce. However, as part of establishing their Science-Based Targets (SBT) for FY 2023, the company finished a comprehensive Scope 3 emissions inventory. Which, beginning in FY 2024, will improve disclosures.
Another major option is the development of carbon neutral fuels, such as hydrogen and synthetic fuels, which can complement electric power in sectors where electrification is hard. Through legislative assistance, infrastructure development, and partnership with the business sector, the UK may continue to lower the ecological footprint of transportation and come closer to its environmental goals.
Study on Carbon Emissions
One of the biggest causes of global warming is still the transportation sector’s carbon emissions. According to studies, a large amount of these emissions are caused by road transportation, which is followed by the aviation and maritime industries. Carbon reduction policies have been put in place in the UK to limit these emissions, and evidence indicates that during the past ten years, EV adoption, increased fuel efficiency, and decreased travel demand have all contributed to quantifiable drops in emissions.
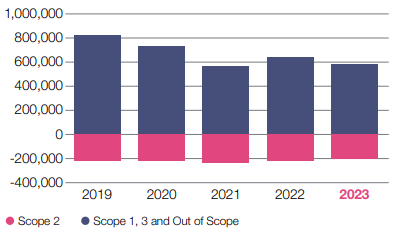
Figure 7: Market‑based carbon emissions (tCO2e)
All REGO-backed electricity use and any rail traction energy purchased through Network Rail from nuclear sources were therefore regarded as zero carbon under a market-based approach. The company’s market-based carbon emissions decreased by 8% in FY 2023. The total location-based carbon emissions for the year were 792,367 tCO2e, but this decreased to 587,926 tCO2e when using a market-based approach, reflecting 204,441 tonnes of carbon saved through the purchase of electricity from zero-carbon sources, including nuclear and renewable energy [3].
According to scientific journals, in order to fulfill net zero aims, carbon-neutral alternatives like green hydrogen and biofuels are crucial. Additionally, lifecycle evaluations of EVs reveal that, despite the carbon-intensive nature of battery production, operating emissions are far lower than those of vehicles with internal combustion engines. Long-term emission reduction targets require ongoing research into low-carbon fuels and technologies.
Environmental Impact of Vehicle Construction
Energy use, the extraction of raw materials, and trash production are the main causes of the significant environmental effect of vehicle construction. Significant amounts of lithium, nickel, and cobalt are needed to produce an EV, for example, and their extraction contributes to environmental deterioration. Large volumes of energy, frequently from fossil fuels, are also consumed by manufacturing facilities, leading to significant carbon emissions.
Building an effective transportation infrastructure is essential to raising living standards and can help address contemporary environmental issues, including climate change [10]. Extremely unfavorable weather conditions are one of the worst effects of climate change on transportation operations and infrastructure. Damages associated with extreme weather events rise in tandem with their frequency and intensity [11]. This means that minimizing disruptions and accidents brought on by unfavorable weather conditions requires careful and efficient governance of transportation operations and infrastructure [12]. Concurrently, climate change’s impact on the transportation industry primarily varies by region and mode of transportation [13]. Therefore, it is important to analyze how transportation systems should be planned, constructed, implemented, operated, and kept up.
As previously mentioned, emissions from transportation have a major impact on climate change. Among these are greenhouse gases (GHGs), which raise air temperatures worldwide by trapping heat in the atmosphere. The IEA [14] estimates that end users in the transportation sector accounted for about 37% of all CO2 emissions in 2021. The impact on the environment grows as more nations industrialize and the demand for transportation rises. The main cause of transportation emissions is the combustion of fossil fuels, such as gasoline and diesel, to power cars, which in turn emits CO2 into the atmosphere [15]. Air travel, road construction, and automobile manufacturing are additional sources of transportation emissions. Because they demand energy, these activities release more greenhouse gases into the environment. Investing in public transportation, encouraging people to walk or ride bicycles instead of driving, and moving to electric vehicles are some potential ways to lower transportation emissions and lessen the effects of climate change [15].
The use of recycled materials, energy optimization, and water waste reduction are just a few of the sustainable techniques that automakers are embracing more and more to mitigate these effects. In order to guarantee lower emissions and improved resource management, the government also imposes stringent environmental regulations on manufacturing facilities. The overall environmental impact is reduced as a result of these advancements in construction methods.
You can download the Project files here: Download files now. (You must be logged in).
Total Electricity Generation and Consumption in a Year
The move to renewable energy sources has resulted in notable changes in the UK’s electricity generation and consumption in recent years. The UK produced almost 325 TWh of electricity last year, with renewable energy sources like solar and wind accounting for almost 40% of this total, according to government figures. The transportation industry is becoming a growing consumer of power, contributing to the overall demand, particularly with the rise of EVs.
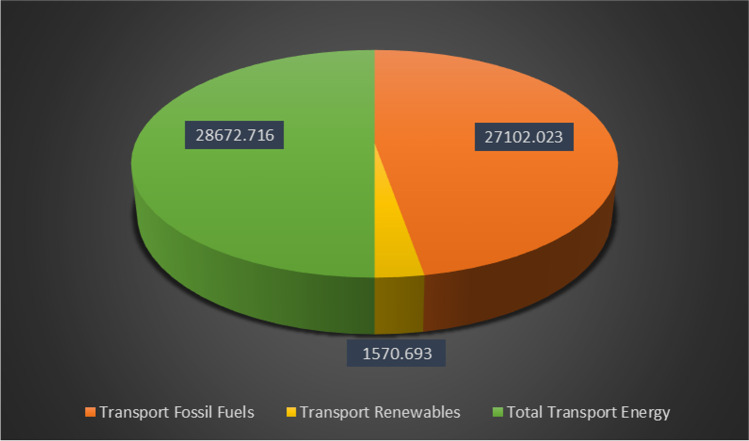
Figure 8: Transport fossil fuel and renewable energy usage (Trillion Btu) in 2019
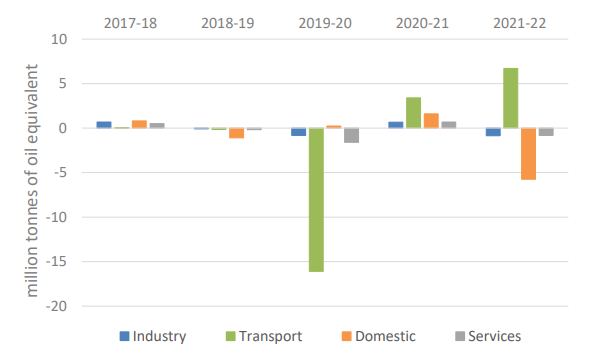
Figure 9: Annual change in consumption by sector for the last 5 years [16]
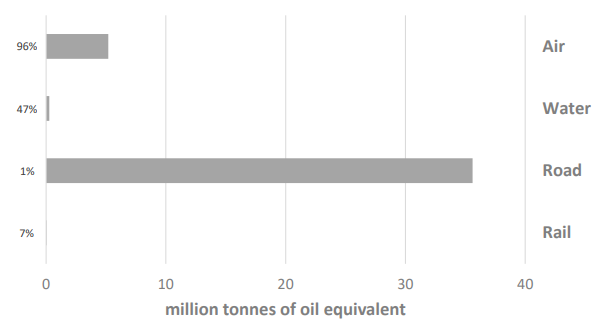
Figure 10: Change in petroleum consumption in transport by travel mode, 2021 to 2022 [16]
Petroleum use in road transportation rose by 0.5 mtoe between 2021 and 2022 (not including biofuel blended with gasoline and diesel), according to Figure 10, however this is still 9.0% less than in 2019. The amount of petroleum used in aviation almost doubled in 2022 compared to 2021, but it is still much lower (22 percent) than it was in 2019 [16].
Expanding renewable energy sources and enhancing energy storage technologies are both necessary to meet the rising electricity demands of EVs and control demand peaks. In order to balance supply and demand and guarantee dependable access to power for both residential and transportation purposes, infrastructure improvements and smart grid technologies are essential. In order to promote sustainable transportation without placing an undue strain on the electrical grid, this energy transition is crucial.
References
- Anna Coleman “Public transport in the UK: Considerations for continued rehabilitation and future planning for a sector impacted by COVID-19” available at: https://doi.org/10.1016/j.trip.2024.101044
- Department for Transport Annual Report and Accounts 2022–23 available at: https://assets.publishing.service.gov.uk/media/64b8048e2059dc000d5d260e/dft-annual-report-2022-23-print-version.pdf
- UK Transport and environment statistics: 2023 Published 19 October 2023 available at: https://www.gov.uk/government/statistics/transport-and-environment-statistics-2023/transport-and-environment-statistics-2023
- FirstGroup Annual Report 2023 Environmental Performance Report 2023 available at: https://www.firstgroupplc.com/~/media/Files/F/Firstgroup-Plc/environmental-performance-report-2023.pdf
- Halder, P., Babaie, M., Salek, F., Haque, N., Savage, R., Stevanovic, S., Bodisco, T.A. and Zare, A., 2023. Advancements in hydrogen production, storage, distribution and refuelling for a sustainable transport sector: Hydrogen fuel cell vehicles. International Journal of Hydrogen Energy.
- SMMT News, Brits enjoy best ever EV choice with more than a hundred models now available, 23 May 2024
- DfT, Vehicle Licensing Statistics: 2021 Quarter 2 (Apr – Jun) [PDF], 29 September 2021.
- DfT, Vehicle licensing statistics data tables, VEH0141b (GenModels)
- [9]. Gao, Y. and Zhu, J., 2022. Characteristics, Impacts and Trends of Urban Transportation. Encyclopedia, 2(2), pp.1168-1182.
- Intergovernmental Panel on Climate Change. Climate Change 2014: Mitigation of Climate Change: Chapter 8—Transport; Cambridge University Press: Geneva, Switzerland, 2014.
- Pilli-Sihvola, K.; Nurmi, V.; Perrels, A.; Harjanne, A.; Bösch, P.; Ciari, F. Innovations in weather services as a crucial building block for climate change adaptation in road transport. Eur. J. Transp. Infrastruct. Res. 2016, 16.
- Christodoulou, A.; Demirel, H. Impacts of Climate Change on Transport: A Focus on Airports, Seaports and Inland Waterways; Joint Research Service: Brussels, Belgium, 2018.
- Aminzadegan, S.; Shahriari, M.; Mehranfar, F.; Abramović, B. Factors affecting the emission of pollutants in different types of transportation: A literature review. Energy Rep. 2022, 8, 2508–2529.
- Teter, J. Tracking Transport 2022; IEA: Paris, France, 2022. [Google Scholar]
- Shaw, C.; Hales, S.; Howden-Chapman, P.; Edwards, R. Health co-benefits of climate change mitigation policies in the transport sector. Nat. Clim. Chang. 2014, 4, 427–433.
- Energy Consumption in the UK (ECUK) 1970 to 2022 available at: https://assets.publishing.service.gov.uk/media/651422e03d371800146d0c9e/Energy_Consumption_in_the_UK_2023.pdf
You can download the Project files here: Download files now. (You must be logged in).


Responses