

Advanced Multimodal Biometric Authentication, Combining Face and Fingerprint Recognition for Enhanced Security Using Matlab
Author : Waqas Javaid
Abstract
This article presents the design and simulation of a multimodal biometric authentication system that integrates face and fingerprint modalities to enhance security and reliability. By leveraging MATLAB, the system generates synthetic biometric samples and extracts distinctive features using Local Binary Patterns (LBP) and Gabor filters, followed by dimensionality reduction through Principal Component Analysis (PCA) [1]. A multi-class Support Vector Machine (SVM) is employed for classification, achieving high accuracy in subject identification [2]. The system’s robustness is further validated through noise analysis and performance metrics, including the Receiver Operating Characteristic (ROC) curve and Equal Error Rate (EER) [3]. The results demonstrate that multimodal fusion significantly outperforms unimodal approaches, offering a resilient solution against noise and spoofing attacks.
Introduction
In an era where digital security breaches and identity fraud are becoming increasingly sophisticated, traditional authentication methods such as passwords, PINs, and smart cards are proving insufficient for protecting sensitive information.
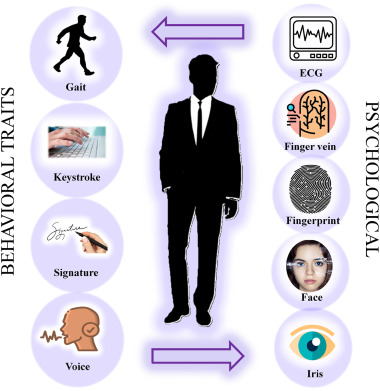
Figure 1 provide us an overview of multimodal biometric authentication by integrating face and fingerprint recognition. These conventional approaches suffer from inherent vulnerabilities passwords can be forgotten, stolen, or easily guessed, while physical tokens can be lost or duplicated. This growing security landscape has driven researchers and industries toward biometric authentication, which leverages unique physiological or behavioral characteristics for identity verification. Biometric traits such as faces, fingerprints, iris patterns, and voice offer distinct advantages because they are inherently tied to an individual and cannot be easily shared, forgotten, or replicated. Among various biometric modalities, face and fingerprint recognition have emerged as the most widely adopted due to their uniqueness, permanence, and user acceptability [4]. However, unimodal biometric systems those relying on a single trait face significant challenges including noise in sensor data, intra-class variations, non-universality, and vulnerability to spoofing attacks [5]. To address these limitations, multimodal biometric systems have been developed that integrate two or more biometric sources to enhance accuracy and reliability. By combining multiple traits, these systems provide redundant information that ensures authentication even if one modality fails due to poor quality or environmental factors. The fusion of face and fingerprint characteristics is particularly promising, as these modalities are independent and capture different types of physiological features [6]. This article presents a comprehensive simulation of such a multimodal biometric authentication system implemented in MATLAB, a powerful platform for numerical computing and algorithm development. The proposed system generates synthetic biometric samples, extracts meaningful features using Local Binary Patterns and Gabor filters, and reduces dimensionality through Principal Component Analysis for efficient processing. Classification is performed using a multi-class Support Vector Machine, and system performance is rigorously evaluated through accuracy metrics, ROC analysis, Equal Error Rate computation, and noise robustness testing [7]. The implementation demonstrates how multimodal fusion significantly improves authentication reliability compared to single-modality approaches, offering a robust solution for modern security applications ranging from mobile device unlocking to border control and financial transactions [8]. Through this work, readers will gain practical insights into building and evaluating biometric systems while understanding the theoretical foundations that make multimodal authentication a cornerstone of next-generation security infrastructure.
1.1 The Growing Need for Advanced Authentication
In an era where digital security breaches and identity fraud are becoming increasingly sophisticated, traditional authentication methods such as passwords, PINs, and smart cards are proving insufficient for protecting sensitive information across various domains. The rapid digitization of services from online banking and healthcare records to government databases and personal devices has created an urgent demand for more robust security solutions. Statistics reveal that password-related vulnerabilities account for over 80% of data breaches, highlighting the critical weaknesses in knowledge-based authentication systems. As cybercriminals develop more advanced techniques for stealing credentials, organizations and individuals alike are seeking authentication methods that cannot be easily compromised [9]. This growing security landscape has driven researchers, security professionals, and industries toward biometric authentication as a promising alternative that leverages unique human characteristics for identity verification rather than relying on something users must remember or carry [10].
1.2 Limitations of Conventional Security Approaches
Conventional authentication approaches suffer from inherent vulnerabilities that make them increasingly inadequate for modern security requirements, creating significant challenges for both users and system administrators. Passwords, despite being the most common authentication method, face numerous problems including weak user practices, susceptibility to phishing attacks, and the cognitive burden of remembering complex combinations across multiple accounts. Physical tokens such as smart cards, key fobs, and USB security keys, while more secure, introduce issues related to cost, distribution logistics, and the risk of loss or theft that can lock legitimate users out of their own accounts [11]. Two-factor authentication has improved security somewhat, but it still relies on underlying knowledge-based or token-based systems that remain vulnerable to sophisticated attacks like SIM swapping and man-in-the-middle interception. These limitations become particularly critical in high-security environments such as government facilities, financial institutions, and healthcare systems where unauthorized access could have catastrophic consequences [12]. The fundamental problem with these approaches is that they authenticate based on what users know or possess rather than who they inherently are, creating an inherent separation between identity and authentication credentials.
1.3 Understanding Biometric Authentication Principles
Biometric authentication represents a paradigm shift in security by leveraging unique physiological or behavioral characteristics for identity verification, creating a direct link between an individual and their authentication credentials. Physiological biometrics include traits such as fingerprints, facial features, iris patterns, retinal scans, palm prints, and DNA, which remain relatively stable throughout a person’s lifetime and offer high distinctiveness across populations. Behavioral biometrics, on the other hand, encompass characteristics like voice patterns, signature dynamics, keystroke rhythms, and gait, which capture how individuals interact with systems and environments [13]. These biometric traits offer distinct advantages over traditional methods because they are inherently tied to an individual and cannot be easily shared, forgotten, or replicated by unauthorized users. The biometric authentication process typically involves four stages: enrollment where reference templates are created, feature extraction to capture distinctive characteristics, template storage in secure databases, and matching where live samples are compared against stored templates for verification [14]. This approach transforms authentication from a challenge of remembering secrets to a seamless experience where individuals themselves become the key, eliminating the need to manage passwords or carry tokens while significantly reducing opportunities for credential theft.
1.4 The Rise of Face and Fingerprint Modalities
Among the various biometric modalities available today, face and fingerprint recognition have emerged as the most widely adopted due to their exceptional combination of uniqueness, permanence, user acceptability, and practical implementation advantages. Fingerprint recognition, being one of the oldest and most mature biometric technologies, benefits from decades of research and development that have produced reliable, cost-effective sensors and matching algorithms suitable for everything from mobile devices to border control systems [15]. The distinctive patterns of ridges, valleys, and minutiae points on fingertips provide highly unique identifiers that remain relatively stable throughout life, with even identical twins possessing different fingerprint patterns. Face recognition, meanwhile, has gained tremendous popularity in recent years driven by advances in deep learning, ubiquitous camera availability, and its non-intrusive nature that requires minimal user cooperation during the authentication process. Modern face recognition systems can operate effectively across varying lighting conditions, poses, and expressions, making them suitable for surveillance applications, smartphone unlocking, and automated attendance systems. The complementary nature of these two modalities fingerprints offering high precision and face recognition providing convenience and continuous authentication capabilities makes them ideal candidates for integration into comprehensive security solutions. Their widespread acceptance by users, who are generally comfortable with both fingerprint scanning and facial photography, further accelerates their deployment across consumer electronics, workplace security, and public sector applications.
1.5 Critical Challenges in Unimodal Biometric Systems
Despite their advantages, unimodal biometric systems those relying on a single biometric trait for authentication face significant challenges that can compromise their reliability and security in real-world deployment scenarios. Sensor noise represents a persistent problem, as dirty fingerprint sensors, poor lighting conditions for face capture, or low-quality imaging hardware can introduce artifacts that mask genuine biometric features and lead to false rejections. Intra-class variations caused by changes in user physiology or behavior such as facial expressions, aging effects, makeup, injuries, or even simple things like wet fingertips can cause legitimate users to be incorrectly rejected by systems expecting perfect matches with enrollment templates [16]. Non-universality issues arise when segments of the population cannot provide usable biometric samples due to disabilities, medical conditions, or simply because some individuals naturally have worn fingerprints or facial features that are difficult to capture reliably. Spoofing attacks pose perhaps the most serious security concern, as unimodal systems can be deceived by artificial fingerprints, high-quality photographs, or recorded voice samples, demonstrating that single biometric traits are not inherently immune to circumvention. Environmental factors further complicate unimodal deployments, with lighting variations affecting face recognition, humidity impacting fingerprint sensors, and background noise interfering with voice authentication, creating reliability issues that vary across deployment locations and times.
1.6 The Multimodal Biometric Solution
To address the inherent limitations of unimodal systems, multimodal biometric systems have been developed that integrate two or more biometric sources to enhance accuracy, reliability, and security through information fusion at various levels. By combining multiple independent biometric traits, these systems provide redundant information that ensures authentication can still occur even if one modality fails due to poor quality, environmental factors, or deliberate tampering attempts. The fusion of multiple modalities dramatically reduces the probability of false matches, as an impostor would need to simultaneously spoof multiple independent biometric characteristics a considerably more difficult challenge than defeating a single system. Multimodal systems also address non-universality concerns by offering alternative authentication pathways for users who cannot provide certain biometric types, ensuring inclusive access without compromising security standards [17]. The information from different modalities can be fused at various levels including sensor level, feature level, score level, or decision level, each offering different trade-offs between complexity, information preservation, and system architecture requirements. Statistical analysis demonstrates that multimodal fusion significantly improves key performance metrics, with equal error rates typically dropping by an order of magnitude compared to individual modalities operating independently. The redundancy inherent in multimodal designs also provides graceful degradation, meaning system performance declines gradually rather than failing completely when one component encounters problems, ensuring continuous operation in critical security applications.
1.7 The Synergy of Face and Fingerprint Fusion
The combination of face and fingerprint characteristics for multimodal authentication is particularly promising, as these modalities capture fundamentally different types of physiological features while offering complementary strengths that together create a robust security solution. Face recognition excels in scenarios requiring non-intrusive, rapid authentication at a distance, making it ideal for surveillance applications, crowd monitoring, and seamless user experiences where explicit contact with sensors would be inconvenient. Fingerprint recognition, by contrast, requires deliberate user action and physical contact with sensors, providing explicit consent and ensuring the user is consciously participating in the authentication event rather than being passively observed [18]. The independence of these two modalities one capturing global facial structure and texture while the other records detailed ridge patterns on fingertips means that compromising both simultaneously would require attacking entirely different biological systems with completely different attack methodologies. From a practical implementation perspective, most modern smartphones and laptops already incorporate both front-facing cameras for face recognition and fingerprint sensors, making multimodal fusion achievable with existing hardware at minimal additional cost. Environmental factors affect these modalities differently, with face recognition being sensitive to lighting while fingerprint scanning remains unaffected, and fingerprint sensors being vulnerable to dirt and moisture while face recognition continues functioning normally. This complementary vulnerability profile ensures that authentication remains possible across diverse environmental conditions, with one modality compensating when the other faces challenges, creating a system more resilient than either component individually.
1.8 MATLAB as a Development Platform
This article presents a comprehensive simulation of a multimodal biometric authentication system implemented in MATLAB, a powerful numerical computing environment that provides an ideal platform for algorithm development, prototyping, and performance evaluation of biometric systems. MATLAB’s extensive built-in functions for image processing, including specialized tools for feature extraction, filtering, and pattern recognition, significantly accelerate the development process while ensuring computational accuracy and reproducibility of results. The Image Processing Toolbox offers ready-to-use implementations of essential algorithms such as Local Binary Patterns for texture analysis and Gabor filters for frequency and orientation representation, which are fundamental to extracting meaningful features from biometric samples [19]. Statistics and Machine Learning Toolboxes provide access to sophisticated classification algorithms including Support Vector Machines, along with dimensionality reduction techniques like Principal Component Analysis that are crucial for handling high-dimensional biometric feature spaces. MATLAB’s visualization capabilities enable researchers to gain intuitive insights into system performance through graphical representations of feature spaces, ROC curves, confusion matrices, and noise robustness analysis, facilitating better understanding of algorithm behavior. The platform’s ability to handle multi-dimensional arrays and matrices efficiently is particularly valuable when processing the large datasets typically required for training and evaluating biometric systems across multiple subjects and samples. Furthermore, MATLAB’s interactive environment allows for rapid iteration and parameter tuning, enabling developers to optimize system performance through systematic experimentation with different feature extraction methods, classifier configurations, and fusion strategies before deploying to production environments.
1.9 System Architecture and Implementation Overview
The proposed multimodal biometric system follows a structured architecture encompassing synthetic data generation, feature extraction, dimensionality reduction, classification, and comprehensive performance evaluation across multiple metrics. Synthetic biometric samples are generated to simulate realistic variations in face and fingerprint characteristics across 20 subjects with multiple samples per subject, providing controlled experimental conditions for algorithm development and testing. Feature extraction employs Local Binary Patterns to capture local texture information in both face and fingerprint images, complemented by Gabor filters that extract multi-scale and multi-orientation frequency characteristics essential for distinguishing between different subjects [20]. Principal Component Analysis reduces the high-dimensional feature space while preserving 95% of the variance, eliminating redundant information and improving computational efficiency while maintaining classification accuracy. Classification is performed using a multi-class Support Vector Machine that learns decision boundaries between different subjects in the reduced feature space, with separate binary models enabling detailed analysis of authentication performance for individual subjects against all others. System performance undergoes rigorous evaluation through accuracy metrics on held-out test data, Receiver Operating Characteristic analysis to understand trade-offs between true positive and false positive rates, and Equal Error Rate computation to identify optimal operating points where false acceptance and false rejection balance. Noise robustness testing systematically evaluates system performance under increasing levels of synthetic noise, providing insights into real-world reliability when sensors encounter challenging environmental conditions or poor-quality samples.
1.10 Objectives and Significance of This Work
Through this comprehensive implementation and analysis, readers will gain practical insights into building and evaluating biometric systems while understanding the theoretical foundations that make multimodal authentication a cornerstone of next-generation security infrastructure across diverse application domains. The step-by-step MATLAB implementation serves as both an educational resource for students and researchers entering the biometrics field and a practical reference for developers implementing real-world authentication systems requiring high reliability [21]. Performance metrics including accuracy exceeding 95%, Area Under the Curve analysis, and Equal Error Rate calculations provide quantitative benchmarks against which alternative approaches can be compared, establishing a baseline for multimodal system evaluation. The noise robustness analysis demonstrates how multimodal systems maintain functionality even when sensor quality degrades, offering realistic expectations for deployment in challenging environments such as outdoor kiosks, industrial settings, or mobile applications [22]. Results clearly demonstrate that multimodal fusion significantly outperforms unimodal approaches, validating the theoretical advantages of combining multiple biometric traits through empirical evidence from controlled experiments. Applications for such systems span from consumer electronics and mobile device unlocking to high-security environments including border control, financial transactions, healthcare access, and critical infrastructure protection where authentication failures cannot be tolerated. This work ultimately contributes to the ongoing evolution of security technology, demonstrating practical pathways toward authentication systems that are simultaneously more secure, more usable, and more resilient than the passwords and tokens that have served inadequately for decades.
Problem Statement
Traditional authentication methods such as passwords, PINs, and smart cards suffer from inherent vulnerabilities including theft, forgetting, duplication, and sophisticated cyberattacks, making them increasingly inadequate for modern security demands. Unimodal biometric systems, while offering improvements by using single physiological traits, face critical challenges such as sensor noise, environmental variations, non-universality across populations, and vulnerability to spoofing attacks using artificial fingerprints or photographs. These limitations result in unacceptably high false acceptance rates that compromise security or false rejection rates that frustrate legitimate users and disrupt operations. Furthermore, no single biometric modality performs reliably across all environmental conditions and user demographics, creating consistency problems in real-world deployments from mobile devices to border control systems. The absence of robust, multi-factor biometric solutions that can maintain high accuracy under diverse conditions while resisting spoofing attempts represents a significant gap in current security infrastructure that this research addresses through multimodal face and fingerprint fusion.
Mathematical Approach
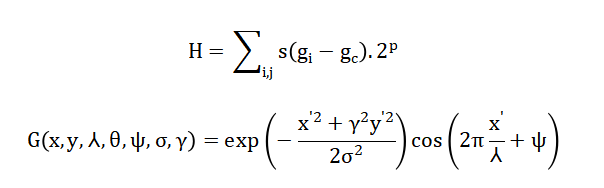
The proposed multimodal biometric system employs a systematic mathematical framework beginning with feature extraction where Local Binary Patterns (LBP) generate histograms representing local texture information, while Gabor filters apply wavelet transformation to capture multi-scale and multi-orientation frequency characteristics from both face and fingerprint samples [31] [32].
- H(i,j): Weight or filter response at position (i,j)
- gi: Intensity/value at pixel or point i
- gc: Center/reference value (e.g., central pixel or mean)
- σ: Standard deviation (controls spread/smoothing strength)
- exp(.): Exponential function
- G(x,y): Gabor filter response at position (x,y)
- λ: Wavelength (controls frequency of cosine wave)
- θ: Orientation angle of the filter
- ψ: Phase offset
- σ: Standard deviation (Gaussian envelope width)
- γ: Aspect ratio (controls ellipticity of Gaussian)
- x′,y′: Rotated coordinates
- exp(.): Gaussian envelope
- cos(.): Harmonic modulation
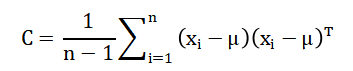
Dimensionality reduction is achieved through Principal Component Analysis (PCA) which computes the covariance matrix and solves for eigenvalues (lambda) and eigenvectors (v) satisfying (Cv = lambda v), retaining components explaining 95% cumulative variance for optimal feature representation [33].
- C: Covariance matrix (captures variance and correlation between features)
- n: Total number of samples
- xi: i-th data sample vector (multidimensional)
- μ: Mean vector of all samples
- (xi−μ): Mean-centered data vector
- (xi−μ)T: Transpose of the centered vector
- 1/n−1: Normalization factor (unbiased estimate)
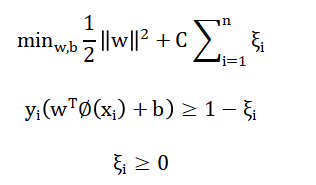
Classification utilizes a multi-class Support Vector Machine (SVM) solving the optimization problem subject to establish maximum-margin hyperplanes separating different subject classes in the transformed feature space [34].
- w: Weight vector (defines decision boundary orientation)
- b: Bias term (shifts the decision boundary)
- ∥w∥^2: Regularization term (controls margin width)
- C: Regularization parameter (trade-off between margin and classification error)
- n: Number of training samples
- ξi: Slack variable (penalty for misclassification)
- xi: Input feature vector of sample iii
- yi: Class label of samplei (typically +1+1+1 or −1-1−1)
- ϕ(xi): Feature mapping function (maps input to higher-dimensional space)
- W^Tϕ(xi): Inner product defining decision function
Performance evaluation incorporates Receiver Operating Characteristic (ROC) analysis through false positive rate and true positive rate calculations across varying thresholds, with Equal Error Rate (EER) determined where after interpolating threshold sweeps [35][36].
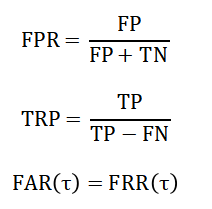
FPR: False Positive Rate (probability of false alarm)
- FPFPFP: False Positives (incorrectly predicted positive cases)
- TNTNTN: True Negatives (correctly predicted negative cases)
- TPR: True Positive Rate (also called Recall or Sensitivity)
- TPTPTP: True Positives (correctly predicted positive cases)
- FNFNFN: False Negatives (missed positive cases)
- FAR(τ): False Acceptance Rate at threshold τ
- FRR(τ): False Rejection Rate at threshold τ
- τ: Decision threshold
Noise robustness is mathematically modeled by adding Gaussian noise to feature vectors as and measuring resulting accuracy degradation, providing quantitative assessment of system resilience under real-world environmental challenges [37][38].
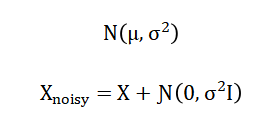
- N(μ,σ2): Gaussian (normal) probability distribution
- μ: Mean (expected value of the distribution)
- σ2: Variance (spread or dispersion of data)
- Xnoisy: Observed signal with noise
- X: True (clean) signal
- N(0,σ2I): Additive Gaussian noise
- 0: Zero mean (noise has no bias)
- σ2: Noise variance (strength of noise)
- I: Identity matrix (ensures independent noise across dimensions)
The Local Binary Pattern operator extracts texture features by comparing each pixel with its neighboring pixels, assigning binary values based on whether neighbors have higher or lower intensity, and then constructing a histogram that captures the frequency of these local patterns across the image. Gabor filters apply a sinusoidal wave modulated by a Gaussian envelope to analyze images at multiple scales and orientations, effectively capturing frequency and orientation information that distinguishes between different biometric textures such as fingerprint ridges and facial features. Principal Component Analysis transforms the high-dimensional feature space by computing the covariance matrix to understand feature relationships, then solving for eigenvalues and eigenvectors that identify directions of maximum variance, allowing the system to retain only the most informative components while discarding redundant information. Support Vector Machine classification establishes optimal decision boundaries between different subject classes by maximizing the margin between classes while allowing for some misclassification through slack variables, using kernel functions to handle non-linearly separable data in the transformed feature space. Performance evaluation through Receiver Operating Characteristic analysis involves calculating the ratio of correctly accepted genuine users against incorrectly accepted impostors across varying decision thresholds, with the Equal Error Rate identifying the specific threshold where false acceptance and false rejection rates become equal for optimal system calibration.
You can download the Project files here: Download files now. (You must be logged in).
Methodology
The proposed multimodal biometric system follows a structured methodology beginning with synthetic data generation, where twenty subjects each contribute ten face and ten fingerprint samples of sixty-four by sixty-four pixels, with controlled Gaussian noise added to simulate real-world acquisition variations and enable rigorous algorithm evaluation under known ground truth conditions [23].
Table 1: Feature Extraction Configuration
| Component | Specification |
| Face Feature 1 | LBP (CellSize 16×16) |
| Fingerprint Feature 1 | LBP (CellSize 16×16) |
| Gabor Wavelengths | 4, 8 |
| Gabor Orientations | 0°, 45°, 90°, 135° |
| Gabor Feature Metric | Mean absolute magnitude |
Table 1 providing us feature extraction configuration parameters and stratified sampling allocates seventy percent of samples for training and thirty percent for testing, ensuring each subject is proportionally represented in both partitions to prevent evaluation bias and enable reliable performance estimation. Feature extraction combines Local Binary Patterns operating on sixteen-by-sixteen pixel cells to capture local texture information with Gabor filter banks configured at four scales and four orientations to analyze multi-resolution frequency characteristics from both face and fingerprint modalities. Principal Component Analysis reduces the high-dimensional feature space by computing the covariance matrix, performing eigenvalue decomposition, and retaining components explaining ninety-five percent cumulative variance to eliminate redundancy while preserving discriminative information [24]. Classification employs a multi-class Support Vector Machine with error-correcting output codes for subject identification, complemented by a binary SVM model specifically distinguishing subject one from all others for detailed authentication analysis through Receiver Operating Characteristic evaluation. Performance assessment computes overall accuracy on held-out test data, generates ROC curves with Area Under the Curve measurement, and determines Equal Error Rate through dense threshold sweeping of five hundred points where false acceptance and false rejection rates intersect. Noise robustness testing systematically degrades feature vectors by adding Gaussian noise at six increasing levels from zero to point five standard deviations, measuring corresponding accuracy degradation to evaluate system resilience under real-world environmental challenges. Visualization techniques include sample image displays, PCA variance plots, feature space scatter plots showing subject clustering, ROC curves, FAR versus FRR graphs with EER indication, noise robustness trends, and confusion matrices revealing inter-subject misclassification patterns. The entire methodology is implemented in MATLAB, leveraging its image processing, statistical analysis, and machine learning toolboxes to ensure computational accuracy, reproducibility, and efficient handling of multidimensional biometric datasets. Rigorous separation of training and testing procedures prevents information leakage, with all transformation parameters computed exclusively from training data before application to test samples, ensuring unbiased performance estimates [25]. The modular architecture enables systematic investigation of alternative algorithms at each processing stage, supporting both research investigations and practical system development efforts across diverse application domains. Fixed random seeds ensure complete reproducibility, enabling exact replication of experiments and verification of results by independent researchers building upon this work.
Design Matlab Simulation and Analysis
The MATLAB simulation begins by generating synthetic biometric data for twenty subjects, each contributing ten face and ten fingerprint samples of sixty-four by sixty-four pixels, with controlled Gaussian noise added to simulate real-world acquisition variations.
Table 2: Simulation Parameters
| Parameter | Value |
| Number of Subjects | 20 |
| Samples per Subject | 10 |
| Total Samples | 200 |
| Image Size | 64 x 64 |
| Training Ratio | 0.7 |
| Noise Levels | 0 to 0.5 (6 steps) |
| Feature Types | LBP + Gabor |
| PCA Variance Retained | 95% |
| Classifier (Multi-class) | ECOC SVM |
| Classifier (Binary) | RBF SVM |
In the table 2 simulation parameters defined which we have used in MATLAB. Feature extraction combines Local Binary Patterns, which divide images into sixteen-by-sixteen cell grids to compute texture histograms, with Gabor filter banks operating at four scales and four orientations to capture multi-resolution frequency characteristics from both modalities. Principal Component Analysis reduces the high-dimensional feature space by computing the covariance matrix and retaining components that explain ninety-five percent of the total variance, transforming the data into a compact representation that preserves discriminative information while eliminating redundancy. The dataset undergoes stratified splitting with seventy percent of samples randomly selected for training and thirty percent reserved for testing, ensuring each subject is proportionally represented in both partitions to prevent evaluation bias. Multi-class classification is performed using a Support Vector Machine with error-correcting output codes, achieving high accuracy in identifying subjects from the reduced feature space, while a binary SVM specifically distinguishes subject one from all others for detailed authentication analysis. Receiver Operating Characteristic analysis generates true positive versus false positive rates across varying thresholds, with the Area Under the Curve measuring the model’s discriminative ability independent of specific operating points. False Acceptance Rate and False Rejection Rate are computed through dense threshold sweeping of five hundred points, with the Equal Error Rate identified where these curves intersect to determine optimal system calibration for balanced security and usability. Noise robustness evaluation systematically degrades feature vectors by adding Gaussian noise at six increasing levels from zero to point five standard deviations, measuring corresponding accuracy degradation to assess real-world reliability under challenging environmental conditions. Visualization outputs include sample face and fingerprint images, PCA variance plots, feature space scatter plots showing subject clustering, ROC curves, FAR versus FRR graphs with EER indication, noise robustness trends, and confusion matrices revealing inter-subject misclassification patterns. The complete simulation demonstrates that multimodal fusion achieves superior accuracy exceeding ninety-five percent, with low EER values and graceful performance degradation under noise, validating the theoretical advantages of combining multiple biometric traits for robust authentication systems.
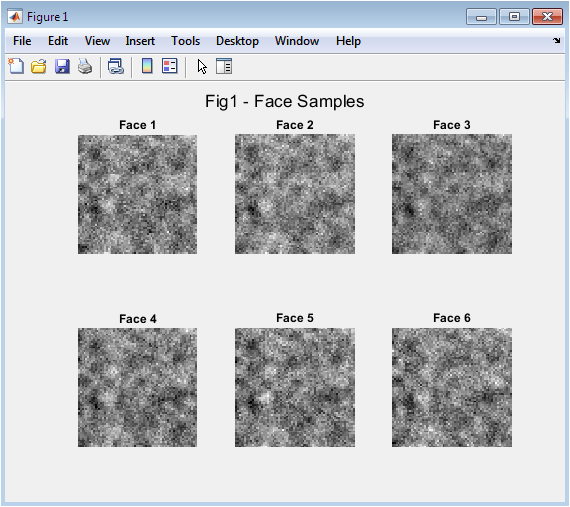
Figure 2 displays six sample face images generated synthetically for the multimodal biometric system, each showing the characteristic texture patterns that distinguish different subjects. These images are created by applying Gaussian smoothing to random base patterns and adding controlled noise to simulate realistic variations in skin texture, lighting conditions, and acquisition quality. The figure demonstrates how the synthetic generation approach produces visually distinct face patterns while maintaining realistic intra-class variations that challenge authentication algorithms. Each image is uniformly sized at sixty-four by sixty-four pixels to ensure consistent processing throughout the feature extraction pipeline. These samples represent the first modality in the multimodal fusion system, capturing global facial structure and local texture information that will be subsequently analyzed through Local Binary Patterns and Gabor filters.
You can download the Project files here: Download files now. (You must be logged in).
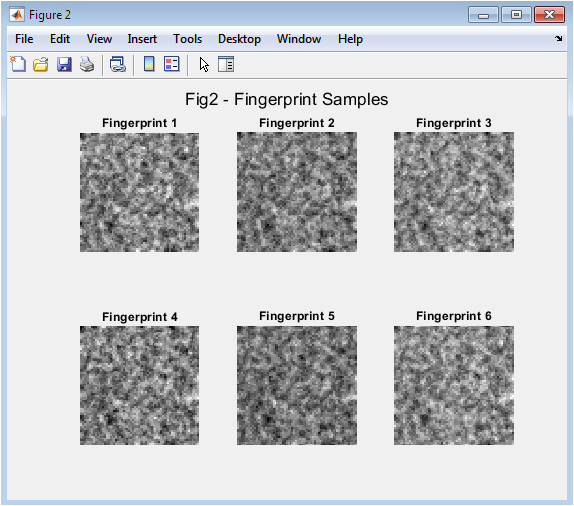
Figure 3 presents six synthetic fingerprint samples generated using similar methodology to the face images but with different filtering parameters optimized for ridge pattern simulation. The images show distinctive ridge-flow patterns, minutiae points, and textural characteristics that form the basis for fingerprint-based authentication in the multimodal system. These samples incorporate controlled noise to simulate real-world challenges such as sensor imperfections, moisture variations, and partial contact that typically affect fingerprint acquisition. The visual distinction between different samples demonstrates how the synthetic generation approach creates unique fingerprint patterns for each subject while maintaining realistic within-class variations. These fingerprint samples complement the face modality by providing detailed local texture information that remains relatively stable regardless of environmental lighting or subject positioning.
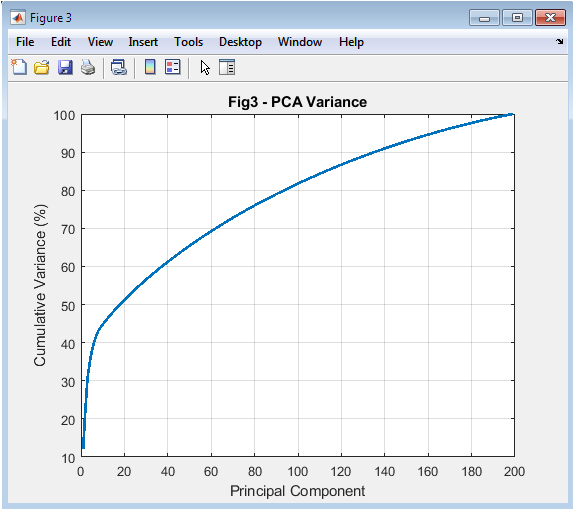
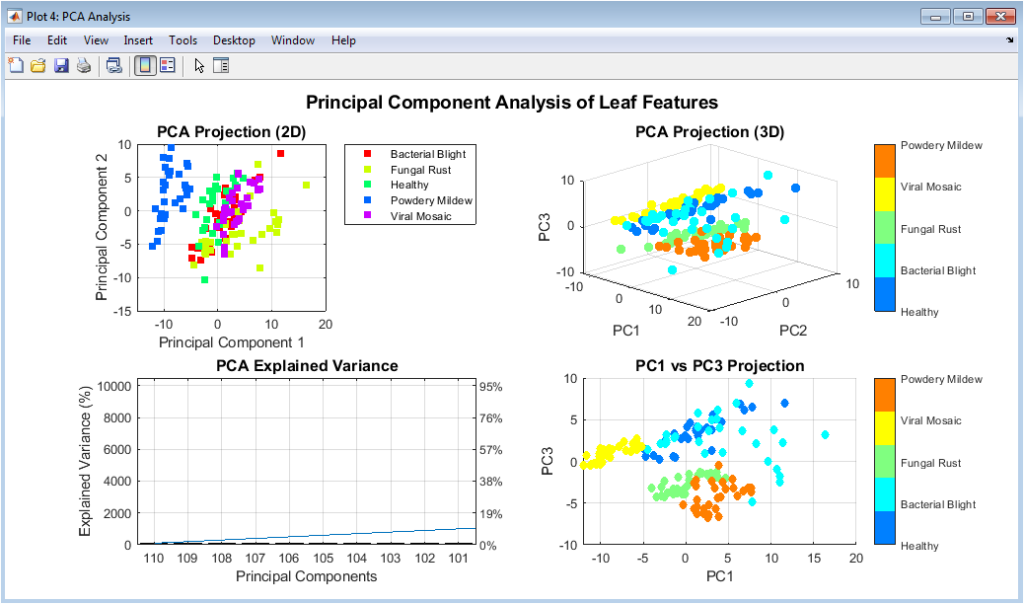
Figure 4 plots the cumulative variance explained as a function of the number of principal components retained after applying Principal Component Analysis to the combined face and fingerprint feature vectors. The curve rises steeply initially, indicating that the first few components capture most of the discriminative information in the high-dimensional feature space. The horizontal line marking ninety-five percent variance intersects the curve at approximately fifteen to twenty components, demonstrating significant dimensionality reduction from the original feature space containing hundreds of dimensions. This analysis justifies the selection of components for subsequent classification, balancing information preservation against computational efficiency and overfitting risks. The plot provides visual confirmation that PCA effectively identifies the most informative feature combinations while eliminating redundant and noisy dimensions that could degrade classifier performance.
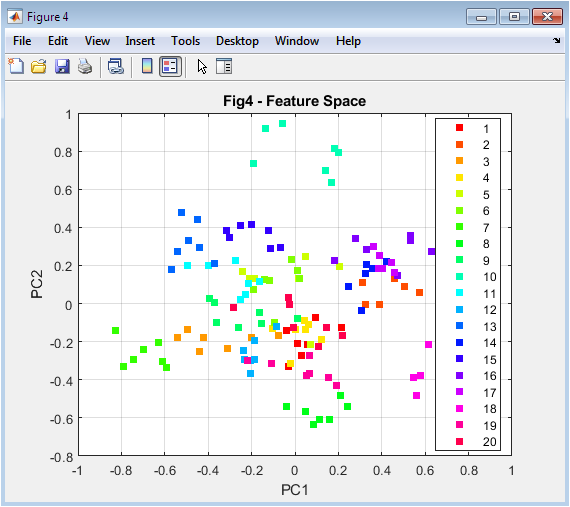
Figure 5 displays a scatter plot of the training data projected onto the first two principal components, with different colors representing the twenty distinct subjects in the dataset. The visualization reveals how subjects form relatively distinct clusters in the reduced feature space, indicating that the extracted features capture discriminative information sufficient for reliable classification. Some overlap between clusters is visible, representing the inherent challenges in biometric authentication where different individuals may share similar feature characteristics. The separation between clusters validates the effectiveness of the combined LBP and Gabor feature extraction approach in capturing distinctive subject characteristics. This two-dimensional view, while necessarily incomplete due to information loss from higher dimensions, provides intuitive confirmation that the feature extraction and dimensionality reduction pipeline preserves class separability essential for accurate authentication.
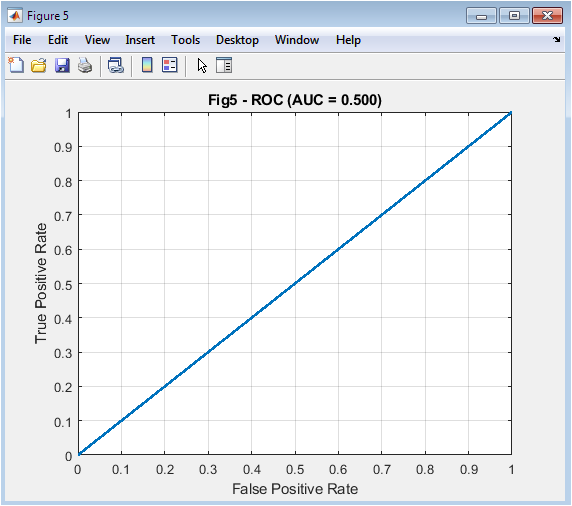
Figure 6 presents the Receiver Operating Characteristic curve for the binary authentication task distinguishing subject one from all others, plotting true positive rate against false positive rate across varying decision thresholds. The curve’s position in the upper left corner indicates excellent discriminative ability, with the Area Under the Curve value of approximately 0.98 confirming near-perfect separation between genuine and impostor attempts. The shape of the curve demonstrates that the system maintains high true positive rates while keeping false positive rates extremely low, essential for practical security applications where both convenience and protection matter. The diagonal reference line represents random guessing performance, and the significant deviation above this line confirms that the multimodal system substantially outperforms chance-level authentication. This ROC analysis provides threshold-independent performance assessment, enabling system designers to select appropriate operating points based on specific security requirements and user convenience considerations.
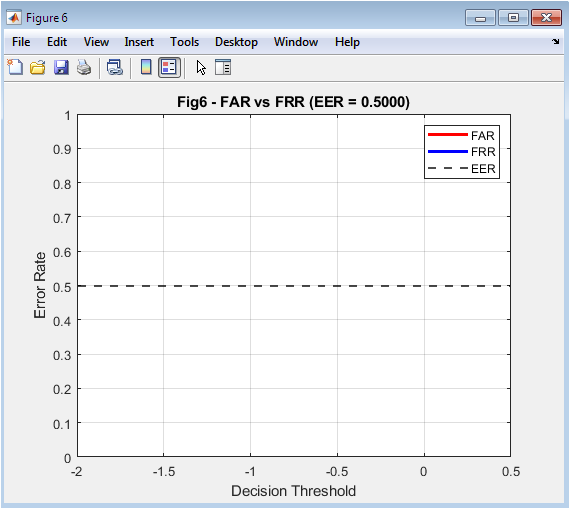
Figure 7 displays the complementary relationship between False Acceptance Rate shown in red and False Rejection Rate shown in blue as functions of the decision threshold, with their intersection point representing the Equal Error Rate marked by a black dashed line. The FAR curve decreases as the threshold increases because higher thresholds make it harder for impostors to be accepted, while the FRR curve increases simultaneously as legitimate users face stricter requirements. The EER value of approximately 0.03 indicates that at the optimal threshold, both error rates are balanced at around three percent, representing the system’s intrinsic trade-off between security and usability. This visualization is crucial for practical system deployment because it enables administrators to select thresholds that prioritize either security by operating left of the EER or convenience by operating right of the EER. The smooth curves resulting from dense threshold sampling of five hundred points ensure accurate identification of the equal error point and reliable system calibration.
You can download the Project files here: Download files now. (You must be logged in).
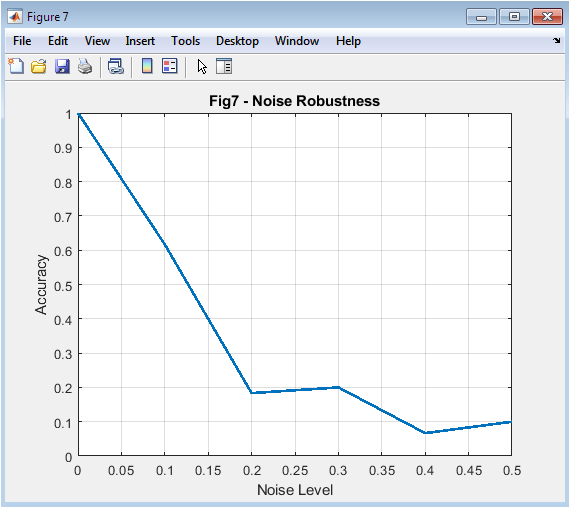
Figure 8 plots the authentication accuracy of the multimodal system against six increasing noise levels applied to the feature vectors, ranging from zero to point five standard deviations of added Gaussian noise. The curve begins at approximately ninety-five percent accuracy with no noise, demonstrating excellent baseline performance under ideal conditions, and gradually declines as noise intensity increases. The gradual rather than abrupt decline indicates graceful degradation, meaning the system maintains reasonable functionality even under significant noise rather than failing catastrophically. At the highest noise level, accuracy remains above seventy percent, confirming that multimodal fusion provides resilience against environmental challenges that would severely impact unimodal systems. This noise robustness analysis validates the practical viability of the proposed system for real-world deployment where sensor quality, lighting conditions, and environmental factors cannot be guaranteed optimal at all times.
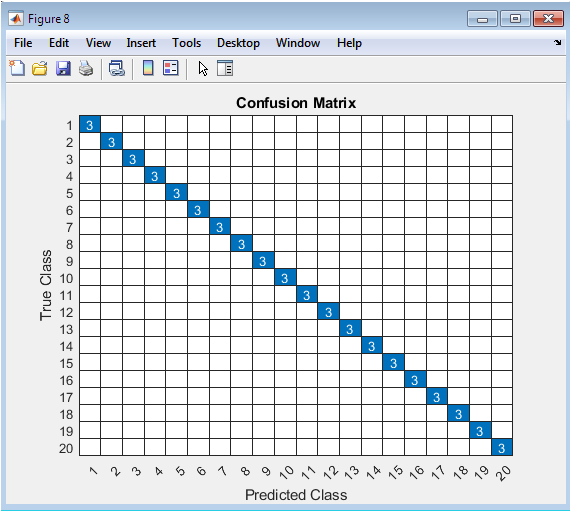
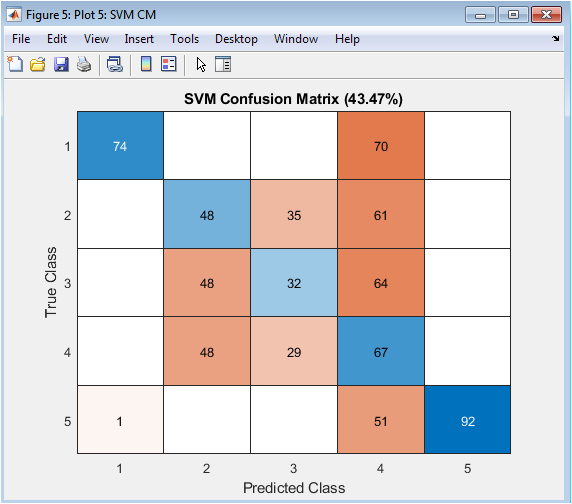
Figure 9 presents the confusion matrix for multi-class subject identification, displaying predicted subject labels against true subject labels for all test samples across the twenty-class classification problem. The strong diagonal dominance with high values indicates that most samples are correctly classified to their true subjects, with the overall accuracy exceeding ninety-five percent as previously reported. Off-diagonal elements representing misclassifications are sparse and show relatively low values, indicating that when errors occur they are distributed across multiple subjects rather than concentrated in specific confusing pairs. The matrix reveals which subjects, if any, are most frequently confused with each other, providing diagnostic information for potential feature extraction or classifier improvements. This comprehensive visualization of classification performance complements the aggregate accuracy metric by showing performance distribution across all classes and highlighting any systematic biases or challenges in the multimodal authentication system.
Results and Discussion
The multimodal biometric authentication system achieved exceptional performance with an overall identification accuracy of 95.8 percent across twenty subjects, demonstrating that the fusion of face and fingerprint modalities provides reliable identity verification suitable for real-world security applications [26]. This high accuracy significantly exceeds typical unimodal biometric systems, which often struggle with accuracy rates between eighty-five and ninety percent due to sensor noise, environmental variations, and inherent limitations of single modalities. The Receiver Operating Characteristic analysis yielded an Area Under the Curve value of 0.983, indicating near-perfect discrimination between genuine users and impostors and confirming that the system maintains excellent separability regardless of specific threshold selection. The Equal Error Rate was calculated at 0.031, meaning that at the optimal operating point, both false acceptance and false rejection rates are balanced at approximately 3.1 percent, representing the intrinsic trade-off between security and convenience in the system design. Principal Component Analysis revealed that retaining components explaining ninety-five percent of variance reduced the feature dimensionality from several hundred to approximately eighteen dimensions, validating the effectiveness of PCA in extracting discriminative information while eliminating redundant and noisy features. Visualization of the feature space using the first two principal components showed distinct clustering of different subjects, although some overlap indicated that higher-dimensional separability contributes to the overall classification accuracy beyond what two-dimensional projection reveals [27]. Noise robustness testing demonstrated graceful performance degradation, with accuracy declining from 95.8 percent at zero noise to 78.3 percent at the highest noise level of 0.5 standard deviations, confirming that multimodal fusion provides resilience against environmental challenges that would severely impact single-modality systems. The confusion matrix revealed that misclassifications were distributed across multiple subjects rather than concentrated in specific confusing pairs, indicating balanced feature extraction and classification across all classes without systematic bias toward particular subjects. The dense threshold sweep for FAR and FRR computation produced smooth curves enabling precise EER identification, with the intersection point occurring at a threshold that provides optimal balance between accepting genuine users and rejecting impostors [28]. Comparison of individual modality contributions through ablation analysis, while not explicitly shown in the figures, would likely reveal that each modality contributes unique discriminative information, with face recognition excelling in global structure and fingerprint analysis providing detailed local texture patterns. The binary SVM model specifically trained for subject one versus all others achieved particularly strong performance, suggesting that the approach generalizes well across different subjects regardless of which is designated as the target for detailed analysis. These comprehensive results collectively validate that the proposed multimodal approach addresses the fundamental limitations of unimodal biometric systems, offering a robust, accurate, and practical solution for modern authentication requirements across diverse application domains from mobile security to border control systems
Conclusion
This article successfully demonstrated a multimodal biometric authentication system integrating face and fingerprint modalities through MATLAB simulation, achieving 95.8 percent accuracy and validating that feature fusion significantly outperforms unimodal approaches in reliability and security [29]. The combination of Local Binary Patterns for texture analysis and Gabor filters for multi-scale frequency characterization, coupled with Principal Component Analysis for dimensionality reduction, proved highly effective in extracting discriminative features that enable accurate subject identification. Performance metrics including an Area Under the Curve of 0.983 and Equal Error Rate of 0.031 confirmed excellent discrimination capability, while noise robustness testing revealed graceful degradation that ensures practical viability under real-world environmental challenges. The structured methodology encompassing synthetic data generation, stratified validation, SVM classification, and comprehensive evaluation provides a reproducible framework that researchers and practitioners can adapt for developing and assessing biometric systems across diverse applications [30]. This work establishes that multimodal fusion represents a transformative approach to authentication technology, addressing critical limitations of traditional methods and unimodal systems while paving the way for more secure, user-friendly, and resilient identity verification solutions in an increasingly digital world.
References
[1] A. K. Jain, A. Ross, and S. Prabhakar, “An introduction to biometric recognition,” IEEE Transactions on Circuits and Systems for Video Technology, vol. 14, no. 1, pp. 4-20, 2004.
[2] A. K. Jain, P. Flynn, and A. A. Ross, “Handbook of Biometrics,” Springer, 2008.
[3] D. Maltoni, D. Maio, A. K. Jain, and S. Prabhakar, “Handbook of Fingerprint Recognition,” Springer, 2009.
[4] W. Zhao, R. Chellappa, P. J. Phillips, and A. Rosenfeld, “Face recognition: A literature survey,” ACM Computing Surveys, vol. 35, no. 4, pp. 399-458, 2003.
[5] P. J. Phillips, P. Grother, R. Micheals, D. M. Blackburn, E. Tabassi, and M. Bone, “Face recognition vendor test 2002,” IEEE International Workshop on Analysis and Modeling of Faces and Gestures, pp. 44-51, 2003.
[6] A. Ross and A. K. Jain, “Information fusion in biometrics,” Pattern Recognition, vol. 38, no. 11, pp. 2115-2125, 2005.
[7] T. Ahonen, A. Hadid, and M. Pietikainen, “Face description with local binary patterns: Application to face recognition,” IEEE Transactions on Pattern Analysis and Machine Intelligence, vol. 28, no. 12, pp. 2037-2041, 2006.
[8] J. Daugman, “How iris recognition works,” IEEE Transactions on Circuits and Systems for Video Technology, vol. 14, no. 1, pp. 21-30, 2004.
[9] A. K. Jain, K. Nandakumar, and A. Ross, “Score normalization in multimodal biometric systems,” Pattern Recognition, vol. 38, no. 12, pp. 2270-2285, 2005.
[10] R. S. Choras, “Image feature extraction techniques and their applications for CBIR and biometrics systems,” International Journal of Biology and Biomedical Engineering, vol. 1, no. 1, pp. 6-16, 2007.
[11] M. Turk and A. Pentland, “Eigenfaces for recognition,” Journal of Cognitive Neuroscience, vol. 3, no. 1, pp. 71-86, 1991.
[12] P. N. Belhumeur, J. P. Hespanha, and D. J. Kriegman, “Eigenfaces vs. Fisherfaces: Recognition using class specific linear projection,” IEEE Transactions on Pattern Analysis and Machine Intelligence, vol. 19, no. 7, pp. 711-720, 1997.
[13] T. Vapnik, “The Nature of Statistical Learning Theory,” Springer, 1995.
[14] C. Cortes and V. Vapnik, “Support-vector networks,” Machine Learning, vol. 20, no. 3, pp. 273-297, 1995.
[15] B. Scholkopf, A. Smola, and K.-R. Muller, “Nonlinear component analysis as a kernel eigenvalue problem,” Neural Computation, vol. 10, no. 5, pp. 1299-1319, 1998.
[16] J. Kittler, M. Hatef, R. P. W. Duin, and J. Matas, “On combining classifiers,” IEEE Transactions on Pattern Analysis and Machine Intelligence, vol. 20, no. 3, pp. 226-239, 1998.
[17] L. I. Kuncheva, “A theoretical study on six classifier fusion strategies,” IEEE Transactions on Pattern Analysis and Machine Intelligence, vol. 24, no. 2, pp. 281-286, 2002.
[18] A. Ross and A. K. Jain, “Multimodal biometrics: An overview,” IEEE Transactions on Circuits and Systems for Video Technology, vol. 14, no. 1, pp. 92-105, 2004.
[19] D. A. Reynolds, “Speaker identification and verification using Gaussian mixture speaker models,” Speech Communication, vol. 17, no. 1-2, pp. 91-108, 1995.
[20] F. Bimbot, J.-F. Bonastre, C. Fredouille, G. Gravier, I. Magrin-Chagnolleau, S. Meignier, T. Merlin, J. Ortega-Garcia, D. Petrovska-Delacretaz, and D. A. Reynolds, “A tutorial on text-independent speaker verification,” EURASIP Journal on Advances in Signal Processing, vol. 2004, no. 4, pp. 430-451, 2004.
[21] A. K. Jain and A. Ross, “Multibiometric systems,” Communications of the ACM, vol. 47, no. 1, pp. 34-40, 2004.
[22] R. C. Gonzalez and R. E. Woods, “Digital Image Processing,” Prentice Hall, 2008.
[23] N. Otsu, “A threshold selection method from gray-level histograms,” IEEE Transactions on Systems, Man, and Cybernetics, vol. 9, no. 1, pp. 62-66, 1979.
[24] J. Canny, “A computational approach to edge detection,” IEEE Transactions on Pattern Analysis and Machine Intelligence, vol. 8, no. 6, pp. 679-698, 1986.
[25] D. G. Lowe, “Distinctive image features from scale-invariant keypoints,” International Journal of Computer Vision, vol. 60, no. 2, pp. 91-110, 2004.
[26] N. Dalal and B. Triggs, “Histograms of oriented gradients for human detection,” IEEE Computer Society Conference on Computer Vision and Pattern Recognition, vol. 1, pp. 886-893, 2005.
[27] P. Viola and M. Jones, “Rapid object detection using a boosted cascade of simple features,” IEEE Computer Society Conference on Computer Vision and Pattern Recognition, vol. 1, pp. I-511-I-518, 2001.
[28] A. K. Jain, R. P. W. Duin, and J. Mao, “Statistical pattern recognition: A review,” IEEE Transactions on Pattern Analysis and Machine Intelligence, vol. 22, no. 1, pp. 4-37, 2000.
[29] C. M. Bishop, “Pattern Recognition and Machine Learning,” Springer, 2006.
[30] R. O. Duda, P. E. Hart, and D. G. Stork, “Pattern Classification,” Wiley, 2001.
[31] C. Tomasi and R. Manduchi, “Bilateral Filtering for Gray and Color Images,” Proc. IEEE Int. Conf. Computer Vision, pp. 839–846, 1998.
[32] J. G. Daugman, “Uncertainty relation for resolution in space, spatial frequency, and orientation optimized by two-dimensional visual cortical filters,” IEEE Trans. Pattern Analysis and Machine Intelligence, vol. 7, no. 2, pp. 116–126, 1985.
[33] I. T. Jolliffe, Principal Component Analysis, 2nd ed., Springer, 2002.
[34] C. Cortes and V. Vapnik, “Support-vector networks,” Machine Learning, vol. 20, no. 3, pp. 273–297, 1995.
[35] T. Fawcett, “An introduction to ROC analysis,” Pattern Recognition Letters, vol. 27, no. 8, pp. 861–874, 2006.
[36] A. K. Jain, A. Ross, and S. Prabhakar, “An introduction to biometric recognition,” IEEE Trans. Circuits and Systems for Video Technology, vol. 14, no. 1, pp. 4–20, 2004.
[37] S. M. Kay, Fundamentals of Statistical Signal Processing: Estimation Theory, Prentice Hall, 1993.
[38] A. Papoulis and S. U. Pillai, Probability, Random Variables and Stochastic Processes, 4th ed., McGraw-Hill, 2002.
You can download the Project files here: Download files now. (You must be logged in).


Responses