

Rainwater Harvesting Calculator & Water Tank Size
Size rainwater and outage storage with a daily water balance. Compare tank capacity, demand coverage, overflow and refill time, and animate a full year of tank levels.

This rainwater harvesting calculator helps engineers, students and property owners compare roof collection with household demand. It follows water into and out of a tank every day, showing why a large annual rainfall total can still leave a building short of water during a dry season. Use it for early sizing of nonpotable supplies and for comparing practical storage options.
Set up the collection system
Enter the horizontal roof area connected to the tank, the runoff efficiency before first flush, and the equivalent runoff depth diverted on each wet day. Runoff efficiency accounts for roof and conveyance losses; first flush is deducted separately. The single-storm input estimates an event volume and diverter size without changing the annual rainfall record.
Choose a 2025 NASA POWER rainfall pattern for Bengaluru, Johannesburg or Nairobi. These are daily estimates for grid cells, not measurements at your plot or long-term climate normals. The rainfall multiplier tests wetter or drier versions while keeping daily timing. For another preliminary scenario, choose constructed seasonal storms and enter annual depth, wet-season dates and spacing. Equal storms are a sensitivity assumption, not observed weather.
Compare tanks and shortages
Set nominal capacity, usable fraction and initial fill. The usable fraction removes space that cannot supply demand, such as freeboard and water below the outlet. Enter only the per-person daily use that this tank must serve. The default represents selected household uses.
The water tank size calculator reports the share of demand delivered, the percentage of days fully supplied, unmet demand and overflow. Compare the capacity curve before buying a larger tank: more storage can bridge dry intervals, but cannot create additional roof runoff. Press ▶ to follow usable storage through the year. Results begin on January 1 with your chosen initial water; an empty start is deliberately demanding.
Plan for supply interruptions
If you are asking “how much water storage do I need” for an outage, enter its duration. This separate calculation assumes a full usable tank, no rainfall and constant demand. It reports the nominal capacity needed and the selected tank's no-rain autonomy. Refill time assumes the stated external inflow returns continuously while daily consumption continues. That inflow is never added to the annual rainwater simulation.
Limits and installation
A single year gives scenario service, not a guaranteed future reliability. Final sizing needs local multi-year daily rainfall, demand variation and drought assessment. The model does not size gutters, pumps, treatment, foundations or groundwater recharge works, and does not establish drinking-water safety. Local storage, recharge, plumbing and approval rules vary; this tool does not certify compliance. Have a qualified person design and install the system, including overflow routing, protected connections and any required treatment.
How it is calculated
The roof-volume relation follows CGWB's Manual on Artificial Recharge of Ground Water (2007), printed pp.118–119 (attached pp.130–131). The Texas manual (2005), printed pp.8 and 29–39 (attached pp.13 and 34–44), explains first flush and supply–demand storage balance. This tool derives a daily capped balance from conservation of water; it does not reproduce the Texas monthly algorithm.
For each one-day interval, roof runoff is . Consistent length and volume conversions are explicit. First flush is a runoff-equivalent depth: . Deduct on every wet day to obtain tank inflow . The diverter volume is independent of runoff efficiency; a small event can be diverted completely.
With usable capacity and preceding storage , overflow is . Water held is , delivered demand is , and closing storage is . This is an inflow, spill, then demand convention. Full-demand reliability counts days with unmet demand below L; volume coverage is total delivered divided by total demanded. The capacity curve repeats this balance for 13 nominal sizes from zero to twice the selected tank.
For a no-supply, no-rain outage starting full, and . Full-tank autonomy is . Empty-to-full refill time while use continues is ; refill inflow must exceed demand. When it does not, refill time is undefined and the result reads “Cannot refill while demand continues”; this is a nonblocking warning. This independent scenario is not a protected reserve or a mains top-up rule in the annual model.
Assumptions
- Constant daily demand, covered watertight storage, no tank evaporation or leakage, no pump or filter throughput limit.
- First flush resets on each wet day, not each separately resolved storm. Consecutive wet days each lose the selected diversion; several storms in a day share one diversion. Select this assumption deliberately.
- The first-flush default of 0.5 mm and runoff efficiency of 0.85 are editable preliminary assumptions. Texas gives variable first-flush guidance, not a universal hygiene prescription. Avoid counting first flush again in the runoff efficiency.
- NASA POWER MERRA2 PRECTOTCORR values are daily mm/day estimates integrated over one day, stored as mm. The unmodified 2025 totals are Bengaluru 824.70 mm, Johannesburg 716.31 mm and Nairobi 558.15 mm. All 365 days are present for every city. Rainfall is local solar time.
- Constructed storms divide the entered annual depth equally among wet days from the first day through the last day at the chosen interval. They do not wrap across New Year and have no claim to measured or forecast rainfall.
- January 1 starts at the selected initial fraction; no warm-up or automatic annual repetition. Initial water is included in service, but excluded from harvested volume. No rainfall is credited in the outage or refill calculations.
- Dead storage and freeboard are represented together by the usable fraction. The animated level represents usable volume fraction, not physical water depth or tank geometry.
Where it applies
Preliminary volumetric sizing of one roof-fed storage tank for a 365-day scenario. Daily aggregation cannot resolve storm intensity, within-day use, gutter losses or multiple first-flush resets; the spill-before-demand convention is conservative when a full tank is drawn during a storm. A 2025 scenario percentage is not a long-term reliability probability. Use local multi-year data and drought sequences for final supply design.
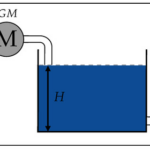
No current jurisdiction's regulatory sizing rule is implemented. Historical manuals are methodological references, not evidence of present legal compliance. Check the local rules and the standard in force at the project location. Groundwater recharge needs separate hydrogeological and contamination assessment. Potable use needs appropriate treatment, testing and approval. Installation, backflow protection, overflow drainage and structural work belong to a qualified person. The schematic is a process illustration, not a construction or gravity-flow layout.
References
- Texas Water Development Board (2005), The Texas Manual on Rainwater Harvesting, third edition. Printed pp.8, 29–39; https://www.twdb.texas.gov/publications/brochures/conservation/doc/RainwaterHarvestingManual_3rdedition.pdf (open copy attached from https://wrrc.arizona.edu/sites/default/files/twdb_the%20texas%20manual%20on%20rwh.pdf).
- Central Ground Water Board (September 2007), Manual on Artificial Recharge of Ground Water, §7.2.7 and §7.3, printed pp.117–119. Official publication record: https://cgwb.gov.in/cgwbpnm/publication-detail/362 ; open copy attached: https://cwas.org.in/resources/file_manager/module_3-3_6_manual_on_artificial_recharge_of_ground_water_cpcb.pdf .
- NASA POWER Daily API v2.10.1, MERRA2, PRECTOTCORR, local solar time, calendar 2025; retrieved 2026-10-27. API documentation: https://power.larc.nasa.gov/api/pages/ . Exact location queries are attached as sources s2, s3 and s5; coordinates and totals are recorded with the rainfall table.
Inputs
| Input | Symbol | Unit | Default |
|---|---|---|---|
| Daily rainfall pattern City options use NASA POWER 2025 daily gridded rainfall estimates, not rain-gauge records or climate normals. Constructed storms are a sensitivity scenario. | climate | Bengaluru · 2025 | |
| Rainfall multiplier Scales each daily depth, preserving its timing. Try 0.7 for a drier sensitivity; this is not a return-period drought. | k_rain | 1 | |
| Constructed annual rainfall Total depth distributed equally among constructed wet days before the rainfall multiplier. | P_design | mm | 900 |
| Wet season starts · day of year | wet_start | 100 | |
| Wet season ends · day of year For a season crossing New Year, use a historical pattern or test two separate seasons. This simple pattern does not wrap. | wet_end | 300 | |
| Interval between constructed storms | rain_gap | day | 5 |
| Connected horizontal roof area Use the horizontal projected area draining to this tank, not the sloping roof surface. | A_roof | m^2 | 120 |
| Runoff efficiency before first flush Fraction reaching the diverter after roof and conveyance losses. Excludes the first-flush loss entered separately. | C_roof | 0.85 | |
| First-flush runoff depth per wet day Equivalent diverted runoff depth over the connected area. The diverter resets each wet day; 0.5 mm over 120 m² is 60 L. Site hygiene requirements govern. | flush_mm | mm | 0.5 |
| Single-storm rainfall depth Separate event-volume estimate; does not modify the annual rainfall series. | P_storm | mm | 25 |
| Nominal tank capacity | K_tank | L | 5000 |
| Usable fraction of nominal capacity Excludes freeboard, sediment allowance and water below the outlet. No extra emergency reserve is protected from daily use. | usable | 0.9 | |
| Initial fraction of usable storage Annual simulation starts on January 1. Zero tests first-year operation from empty. Any initial water contributes to service and is not counted as harvested rain. | s_initial | 0 | |
| People served | people | 4 | |
| Daily use per person Only demand allocated to this tank. The default represents selected household uses, not a recommended drinking-water allowance. | use_pp | L/day | 40 |
| No-supply outage duration Separate full-tank, no-rain scenario. The annual rainwater simulation receives no mains top-up. | outage_days | day | 7 |
| Reliable refill inflow External supply after service returns, available continuously at this rate. Daily demand continues during refill; rain is ignored. | q_refill | L/min | 2 |
| ▶ Inspect day of year Plays the end-of-day usable tank level for the selected rainfall year. 1 = January 1; 365 = December 31. | day_now | 270 |
Results
With the default inputs above, the calc gives:
| Result | Value |
|---|---|
| Demand supplied (%) | 66.8 |
| Days fully supplied (%) | 65.8 |
| Annual inflow before tank overflow | 74,455 L |
| Annual demand needing another supply | 19,364 L |
| Annual tank overflow | 35,419 L |
| Nominal storage for selected outage | 1,244 L |
| No-rain autonomy from full | 28.1 day |
| Empty-to-full refill with ongoing use | 39.7 h |
| Separate storm yield after first flush | 2,490 L |
| First-flush diverter volume | 60 L |
Checked against sources
Each case below was calculated by this calc and agrees with the value from its source (within the tolerance where one is shown).
CGWB scarcity storage: eight people for 120 days
Source: CGWB (2007), printed p.118, attached p.130: 8 people × 120 days × 6 L/person/day gives 5,760 L before rounding to 6,000 L. This checks the unrounded usable storage requirement.
Inputs: People served = 8; Daily use per person = 6 L/day; No-supply outage duration = 120 day; Usable fraction of nominal capacity = 1; the others as above.
| Result | Source | This calc |
|---|---|---|
| Usable water required for the selected outage | 5,760 L | 5,760 L |
| Nominal storage for selected outage | 5,760 L | 5,760 L |
CGWB tiled roof: 15,000 L annual runoff
Source: CGWB (2007), printed p.119, attached p.131, worked roof-yield example: 1000 mm × 20 m² × 0.75 = 15000 L. With first flush disabled, the constructed daily distribution must preserve this independently published annual yield.
Inputs: Daily rainfall pattern = Constructed seasonal storms; Constructed annual rainfall = 1,000 mm; Wet season starts · day of year = 1; Wet season ends · day of year = 365; Connected horizontal roof area = 20 m²; Runoff efficiency before first flush = 0.75; First-flush runoff depth per wet day = 0 mm; the others as above.
| Result | Source | This calc |
|---|---|---|
| Annual inflow before tank overflow | 15,000 L | 15,000 L |
Texas manual: one inch over one square foot
Source: Texas Manual (2005), printed p.29, attached p.34: approximately 0.62 US gal per ft² per inch. Expected 0.62 US gal = 2.3469542 L. Tolerance 0.02 L allows the manual's rounded coefficient; exact geometric conversion gives about 0.6234 US gal. The model keeps exact geometry.
Inputs: Connected horizontal roof area = 0.0929 m²; Runoff efficiency before first flush = 1; First-flush runoff depth per wet day = 0 mm; Single-storm rainfall depth = 25.4 mm; the others as above.
| Result | Source | This calc |
|---|---|---|
| Separate storm yield after first flush | 2.347 ± 0.02 L | 2.36 L |









Responses