

Fast Charging Without Lithium Plating: SPMe Safe C-Rate
Find the LG M50 charging rate that keeps the anode above lithium-plating onset. Solve the full SPMe and compare constant current with a four-step charging profile.

How fast can this cell charge?
Lithium plating fast charging limits depend on the anode potential inside a cell, not just its terminal voltage. This calculator estimates a charging window for the nominal 5 Ah LG M50 cell using the single particle model with electrolyte, or SPMe. It is intended for battery engineers comparing charge strategies and for students learning how diffusion, electrolyte polarization and reaction kinetics constrain charging.
Set the cell temperature, initial SOC and target SOC. SOC is a fraction: 0.20 means 20%. Choose a trial charging current as a multiple of 1C; for this cell, 1C is 5 A. The rate search ceiling bounds the optimization. Set the terminal voltage ceiling and the desired positive anode potential margin. A zero margin tests the thermodynamic lithium-plating threshold of 0 V versus Li/Li⁺; a positive margin reserves additional potential headroom.
The calculator searches for the highest resolved constant current that completes the entire SOC window while meeting the specified limits. It reports both the C-rate and current, together with the governing constraint. If the search ceiling governs, the result is a lower bound on the unrestricted feasible rate. The trial-current curves help explain why a proposed safe charging current succeeds or fails. A voltage-limited trial can also cross the plating criterion later in the requested window; these curves describe the proposed uninterrupted CC trajectory.
The four-step schedule divides the SOC window into equal bands. Each band starts from the particle and electrolyte concentrations left by the preceding band. The search chooses the largest feasible current in that band, with subsequent currents constrained to decrease or remain constant. This is a practical stepped CC construction, not a globally minimum-time charging controller. The schedule lists current and switching times for comparison.
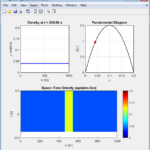
Play the charging-time control to see lithium filling change in the representative particles. The radial profiles show surface-to-core gradients; the electrolyte curve shows transport across the anode, separator and cathode. The schematic enlarges particles and separator for readability and does not represent the wound cell geometry.
The engine implements the full canonical transient SPMe of Marquis and colleagues, including both spherical diffusion equations, electrolyte diffusion and migration, electrode-averaged Butler–Volmer kinetics, and solid/electrolyte potential reconstruction. It uses Chen’s tuned LG M50 simulation parameters. The measured Arrhenius energies change charge-transfer rates with temperature; transport properties remain at their reference values.
The result is a model-based plating criterion, not a manufacturer charging rating. It does not predict deposited lithium, nucleation, dendrites, heat generation, aging, cell imbalance or pack cooling. In particular, low-temperature transport is not independently calibrated here. Evaluate a real charging design against cell-specific measurements, thermal behavior and the cell maker’s charging limits.
How it is calculated
The full canonical SPMe, Marquis et al. (2019), dimensional Eq. (48), attached pp. 32–33, is solved with the tuned LG M50 parameters from Chen et al. (2020), Table IX, attached p. 20, as implemented in PyBaMM 25.10.2 Chen2020. The measured Table VII diffusivities and concentrations are not substituted for that tuned set.
For each particle, , with zero centre flux and prescribed Faradaic surface flux. Across the three cell regions, , with concentration/flux continuity and blocked collector boundaries. Charge is positive in the user interface; the paper's discharge-positive current is its negative.
Spherical shell volumes and harmonic interface diffusion resistances form conservative finite-volume operators: 28 radial cells per particle and 18/6/18 through-cell cells. A mass-weighted symmetric eigendecomposition retains every discrete diffusion mode. Each constant-current segment is propagated by the exact matrix exponential, including the conserved zero mode. This solves the complete spatially discretized transient equations without a particle-profile approximation or a steady electrolyte substitution.
The exchange density is ; symmetric Butler–Volmer is inverted analytically as . Chen's 35.0 and 17.8 kJ/mol charge-transfer activation energies supply (attached p. 17). The canonical electrolyte diffusivity and conductivity are evaluated at 1000 mol/m³, as required by Eq. (48).
The electrode-averaged voltage includes reaction, electrolyte concentration, electrolyte Ohmic and solid Ohmic terms. Local anode solid and electrolyte potentials are reconstructed at every anode cell centre and both boundaries; the minimum of , rather than the averaged anode potential or the arbitrarily grounded collector potential, is compared with 0 V versus Li/Li⁺ and the entered margin.
A 12-iteration bisection tests 121 nonuniform time samples over each candidate segment. Final CC curves use 221 samples and each of four stepped bands uses 161. The stepped search carries both particle fields and the electrolyte field between bands and prevents current increases.
Assumptions
- A fresh, initially relaxed LG M50 cell with uniform particle concentrations and 1000 mol/m³ electrolyte; fixed, spatially uniform cell temperature.
- Nominal SOC counts 5 Ah from the tuned full-charge concentrations (29866 and 17038 mol/m³). The resulting empty-end stoichiometries follow lithium conservation on this capacity scale; they are not the measured Table VII endpoints.
- Constant tuned solid diffusivities, fixed particle radii/porosities, ideal electrolyte activity, transference number 0.2594 and Bruggeman exponent 1.5. The anode's graphite–SiOₓ mixture is represented by one effective particle, as in this parameter set.
- Temperature changes charge-transfer kinetics and thermal voltage. Solid diffusion and electrolyte transport retain the 25 °C reference values because this source set does not supply their temperature activation energies.
- No side reactions, SEI film resistance, hysteresis, thermal feedback, mechanical stress, loss of lithium or loss of active material.
Where it applies
“Feasible” means the resolved SPMe trajectory stays above the requested local anode potential margin, below the entered terminal voltage, within particle filling 0.0001–0.9999 and within electrolyte concentration 50–2500 mol/m³. These concentration guards are computational operating bounds chosen here, not experimentally established validity limits. Rates are searched from 0.005C to the entered ceiling; the bracket width is at most (ceiling − 0.005)/4096 C. No result claims a maximum above that ceiling.
The canonical SPMe is an asymptotic porous-electrode model. Large electrolyte deviations from 1000 mol/m³, steep OCP regions, high currents, or strongly nonuniform reactions reduce its accuracy. Its linearized electrolyte potential and reference transport coefficients are intrinsic to the cited canonical model. Temperature extrapolation below Chen's 25–60 °C kinetic measurements is particularly uncertain, and the omitted temperature dependence of transport can substantially overestimate cold-cell capability. A positive potential margin does not account for parameter uncertainty, local defects or plating nucleation.
The finite grid and finite event samples can miss thin initial diffusion layers or brief potential dips. All finite-volume modes are retained; only spatial and time-sampling resolution is finite. Particle surface filling uses quadratic extrapolation. The radial picture uses PCHIP through the solved radial cells and the electrolyte picture uses PCHIP between the 42 solved through-cell points; animation evaluates the stored segment state at the selected time, rather than replaying the charge search.
Independent 60-cell-per-particle, 60/20/60 electrolyte PyBaMM benchmarks configure the canonical Eq. (48) transport and averaged-exchange kinetics explicitly; they are not unmodified PyBaMM composite-SPMe runs. These checks verify the implementation, not real-cell fast-charge accuracy. The four-band profile is sequentially feasible and need not be globally time optimal. Check actual cell temperature, aging, cooling and manufacturer charge limits separately. The trial trace intentionally continues past the voltage threshold to diagnose the proposed CC window; discard its predictions after a concentration guard is crossed.
References
- Marquis, Sulzer, Timms, Please and Chapman (2019), An Asymptotic Derivation of a Single Particle Model with Electrolyte, J. Electrochem. Soc. 166, A3693–A3706. DOI: 10.1149/2.0341915jes. Open manuscript: https://arxiv.org/abs/1905.12553
- Chen et al. (2020), Development of Experimental Techniques for Parameterization of Multi-scale Lithium-ion Battery Models, J. Electrochem. Soc. 167, 080534. DOI: 10.1149/1945-7111/ab9050. https://wrap.warwick.ac.uk/id/eprint/136795/
- PyBaMM 25.10.2 Chen2020 tuned parameter implementation: https://github.com/pybamm-team/PyBaMM/blob/v25.10.2/src/pybamm/input/parameters/lithium_ion/Chen2020.py
- Sulzer et al. (2021), Python Battery Mathematical Modelling (PyBaMM), J. Open Research Software 9, 14. DOI: 10.5334/jors.309. Independent canonical SPMe benchmarks attached as source s5.
Inputs
| Input | Symbol | Unit | Default |
|---|---|---|---|
| Cell temperature | T_cell | °C | 25 |
| Initial SOC 0 is empty and 1 is full on the nominal 5 Ah scale. | SOC_start | 0.2 | |
| Target SOC | SOC_end | 0.8 | |
| Trial charge rate (×1C) For this 5 Ah cell, 1C means 5 A charging current. | C_trial | 1 | |
| Rate search ceiling (×1C) | C_cap | 5 | |
| Terminal voltage limit | V_limit | V | 4.2 |
| Anode potential margin Zero tests thermodynamic plating onset; a positive value adds headroom. | anode_margin | mV | 10 |
| Charging time | t_view | min | 20 |
Results
With the default inputs above, the calc gives:
| Result | Value |
|---|---|
| Maximum feasible CC rate (×1C) | 0.562 |
| Maximum constant current | 2.81 A |
| Constant-current time | 64 min |
| Four-step charging time | 45.6 min |
| Time saved | 18.5 min |
| Trial minimum anode potential | -38.85 mV |
| Trial peak cell voltage | 4.273 V |
| Trial limiting criterion | Plating criterion crossed |
| Governing CC limit | Anode potential |
Checked against sources
Each case below was calculated by this calc and agrees with the value from its source (within the tolerance where one is shown).
Room-temperature CC and rate limit
Source: Independent PyBaMM 25.10.2 canonical Eq.48 SPMe, 60 radial FV cells per particle and 60/20/60 electrolyte mesh; CasADi 3.6.7, rtol/atol 1e-9. The 1C diagnostic continues to 80% SOC beyond the 4.2 V operating limit; it is a solver comparison, not a feasible charge recommendation. A separate Brent root gives the 10 mV-margin CC limit. Tolerances cover spatial discretization and the 0.00122C bisection bracket.
Inputs: the default inputs above.
| Result | Source | This calc |
|---|---|---|
| Trial minimum anode potential | -38.789 ± 0.2 mV | -38.85 mV |
| Trial peak cell voltage | 4.273 V | 4.273 V |
| Trial final anode surface filling | 0.7463 | 0.7464 |
| Trial final cathode surface filling | 0.3124 | 0.3122 |
| Trial final mean anode electrolyte concentration | 540.3 ± 0.8 mol/m³ | 539.7 mol/m³ |
| Maximum feasible CC rate (×1C) | 0.563 ± 0.0015 | 0.5623 |
Cold-cell CC and Arrhenius rate limit
Source: Independent PyBaMM 25.10.2 / CasADi 3.6.7 canonical SPMe with Chen2020 tuned parameters, 60-cell radial mesh, 60/20/60 electrolyte mesh and 1e-9 solver tolerances. Only measured charge-transfer Arrhenius factors and RT/F change with temperature; all transport remains at reference values in both solvers. This verifies temperature implementation; it does not validate real cold-cell transport. The trial intentionally exceeds the 4.2 V operating ceiling.
Inputs: Cell temperature = 0 °C; Trial charge rate (×1C) = 0.5; the others as above.
| Result | Source | This calc |
|---|---|---|
| Trial minimum anode potential | -32.676 ± 0.1 mV | -32.699 mV |
| Trial peak cell voltage | 4.234 V | 4.234 V |
| Trial final anode surface filling | 0.7381 | 0.7381 |
| Trial final cathode surface filling | 0.3484 | 0.3484 |
| Trial final mean anode electrolyte concentration | 770.1 mol/m³ | 769.8 mol/m³ |
| Maximum feasible CC rate (×1C) | 0.2461 ± 0.0015 | 0.2452 |
Chen electrode area and 1C current density
Source: Chen et al. 2020, attached p.18: plate area and current density for the 5A 1C condition.
Inputs: the default inputs above.
| Result | Source | This calc |
|---|---|---|
| Active electrode plate area | 0.1027 m² | 0.1027 m² |
| Plate current density at 1C | 48.69 A/m² | 48.685 A/m² |
Related Resources
Related articles
Related courses

IEC Electrical Schematics and Industrial Control Panels

Basic Electrical Controls & Diagram Reading




Responses