

FAO-56 Irrigation Scheduler: ET, Soil Water and Run Time
Calculate grass-reference evapotranspiration, crop water use, soil depletion and sprinkler or drip run time. Explore a daily FAO-56 water balance across a growing season.

This irrigation scheduling calculator connects daily weather, crop growth, soil water storage and watering time in one FAO-56 workflow. It is intended for engineers, students, irrigation planners and gardeners who want to understand why a zone needs water and how long its sprinklers or drip emitters should run.
Choose Calculate from daily weather to use the Penman–Monteith equation for short-grass reference evapotranspiration, ETo. Enter the minimum and maximum temperature, relative humidity fractions, mean wind speed at 2 m, incoming daily solar energy, station elevation, latitude and weather day. All weather values must describe the same day. Alternatively, enter an ETo value from a suitable local station. Do not enter alfalfa-reference ETr or an already crop-adjusted ET value.
Next choose a constant crop coefficient for established vegetation, or define initial, development, mid-season and late-season stages. The four-stage curve holds the initial and mid-season coefficients constant and joins the stages with straight ramps. The illustrative tomato coefficients and stage lengths need local adjustment; they are not universal planting recommendations. For someone asking how long to water a lawn, constant Kc is usually the more useful starting point. Use locally appropriate turf coefficients and a measured sprinkler precipitation rate.
Set field capacity, wilting point, effective root depth and the initial water deficit. Total available water, TAW, is the plant-accessible storage between field capacity and wilting point. Readily available water, RAW, is the portion that can be depleted before stress begins. The daily bucket tracks depletion, rainfall, irrigation, drainage and stress-limited crop water use. Rain surplus first supplies that day's ET; only the remainder drains at day's end. Automatic irrigation refills the root zone early in a day when its forecast potential demand would reach RAW. The no-irrigation option shows the corresponding dry-down.
For sprinklers, enter a catch-can depth and measurement period. For drip, enter the emitter count, one emitter's collected volume over that period and the whole irrigated area. A rated 2 L/hour emitter delivers 2 L in 60 minutes. Application efficiency converts net root-zone demand to gross applied water. Run time is gross depth divided by application rate. Split long runs into practical cycles where infiltration or controller limits require it. The optional end-of-day refill result is a separate what-if calculation, not an extra scheduled dose.
Press play to inspect the season. Charts and the daily table show when watering occurs, how much water is applied and whether soil stress reduces ET. The metric/US switch converts depths, areas, collected volumes and temperatures. Solar energy keeps its stated meteorological units.
This evapotranspiration calculator implements the 1998 FAO-56 single-coefficient method, with its worked examples as checks. FAO published a revised edition in 2025. The season here repeats one ETo value and a user-defined pattern of infiltrating rain; it is a planning scenario, not a live weather forecast. Root depth stays fixed. Snow, frozen soil, salinity, capillary rise, pump pressure and pipe sizing are outside its scope. Verify soil moisture and actual system performance before setting a controller; installation work belongs to a qualified person.
How it is calculated
The calculation follows Allen et al., FAO Irrigation and Drainage Paper 56 (1998), chapters 3, 4, 6 and 8. References to equations and printed pages below refer to that edition, not FAO-56 Rev.1 (2025).
Daily short-grass reference evapotranspiration is
The daily soil heat flux is zero. Saturation vapour pressures use Eq. 11 at both temperature extremes; actual pressure uses paired RH extremes (Eq. 17). Pressure and psychrometric constant use Eqs. 7–8. Solar geometry and clear-sky radiation use Eqs. 21–25 and 37; net shortwave and longwave use Eqs. 38–40 (printed pp. 31–57; attached pp. 57–83). Albedo is 0.23. The measured 2 m wind is replaced by u_eff = max(u_2, 0.5 m/s) in both the aerodynamic numerator and wind-dependent denominator, following FAO-56 printed p. 63 (attached p. 89) to include buoyant vapour exchange under calm conditions. Absolute temperatures use the SI offset 273.15 K rather than the rounded 273/273.16 in the published examples. Negative computed daily reference ET becomes zero irrigation demand. The cloudiness ratio Rs/Rso is limited to 0.3–1, as in the ASCE daily implementation in USDA ARS pyfao56; FAO-56 explicitly caps its upper bound.
The single crop coefficient is constant or interpolated through four stages (chapter 6, Eqs. 58 and 66). The illustrative tomato Kc values 0.60/1.15/0.80 are from Table 12; stage lengths 30/40/40/25 days are the arid-region January tomato example in Table 11. Users supply site-specific adjustments. At day Lini the initial coefficient still applies; at Lini+Ldev the mid value is reached; at the sum of all stages the end value is reached.
Root-zone storage follows Eqs. 82–84 (printed pp. 161–169):
Optional daily adjustment is p = clamp(p_base + 0.04(5 − ETc), 0.1, 0.8), with ETc in mm/day. Use potential Kc ETo, not stress-reduced ET, for this adjustment.
Each day's order is: infiltrating rain; optional early-day net irrigation; stress calculation; actual ET; end-of-day deep percolation and depletion. Rain surplus above field capacity remains available to that day's ET, as required by FAO Eqs. 85–88 (printed pp. 170–171; attached pp. 196–197) and corrected Example 38 footnote 13 (attached p. 332). The automatic policy refills the remaining deficit to field capacity when that deficit plus the coming day's potential demand reaches RAW. This conservative forecast trigger is this tool's scheduling choice, rather than a claim to reproduce pyfao56 AutoIrrigate. Actual daily ET is the lesser of Ks Kc ETo × 1 day and all available water above wilting point, including that day's rain and net irrigation before drainage. Then DP = max(0, P + I_net − ET_actual − D_previous), and the balance is
All daily fluxes are depths, not rates. The matrix step simply stores the seven time series; each series is shown separately in the calculation sheet. Daily and seasonal balance residuals are rounded to 10⁻⁹ mm to suppress floating-point cancellation.
Gross applied depth is net depth / efficiency. Sprinkler rate is catch depth / measurement period. Single-emitter flow is its collected volume / that period; drip field-average rate is emitter count × flow / whole zone area (1 L/m² = 1 mm). A rated hourly flow can be entered as its volume in 60 minutes. Run time is depth / rate, explicitly converted to minutes. Seasonal volume is gross depth × area. The optional end-of-day refill uses the selected day's final deficit and is separate from its scheduled irrigation.
Assumptions
- One homogeneous soil reservoir with fixed effective root depth. Initial depletion is relative to field capacity; root growth is not simulated.
- The same daily ETo is repeated for every simulated day, even when ETo was calculated from a weather date. Rainfall is an explicitly chosen repeating pattern, not observed or forecast weather. Set rain depth to zero for a dry scenario.
- Rain input is water infiltrating after interception and runoff, before root-zone drainage. Water temporarily above field capacity can supply that day's ET; the remaining excess drains at the end of the same day. No capillary rise, lateral flow, salinity or groundwater contribution.
- Single Kc includes average soil evaporation; Ks reduces the combined crop ET. This is FAO Eq. 81's approximation, most useful when soil evaporation is not dominant. This tool does not implement pyfao56's dual-coefficient surface evaporation layer.
- Soil and root defaults reproduce the full-grown tomato storage in FAO Example 37; the weather, initial deficit, zone hardware and efficiency define an illustrative scenario. They are not site measurements.
- All emitter flows apply simultaneously and are steady. Catch depth and one-emitter collected volume share the entered measurement period. Zone area is the whole cropped area, not only wetted patches. For partial wetting, choose coefficients and effective storage appropriate to the actively managed root volume.
- Efficiency is net root-zone storage / applied water at the rate measurement point. Do not deduct drift or other losses a second time if already captured by catch-can measurements. Upstream pipe leakage and pumping capacity are not modeled.
- Infiltration limits and cycle-and-soak durations are not calculated. Displayed run time is a daily total, which may need splitting.
Where it applies
Use for daily planning in unfrozen, well-drained soil and for a single reasonably uniform irrigation zone. The weather path is limited to 60°S–60°N, −20 to 55 °C, elevations −400 to 4000 m, and actual vapour pressure no higher than 5.89 kPa for the longwave correlation. It requires measured incoming daily solar radiation and 2 m mean wind speed; it does not estimate missing weather data. Solar radiation greater than extraterrestrial radiation is rejected.
A daily potential demand larger than RAW is flagged: an early-day refill cannot keep that entire day below the stress threshold, so a shorter-step scheduler may be required. A watering total exceeding 24 hours is also flagged. Neither pressure/flow availability nor local watering restrictions are checked. Recalibrate the scenario as weather, roots, canopy and soil conditions change.
FAO-56 Rev.1 was published in 2025; this tool explicitly implements the 1998 equation numbering and single-Kc examples. It is a transparent planning model, not an automated controller recommendation. Verify measured soil moisture, local crop guidance and system delivery. Installation work belongs to a qualified person.
References
- [FAO-56 (1998), Allen, Pereira, Raes & Smith, with 2006 errata — open USDA NRCS PDF](https://www.wcc.nrcs.usda.gov/ftpref/wntsc/waterMgt/irrigation/fao56.pdf). Chapters 3, 4, 6 and 8; Examples 18, 36 and 37; Eq. 88 and corrected Example 38 (attached p. 332); calm-wind guidance (attached p. 89).
- [USDA ARS pyfao56 — primary source repository](https://github.com/kthorp/pyfao56); daily reference ET code: https://github.com/kthorp/pyfao56/blob/main/src/pyfao56/refet.py. Used to cross-check daily conventions and explain single versus dual coefficient scope.
- [Utah State University Extension (May 2021), Simple Sprinkler Performance Testing for Rich County](https://extension.usu.edu/cwel/files/simple-sprinkler-performance-testing-for-rich-county.pdf), p. 2: applied depth and catch-can run-time example.
- [FAO, Crop evapotranspiration, second edition revised 2025](https://doi.org/10.4060/cd6621en). Cited to identify the later edition; the implemented and checked equations here are from 1998.
Inputs
| Input | Symbol | Unit | Default |
|---|---|---|---|
| Reference ET source Use short-grass reference ET, not alfalfa ETr or crop ET. | eto_mode | Calculate from daily weather | |
| Supplied daily grass-reference ET depth One day's short-grass reference ET; 5 mm here means 5 mm/day. Use the same daily depth throughout this scenario. | eto_given | mm | 5 |
| Minimum air temperature Daily minimum; same 24-hour period as the other weather inputs. | T_min | °C | 18 |
| Maximum air temperature Daily maximum. | T_max | °C | 30 |
| Minimum relative humidity Fraction: 0.35 means 35%. | RH_min | 0.35 | |
| Maximum relative humidity Fraction: 0.80 means 80%. | RH_max | 0.8 | |
| Mean wind speed at 2 m 24-hour measured mean at 2 m over reference grass. FAO-56 uses an effective minimum of 0.5 m/s in Penman–Monteith to include buoyancy under calm conditions. | u_2 | m/s | 2 |
| Incoming daily solar radiation Daily energy per area, not an instantaneous W/m² reading. | R_s | MJ/(m^2*day) | 24 |
| Latitude, north positive Southern latitudes are negative; this tool is limited to 60°S–60°N. | lat | deg | 35 |
| Weather day of year 1 = January 1; used only to calculate this day's ETo. | J_day | 180 | |
| Weather station elevation Elevation above mean sea level. | z_site | m | 100 |
| Crop coefficient curve Use locally appropriate single crop coefficients for grass-reference ETo. | kc_mode | Four growth stages | |
| Constant crop coefficient For an established lawn use a local turf coefficient; the default is only an illustration. | kc_fixed | 0.9 | |
| Initial Kc Illustrative tomato coefficients from FAO-56 Table 12; adjust for local climate and wetting. | kc_ini | 0.6 | |
| Mid-season Kc Illustrative tomato coefficients from FAO-56 Table 12; adjust for local climate and wetting. | kc_mid | 1.15 | |
| End-of-season Kc Illustrative tomato coefficients from FAO-56 Table 12; adjust for local climate and wetting. | kc_end | 0.8 | |
| Initial stage duration Illustrative tomato, arid-region January planting: FAO-56 Table 11. Durations are site dependent. | L_ini | day | 30 |
| Development stage duration Illustrative tomato, arid-region January planting: FAO-56 Table 11. Durations are site dependent. | L_dev | day | 40 |
| Mid-season duration Illustrative tomato, arid-region January planting: FAO-56 Table 11. Durations are site dependent. | L_mid | day | 40 |
| Late-season duration Illustrative tomato, arid-region January planting: FAO-56 Table 11. Durations are site dependent. | L_end | day | 25 |
| Days to simulate Day 1 is the first day of the initial stage. Beyond the stage lengths, Kc holds its end value. | n_days | day | 135 |
| Field-capacity water content Volumetric fraction m³/m³; measure or obtain for your soil. | theta_fc | 0.32 | |
| Wilting-point water content Volumetric fraction m³/m³, smaller than field capacity. | theta_wp | 0.12 | |
| Effective root depth Fixed depth over the simulation. Use the actively irrigated root depth. | Z_r | m | 0.8 |
| Initial root-zone depletion Water missing from field capacity at the beginning of day 1; zero means field capacity. | D_initial | mm | 55 |
| Depletion fraction at ETc = 5 mm/day FAO-56 Table 22. Smaller fractions trigger irrigation sooner. | p_base | 0.4 | |
| Adjust depletion fraction for daily ETc FAO-56: p = p_base + 0.04 (5 − ETc), limited to 0.1–0.8. | adjust_p | true | |
| Irrigation policy Rain arrives first, irrigation second, ET last. Automatic net irrigation refills to field capacity. | schedule_mode | Refill before forecast RAW is crossed | |
| Infiltrating rain per event Rain after interception and runoff, before drainage; zero disables rain. No weather forecast is downloaded. | P_event | mm | 10 |
| First rain day Repeat infiltrating rain from this day at the chosen interval. | rain_first | day | 7 |
| Rain interval Days between identical planning rain events. | rain_every | day | 7 |
| Watering system Run time applies to the whole zone. For drip, Kc must reflect your canopy and wetting conditions. | system_type | Sprinkler / measured precipitation rate | |
| Application efficiency Net root-zone depth / measured applied depth. Include only losses not already reflected by catch-can or emitter measurements. | eta_app | 0.8 | |
| Irrigated zone area Whole cropped or turf area, including dry spaces between drip lines. | A_zone | m^2 | 100 |
| Sprinkler catch-test depth Average depth collected across the zone during the measurement period below. For 12 mm/hour enter 12 mm and 60 min. | r_sprinkler | mm | 12 |
| Emitters operating together Total emitters on this zone, not emitters per plant. | n_emit | 100 | |
| One emitter: volume during measurement period A 2 L/hour emitter delivers 2000 cm³ in 60 min. You can type a value with units, such as 2 L or 0.5 gal. Use one emitter's measured or rated delivery. | q_emit | cm^3 | 2000 |
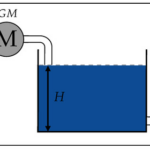
| Inspect season day · ▶ play Moves the picture and selected-day results through the cached season. Values beyond the season are clipped to its last day. | day_cursor | day | 67 |
| Measurement period Time used for the sprinkler catch depth or single-emitter volume. To enter a rated hourly delivery, use 60 min. | test_time | min | 60 |
Results
With the default inputs above, the calc gives:
| Result | Value |
|---|---|
| Grass-reference ETo · daily depth | 5.75 mm |
| Selected day · crop coefficient | 1.11 |
| Selected day · actual crop water use | 6.37 mm |
| Total available root-zone water | 160 mm |
| Selected day · readily available water | 55.2 mm |
| Selected day · end depletion | 6.4 mm |
| Selected day · water stress coefficient | 1 |
| Selected day · net irrigation | 50.3 mm |
| Selected day · gross irrigation | 62.9 mm |
| Selected day · scheduled watering | 315 min |
| Optional full refill after selected day | 40 min |
| Season · irrigation days | 10 |
| Season · gross irrigation | 711.3 mm |
| Season · gross irrigation volume | 71.13 m³ |
| Season · watering time | 59.3 h |
| Season · actual crop water use | 709.8 mm |
Checked against sources
Each case below was calculated by this calc and agrees with the value from its source (within the tolerance where one is shown).
FAO-56 Example 18 · Uccle daily weather
Source: FAO-56 (1998), Example 18, printed pp. 72–73, attached PDF pp. 98–99. Use published measured/derived Rs = 22.07 MJ/m²/day and u2 = 2.078 m/s directly. The example's sunshine line uses inconsistent daylength (16.1/16.3 h); this check avoids that line. Rounding tolerance 0.03 mm/day; equations are not fitted.
Inputs: Minimum air temperature = 12.3 °C; Maximum air temperature = 21.5 °C; Minimum relative humidity = 0.63; Maximum relative humidity = 0.84; Mean wind speed at 2 m = 2.078 m/s; Incoming daily solar radiation = 22.07 MJ/(m²·day); Latitude, north positive = 50.8 deg; Weather day of year = 187; the others as above.
| Result | Source | This calc |
|---|---|---|
| Grass-reference evapotranspiration used | 3.88 ± 0.03 mm/day | 3.88 mm/day |
| Extraterrestrial radiation · Eq. 21 | 41.09 ± 0.06 MJ/(m²·day) | 41.088 MJ/(m²·day) |
| Actual vapour pressure · FAO Eq. 17 | 1.409 ± 0.003 kPa | 1.409 kPa |
FAO-56 Example 37 · ten-day tomato dry-down
Source: FAO-56 (1998), Example 37, printed p. 168 / attached p. 194: constant Kc = 1.2, ETo = 5 mm/day, TAW = 160 mm, RAW = 64 mm, D0 = 55 mm. Published daily values round to 0.1 mm; implementation carries full precision. Disable ET-based p adjustment to reproduce the published constant p.
Inputs: Reference ET source = Enter grass-reference ETo; Crop coefficient curve = Constant Kc (e.g. established turf); Constant crop coefficient = 1.2; Adjust depletion fraction for daily ETc = no; Days to simulate = 10 day; Infiltrating rain per event = 0 mm; Irrigation policy = No irrigation (dry-down comparison); Inspect season day · ▶ play = 10 day; the others as above.
| Result | Source | This calc |
|---|---|---|
| Total available root-zone water | 160 mm | 160 mm |
| End-of-day root-zone depletion [10] | 104.5 ± 0.12 mm | 104.5 mm |
| Actual daily crop ET · Eq. 81 [10] | 3.7 ± 0.06 mm | 3.7 mm |
| Daily soil-water stress coefficient · Eq. 84 [3] | 0.97 ± 0.005 | 0.9688 |
FAO-56 Example 36 · maize on loamy sand
Source: FAO-56 (1998), Example 36, printed p. 166 / attached p. 192. Maize, loamy sand: Zr = 1.2 m, thetaFC = 0.15, thetaWP = 0.06, p = 0.55. Published table gives TAW = 108 mm and RAW = 59 mm (rounded whole millimetres).
Inputs: Reference ET source = Enter grass-reference ETo; Crop coefficient curve = Constant Kc (e.g. established turf); Constant crop coefficient = 1; Field-capacity water content = 0.15; Wilting-point water content = 0.06; Effective root depth = 1.2 m; Depletion fraction at ETc = 5 mm/day = 0.55; Adjust depletion fraction for daily ETc = no; Initial root-zone depletion = 0 mm; Days to simulate = 1 day; Infiltrating rain per event = 0 mm; Irrigation policy = No irrigation (dry-down comparison); Inspect season day · ▶ play = 1 day; the others as above.
| Result | Source | This calc |
|---|---|---|
| Total available root-zone water | 108 mm | 108 mm |
| Selected day · readily available water | 59 ± 0.5 mm | 59.4 mm |
USU published catch-can example · half an inch in 30 min
Source: Utah State University Extension, Simple Sprinkler Performance Testing for Rich County (May 2021), p. 2. Published applied-depth example: 0.5 inch at 1 inch/hour takes 30 min. Inputs convert inches exactly to mm; eta = 1 because the stated depth is an applied/gross depth, not an extra efficiency correction.
Inputs: Reference ET source = Enter grass-reference ETo; Supplied daily grass-reference ET depth = 0 mm; Crop coefficient curve = Constant Kc (e.g. established turf); Constant crop coefficient = 1; Days to simulate = 1 day; Inspect season day · ▶ play = 1 day; Initial root-zone depletion = 12.7 mm; Irrigation policy = No irrigation (dry-down comparison); Infiltrating rain per event = 0 mm; Sprinkler catch-test depth = 25.4 mm; Application efficiency = 1; the others as above.
| Result | Source | This calc |
|---|---|---|
| Optional full refill after selected day | 30 min | 30 min |
FAO Eq. 88 · rain surplus supplies ET before drainage
Source: Independent review regression case, using FAO-56 Eq. 88 (printed pp. 170–171; PDF pp. 196–197) and corrected Example 38 footnote 13 (PDF p. 332): at field capacity, 10 mm infiltrating rain and 5 mm crop ET leave 5 mm drainage and zero end depletion. Expected boundary values follow the independently specified water partition, not this implementation.
Inputs: Reference ET source = Enter grass-reference ETo; Crop coefficient curve = Constant Kc (e.g. established turf); Constant crop coefficient = 1; Initial root-zone depletion = 0 mm; First rain day = 1 day; Irrigation policy = No irrigation (dry-down comparison); Days to simulate = 1 day; Inspect season day · ▶ play = 1 day; the others as above.
| Result | Source | This calc |
|---|---|---|
| Daily deep percolation · FAO Eq. 88 [1] | 5 mm | 5 mm |
| End-of-day root-zone depletion [1] | 0 mm | 0 mm |
| Actual daily crop ET · Eq. 81 [1] | 5 mm | 5 mm |
FAO calm-weather minimum effective wind
Source: Independent reviewer supplied ETo = 4.642 mm/day for the listed weather and the FAO minimum effective wind of 0.5 m/s (raw measurement 0 m/s). FAO-56 chapter 3, printed p. 63 / PDF p. 89 recommends this floor for buoyancy and unstable boundary-layer exchange. The expected ET is the reviewer's independent cross-check, not a number published in FAO-56.
Inputs: Mean wind speed at 2 m = 0 m/s; the others as above.
| Result | Source | This calc |
|---|---|---|
| Grass-reference evapotranspiration used | 4.642 mm/day | 4.642 mm/day |






Responses