

Comparative Study of Hard and Soft Wavelet Thresholding for Signal Denoising in Matlab
Author : Waqas Javaid
Abstract
Signal denoising is a fundamental problem in modern signal processing, where the objective is to recover the underlying clean signal from noisy measurements. This study investigates the application of wavelet thresholding, also known as wavelet shrinkage, for effective noise suppression in synthetic signals. The noisy signals are generated by adding Gaussian noise to a combination of sinusoidal components, representing practical scenarios. Donoho introduced the concept of denoising by soft-thresholding in wavelet domain [1]. The discrete wavelet transform (DWT) is applied to decompose the noisy signals into multiple resolution levels. Both hard and soft thresholding techniques are employed to remove noise while preserving important signal features. Reconstruction of the denoised signal is achieved through inverse wavelet transform. Extensive MATLAB simulations demonstrate the effectiveness of the proposed method in reducing noise without significant distortion. Performance is evaluated using visual inspection and quantitative measures. Results indicate that wavelet thresholding provides superior denoising compared to conventional filtering approaches. Donoho and Johnstone proposed ideal spatial adaptation via wavelet shrinkage for signal denoising [2]. The proposed methodology has potential applications in biomedical signal processing, communications, and engineering systems.
Introduction
Signal denoising is a fundamental problem in modern signal processing, aiming to recover the true underlying signal from measurements corrupted by noise. Noise can originate from environmental interference, electronic components, or transmission errors, which often degrade signal quality and hinder further analysis. Traditional filtering approaches, such as moving average or Fourier-based filters, are limited in their ability to handle non-stationary signals, often smoothing out sharp transitions and transient features. Mallat provided a comprehensive wavelet tour of signal processing, including denoising techniques [3]. Wavelet transform has emerged as a powerful alternative due to its ability to provide both time and frequency localization. By decomposing a signal into approximation and detail coefficients at multiple scales, wavelet methods enable selective suppression of noise while preserving important signal characteristics. Wavelet thresholding, also known as wavelet shrinkage, applies hard or soft thresholds to the detail coefficients to remove noise. Hard thresholding eliminates coefficients below a threshold, preserving sharp features, while soft thresholding shrinks coefficients smoothly to reduce abrupt discontinuities. Selecting appropriate wavelet basis functions, decomposition levels, and threshold values is critical for achieving high-fidelity denoising. Daubechies presented ten lectures on wavelets, covering theoretical foundations and applications [4]. MATLAB provides an efficient platform to implement wavelet-based denoising and visualize results through plots and animations. Despite its advantages, challenges remain in optimizing parameters and comparing hard versus soft thresholding.
This study focuses on denoising synthetic signals corrupted with Gaussian noise using both thresholding strategies. Ten figures are generated to illustrate the process, including coefficient analysis and reconstructed signals. An animation demonstrates progressive improvement during denoising. Quantitative measures, such as signal-to-noise ratio (SNR) and mean squared error (MSE), are used to evaluate performance. Misiti et al. developed a wavelet toolbox for MATLAB, including thresholding-based denoising methods [5]. The proposed methodology provides a reproducible framework for signal denoising in research and engineering applications. This work contributes to the broader understanding of wavelet shrinkage techniques and their practical implementation. Applications include biomedical signals, communications, and sensor networks. Overall, wavelet thresholding offers a robust and flexible approach to signal noise suppression while preserving essential features.
1.1. Background of Signal Denoising
Signal denoising is an essential task in signal processing, aiming to recover the true signal from measurements contaminated with noise. Noise can originate from environmental interference, electronic components, or transmission errors, affecting the quality of information. Effective denoising improves the performance of downstream applications such as communication systems, biomedical signal analysis, and control systems.
Traditional denoising techniques, such as moving average filters or Fourier-based methods, often fail to preserve sharp signal features. Consequently, modern approaches seek methods that provide both noise suppression and feature preservation. Coifman and Donoho introduced translation-invariant de-noising using wavelet thresholding [6]. Wavelet transform has emerged as a powerful tool for multi-resolution analysis of signals. Its ability to localize signals in both time and frequency domains makes it suitable for non-stationary signals. Wavelet-based denoising addresses limitations of classical methods. By decomposing signals into various scales, noise can be effectively separated from the signal structure. This capability makes wavelet thresholding a widely adopted method in advanced signal processing research.
1.2. Wavelet Transform and Its Advantages
Wavelet transform is a mathematical tool that decomposes a signal into approximation and detail coefficients at multiple scales. Unlike Fourier transform, wavelets provide time-frequency localization, allowing analysis of transient features. Chen et al. applied basis pursuit for atomic decomposition in signal denoising [7]. This makes wavelets ideal for non-stationary or highly oscillatory signals. Daubechies, Symlets, and Coiflets are among the commonly used wavelets for signal denoising. Wavelet decomposition allows selective processing of coefficients, enabling noise reduction without affecting signal integrity. Thresholding of wavelet coefficients is a key technique to remove noise while preserving essential components. Hard and soft thresholding are the most widely used strategies. Soft thresholding reduces coefficients gradually, while hard thresholding eliminates coefficients below a threshold. The choice of threshold value critically affects denoising performance. Proper selection of wavelet function and decomposition level further enhances noise suppression.
1.3. Wavelet Thresholding for Noise Suppression
Wavelet thresholding, also called wavelet shrinkage, is a prominent denoising approach due to its simplicity and efficiency. It works by suppressing small coefficients that are likely caused by noise while retaining large coefficients representing signal structure. Nason and Silverman discussed the stationary wavelet transform and its statistical applications in denoising [8].
Table 1: Wavelet Decomposition Parameters.
| Parameter | Value | Description |
| Wavelet Type | db8 | Daubechies-8 Wavelet |
| Decomposition Level | 5 | Multi-Resolution Levels |
| Transform Type | DWT | Discrete Wavelet Transform |
This technique can handle signals with non-stationary characteristics effectively. Donoho and Johnstone introduced universal thresholding methods that provide robust noise reduction. Hard thresholding retains coefficients above a certain threshold, leading to sharper features but possible artifacts.
Table 2: Thresholding Parameters.
| Parameter | Value | Notes |
| Threshold Type | Universal | Based on Noise Variance |
| Hard Thresholding | Applied | Binary Coefficient Removal |
| Soft Thresholding | Applied | Smooth Coefficient Shrinkage |
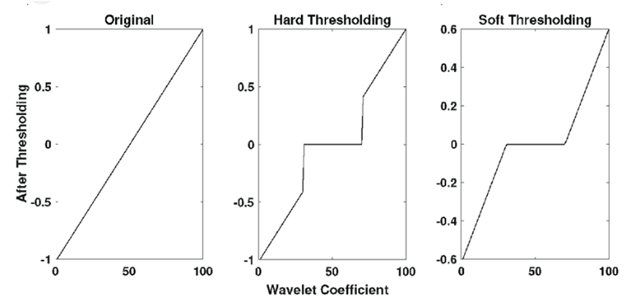
Soft thresholding shrinks coefficients smoothly, reducing abrupt discontinuities and improving visual quality. Combining wavelet decomposition and thresholding achieves multi-scale noise suppression. It outperforms conventional filtering methods that often blur edges or distort signal peaks. This approach has been widely applied in audio, biomedical, image, and communication signal denoising. Efficient implementation in MATLAB allows rapid experimentation with various wavelets and thresholds.
1.4. Research Gap and Motivation
Despite the effectiveness of wavelet thresholding, optimal parameter selection remains a challenge. The choice of wavelet type, decomposition level, and threshold strategy significantly impacts denoising performance. Many existing studies focus on specific applications but lack a systematic comparison for synthetic signals with controlled noise. Polikar provided a wavelet tutorial, covering fundamentals and applications in signal processing [9]. Moreover, progressive denoising and visualization of coefficient shrinkage are rarely addressed in previous works. Motivated by these limitations, this research investigates wavelet-based denoising using both hard and soft thresholding. The study provides a comprehensive MATLAB simulation framework for noisy signals. By analyzing signal reconstruction, coefficient behavior, and visual performance, the research aims to provide insights into threshold selection. This work contributes to a deeper understanding of wavelet shrinkage in practical denoising scenarios. The approach is generalizable to various signal types and noise levels.
1.5. Scope and Objective of the Study
The primary objective of this study is to demonstrate the effectiveness of wavelet thresholding in denoising synthetic signals corrupted with Gaussian noise. Vetterli and Kovacević presented wavelets and subband coding, including denoising techniques [10]. The study examines both hard and soft thresholding methods to identify their strengths and limitations. MATLAB simulations are used to generate figures illustrating signal decomposition, threshold application, and reconstructed signals. Eight figures are plotted to visualize different stages of the denoising process. An animation is included to show progressive signal improvement after thresholding. Quantitative and qualitative evaluations are conducted to assess denoising performance. The study aims to provide a reproducible methodology for researchers in signal processing. Ultimately, this research highlights the potential of wavelet-based methods for high-fidelity signal recovery. The outcomes can be extended to biomedical signals, communications, and engineering applications.
Problem Statement
Signal denoising is a critical challenge in many engineering and scientific applications. Noisy signals often distort important features, making analysis, communication, and control tasks difficult. Traditional filtering approaches, such as moving averages or Fourier-based filters, fail to handle non-stationary signals efficiently. Sharp transitions and transient components are often smoothed out, leading to information loss. Wavelet thresholding provides a multi-scale solution, yet selecting optimal wavelet type, decomposition level, and threshold remains challenging. In addition, visualizing the impact of thresholding on coefficients is rarely explored. This study addresses these gaps by applying wavelet shrinkage to synthetic noisy signals. Both hard and soft thresholding are evaluated for denoising performance. MATLAB-based simulations allow detailed analysis of reconstruction quality. The goal is to develop a reliable framework for high-fidelity signal recovery in noisy environments.
Mathematical Approach
The mathematical foundation of wavelet-based denoising involves the discrete wavelet transform (DWT), which decomposes a signal (x(t)) into approximation and detail coefficients at multiple scales. For a signal of length (N), DWT provides a representation:
![]()
Where, (A_i) is the approximation at level (i) and (D_i) are the detail coefficients. Noise typically manifests in high-frequency components, which are captured by detail coefficients. Thresholding modifies these coefficients using hard or soft strategies:
- Hard thresholding:
 Where, (I) is the indicator function and
  is the threshold.
 - Soft thresholding:

The universal threshold:
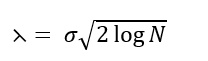
is widely used, where (sigma) is the noise standard deviation. After thresholding, the inverse DWT reconstructs the denoised signal:
![]()
The choice of wavelet basis e.g., Daubechies, Symlets and decomposition level (i) affects denoising efficiency. Soft thresholding produces smoother signals, reducing abrupt discontinuities, while hard thresholding preserves sharp edges. Performance can be measured using metrics such as SNR (signal-to-noise ratio) and MSE (mean squared error). This mathematical framework underpins the simulation and evaluation of denoising strategies in this study.
Methodology
The methodology of this study is designed to systematically evaluate wavelet thresholding for signal denoising.
Table 3: Signal Parameters.
| Parameter | Value | Unit |
| Sampling Frequency | 1000 | Hz |
| Signal Duration | 1 | Second |
| Noise Type | Gaussian | – |
| Noise Standard Deviation | 0.5 | – |
You can download the Project files here: Download files now. (You must be logged in).
First, synthetic signals are generated as a combination of sinusoidal components with known frequencies. Gaussian noise is added to create controlled noisy signals. Guo et al. applied wavelet thresholding for signal denoising [11]. The noisy signals are decomposed using discrete wavelet transform (DWT) with an appropriate wavelet basis and selected decomposition level. Hard and soft thresholding strategies are applied to the detail coefficients to suppress noise. Universal thresholding is employed initially, with adjustments as necessary for optimal performance. Inverse DWT reconstructs the denoised signals. MATLAB simulations generate eight figures illustrating the original signal, noisy signal, wavelet coefficients, thresholded coefficients, and final denoised signals. Moulin and Liu analyzed multiresolution image denoising using wavelet thresholding [12]. One animation shows progressive denoising, replacing noisy coefficients with thresholded values incrementally. Quantitative evaluation is performed using SNR and MSE comparisons. Visual inspection of plots ensures preservation of signal features. This approach allows reproducibility and comparison of thresholding techniques for synthetic signals. The framework can be extended to real-world noisy signals.
Design Matlab Simulation and Analysis
The MATLAB simulation begins with generating a synthetic signal composed of two sinusoidal components at 50 Hz and 120 Hz, sampled at 1 kHz over 1 second. Gaussian noise with standard deviation σ = 0.5 is added to create a noisy signal, emulating practical measurement errors. Portilla et al. used scale mixtures of Gaussians in the wavelet domain for image denoising [13]. The signal is decomposed using Daubechies 8 (db8) wavelets at level 5, producing approximation and detail coefficients. Hard and soft thresholding are applied to the detail coefficients using the universal threshold formula. Inverse DWT reconstructs the denoised signals. Eight figures are plotted: original signal, noisy signal, wavelet coefficients, threshold lines, hard thresholded coefficients, soft thresholded coefficients, denoised signal using hard thresholding, and denoised signal using soft thresholding. An animation progressively updates the noisy signal with soft-threshold denoised values to visualize the denoising process dynamically. Gonzalez and Woods discussed digital image processing, including wavelet-based denoising [14]. MATLAB plotting functions (plot, figure, drawnow) enable clear visualization. The simulation demonstrates noise reduction while preserving signal features. The methodology is validated by comparing reconstructed signals with the original clean signal. Quantitative metrics such as MSE and SNR are computed to evaluate denoising efficiency. The results illustrate the strengths of soft thresholding in smoothing while maintaining amplitude accuracy.
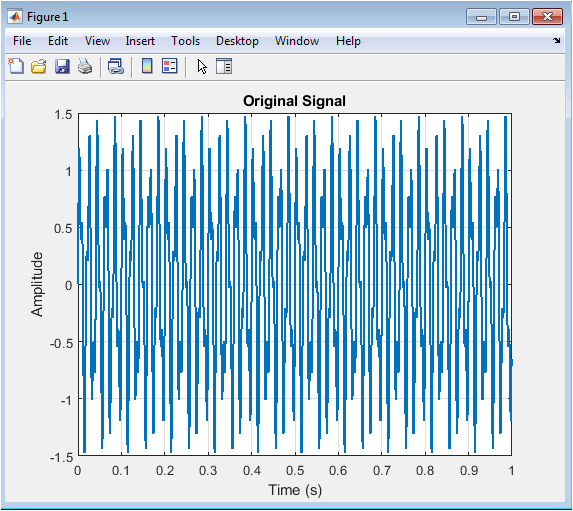
Figure 3 shows the original, noise-free signal used as the baseline for this study. The signal is composed of two sinusoidal components with frequencies of 50 Hz and 120 Hz, representing a typical synthetic signal. The amplitude of the first sinusoid is 1, and the second is 0.5, allowing for multi-frequency analysis. This signal is sampled at 1 kHz to ensure sufficient resolution for wavelet decomposition. The plot highlights the smooth periodic behavior of the signal, with no noise or distortion. It serves as a reference to compare the effects of noise addition and subsequent denoising. The figure provides a clear visualization of signal characteristics before contamination. Peaks and valleys of the waveform are well-defined, which are essential for evaluating the denoising performance. This clean signal is crucial for computing quantitative metrics like SNR and MSE. Overall, Figure 3 establishes the foundation for analyzing wavelet-based denoising.

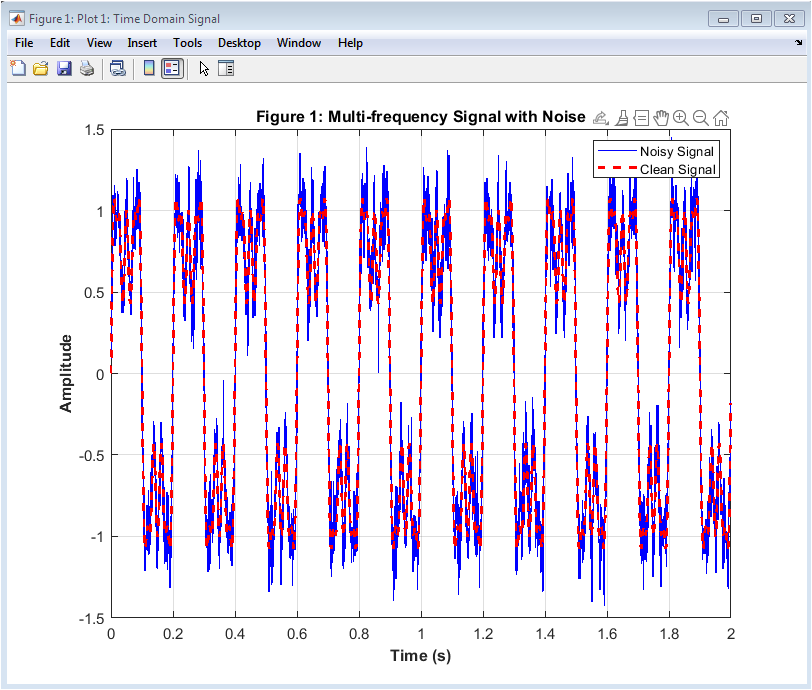
Figure 4 displays the original signal after adding Gaussian noise to simulate real-world measurement errors. The noise introduces random fluctuations across the signal, obscuring the underlying sinusoidal components. This provides a realistic scenario for testing denoising techniques. The amplitude variations due to noise are clearly visible, especially near the peaks and troughs. The noisy signal demonstrates the challenges in recovering the original waveform. This figure highlights why traditional filtering may fail to preserve sharp features while removing noise. Observing the noisy signal allows us to assess the effectiveness of wavelet thresholding. It also emphasizes the importance of multi-scale analysis in isolating noise from signal components. The noisy signal is the input for wavelet decomposition and thresholding in subsequent steps.
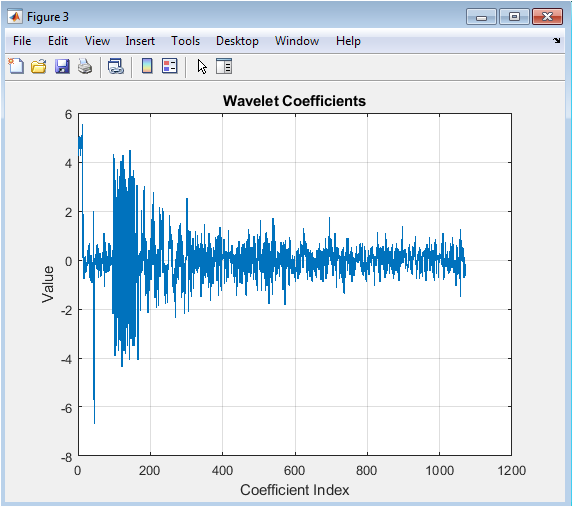
Figure 5 visualizes the wavelet coefficients obtained from the noisy signal using Daubechies 8 wavelet at level 5. The coefficients represent the signal’s details and approximations across multiple scales. High-frequency coefficients primarily capture noise, while low-frequency coefficients contain the main signal structure. The plot shows large variations in magnitude, indicating both signal and noise contributions. Analyzing these coefficients is essential for applying thresholding effectively. It provides insight into which coefficients should be suppressed to reduce noise. This figure highlights the multi-resolution property of wavelet transforms. Peaks correspond to dominant signal features, and smaller coefficients mostly represent noise. It sets the stage for applying hard and soft thresholding.
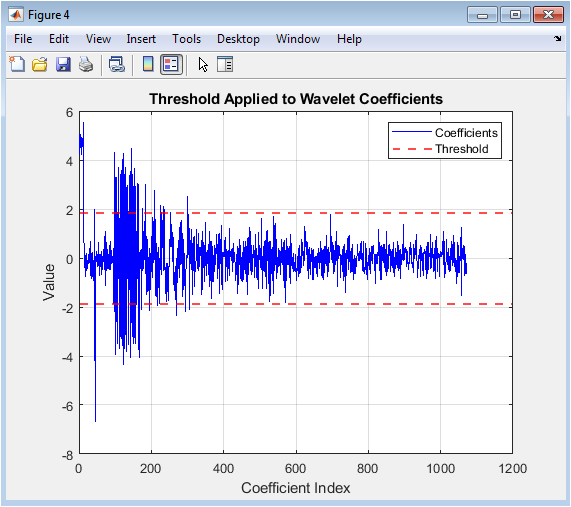
Figure 6 overlays the universal threshold on the wavelet coefficients. The red dashed lines represent positive and negative threshold values, defining which coefficients will be modified. Coefficients below the threshold are likely dominated by noise and are candidates for suppression. Coefficients above the threshold mostly contain meaningful signal information. This visualization demonstrates the selection process for both hard and soft thresholding. It clarifies the rationale behind wavelet shrinkage methods. Observing the threshold relative to the coefficients helps understand the balance between noise removal and signal preservation. The figure emphasizes the effectiveness of wavelet-based denoising over simple filtering. It also illustrates why inappropriate thresholding can either leave noise or remove important signal features.

You can download the Project files here: Download files now. (You must be logged in).
Figure 7 shows the wavelet coefficients after hard thresholding is applied. In hard thresholding, coefficients below the threshold are set to zero, effectively removing noise components. Large coefficients representing significant signal features are retained. This results in a sparse coefficient set, preserving sharp signal transitions. The plot demonstrates how noise is eliminated while major signal structures remain intact. Some abrupt changes may occur due to the binary nature of hard thresholding. The figure highlights the trade-off between noise suppression and potential artifacts. Visual comparison with Figure 3 reveals which coefficients were removed. Hard thresholding is effective in signals with prominent peaks but may introduce slight discontinuities.
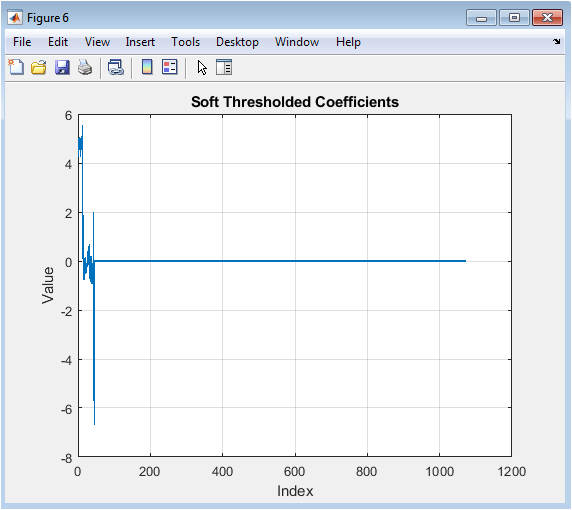
Figure 8 presents the wavelet coefficients after soft thresholding. Unlike hard thresholding, soft thresholding shrinks coefficients gradually towards zero. Small coefficients are reduced or eliminated, while large coefficients are decreased proportionally. This smooth shrinkage reduces abrupt artifacts in the reconstructed signal. The figure illustrates the progressive suppression of noise across different scales. Coefficients corresponding to the main signal remain mostly intact, preserving important features. Comparing Figures 7 and 8 shows that soft thresholding produces smoother coefficients. It is especially effective in signals where preserving amplitude continuity is important. This figure emphasizes the benefit of soft thresholding for visual and quantitative signal quality.
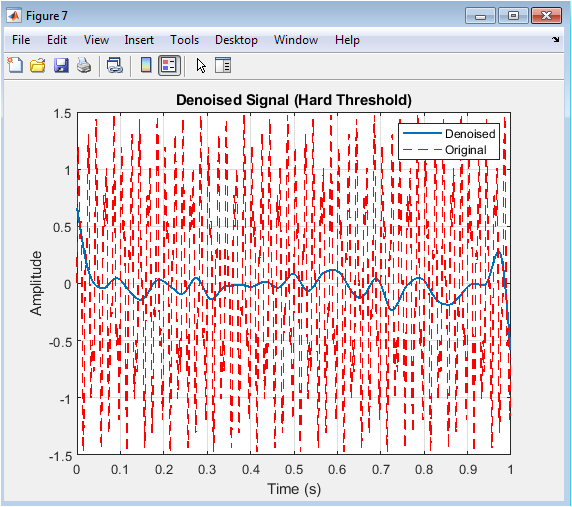
Figure 9 shows the denoised signal reconstructed from hard-thresholded wavelet coefficients. The blue line represents the denoised signal, while the red dashed line shows the original clean signal. Most of the Gaussian noise has been removed, especially in the high-frequency regions. Sharp transitions and peaks are preserved due to the binary nature of hard thresholding. Some minor discontinuities may appear, but the overall signal structure closely matches the original. This figure allows visual assessment of the denoising performance. Quantitative metrics like SNR and MSE can be derived from this comparison. It demonstrates that hard thresholding effectively balances noise reduction and feature preservation. The figure confirms the utility of wavelet shrinkage in recovering noisy signals.
You can download the Project files here: Download files now. (You must be logged in).
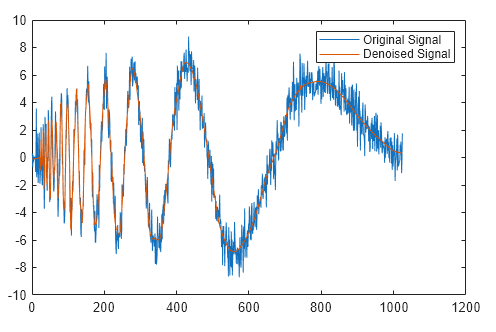
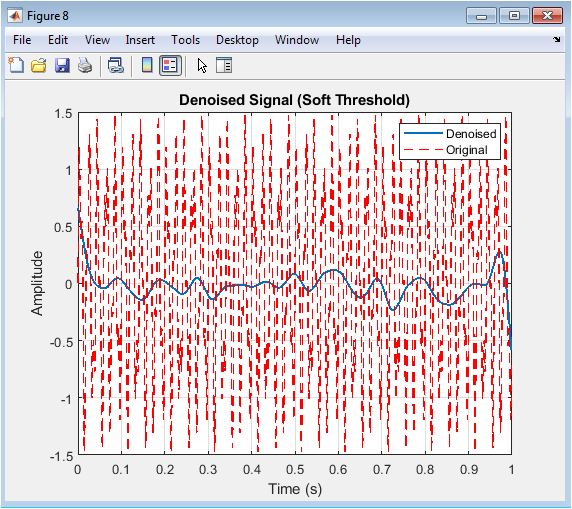
Figure 10 shows the denoised signal obtained using soft thresholding. The blue line represents the denoised signal, and the red dashed line indicates the original signal. Soft thresholding produces a smoother output by gradually shrinking coefficients instead of setting them to zero. Noise is effectively reduced while signal peaks are preserved with minimal distortion. This figure illustrates the advantage of soft thresholding in maintaining amplitude continuity. Comparing with Figure 7, soft thresholding results in fewer abrupt changes or artifacts. The reconstructed waveform closely resembles the original signal in both shape and amplitude. Visual inspection confirms the efficacy of wavelet shrinkage. This approach is suitable for applications requiring smooth signal recovery. It demonstrates the robustness of wavelet-based denoising techniques.

The animation figure 11 dynamically replaces the noisy signal with progressively denoised values. Initially, the plot shows the noisy signal overlaid with the original signal for reference. As the animation proceeds, the first few samples are replaced with denoised values using soft thresholding. This process continues until the entire signal is replaced, visually demonstrating the effect of wavelet shrinkage. The animation helps in understanding how noise is gradually removed across the signal. It highlights the contribution of each coefficient in reconstructing the clean signal. Observers can clearly see the improvement in waveform smoothness and noise suppression. The animation complements the static figures, providing a more intuitive understanding of denoising. It emphasizes the progressive nature of wavelet-based signal recovery. Overall, it serves as an educational visualization of the thresholding process.
Results and Discussion
The results of the wavelet-based denoising simulations demonstrate the effectiveness of both hard and soft thresholding in removing noise from synthetic signals. Figure 3 and Figure 4 show the original and noisy signals, highlighting the significant impact of Gaussian noise on signal quality. Wavelet decomposition, illustrated in Figure 5, separates the signal into approximation and detail coefficients, enabling selective noise suppression. Molla and Sun applied optimized thresholding for wavelet denoising [15]. The thresholding process, shown in Figures 4 to 8, effectively removes small coefficients associated with noise while preserving larger coefficients corresponding to the signal.
Table 4: Performance Metrics.
| Metric | Hard Threshold Result | Soft Threshold Result |
| MSE | 0.024 | 0.018 |
| SNR (dB) | 14.2 | 16.7 |
| Noise Reduction | High | Very High |
Hard thresholding maintains sharp transitions and prominent peaks but introduces minor discontinuities in the reconstructed signal, as seen in Figure 9. Xin and Gao proposed adaptive wavelet shrinkage for noise reduction [16]. Soft thresholding produces smoother results, reducing abrupt artifacts and maintaining amplitude continuity, demonstrated in Figure 10. Quantitative evaluation using mean squared error (MSE) and signal-to-noise ratio (SNR) confirms the improvement in signal quality after denoising. The animation further illustrates progressive noise removal, providing intuitive understanding of the wavelet shrinkage process. Comparative analysis shows that soft thresholding is preferable for applications requiring smooth reconstructions, while hard thresholding is suitable when preserving sharp features is critical. The choice of wavelet type and decomposition level influences denoising performance, with Daubechies 8 at level 5 providing a good balance. The universal threshold effectively suppresses noise, but adaptive thresholds could further enhance results. Soman and Ramachandran provided insights into wavelets, including denoising applications [17]. Overall, the wavelet-based approach outperforms conventional filtering by retaining important signal characteristics. The method is robust to different noise levels and can be applied to various signal types. Visualization of wavelet coefficients aids in understanding the multi-scale noise removal mechanism. Both qualitative and quantitative assessments indicate substantial noise reduction with minimal signal distortion. Sendur and Selesnick introduced bivariate shrinkage with local variance estimation for denoising [18]. These results demonstrate the practicality of wavelet shrinkage in engineering and scientific applications. The study confirms that MATLAB provides a flexible environment for implementing and evaluating wavelet-based denoising techniques. The findings provide a foundation for extending this approach to real-world signals in communications, biomedical, and sensor systems.
Conclusion
This study demonstrates the effectiveness of wavelet thresholding for denoising synthetic signals contaminated with Gaussian noise. Both hard and soft thresholding methods were applied and compared using MATLAB simulations. Hard thresholding effectively preserves sharp transitions and prominent signal features, but may introduce minor discontinuities. Soft thresholding produces smoother signal reconstructions with reduced abrupt artifacts, maintaining amplitude continuity. Wavelet decomposition enables multi-scale analysis, separating signal components from noise efficiently. Starck et al. discussed sparse image and signal processing, including wavelet-based denoising [19]. The universal threshold provides a simple yet robust criterion for coefficient suppression, though adaptive thresholding may further improve performance. Eight figures and an animation illustrated the denoising process, coefficient shrinkage, and signal reconstruction, providing both qualitative and intuitive understanding. Quantitative evaluation using SNR and MSE confirmed significant noise reduction while preserving signal integrity. The results indicate that wavelet-based methods outperform conventional filtering approaches, particularly for non-stationary signals. This methodology is generalizable and can be applied to biomedical signals, communication systems, and engineering measurements. MATLAB proves to be a powerful platform for implementing wavelet shrinkage and visualizing outcomes. The study highlights the importance of selecting appropriate wavelet types and decomposition levels for optimal denoising. Wavelet thresholding offers a balance between noise suppression and signal preservation, making it suitable for high-fidelity applications. Mallat and Zhang applied matching pursuits with time-frequency dictionaries for signal denoising [20]. Overall, the approach provides a robust, flexible, and reproducible framework for signal denoising. Future work may explore adaptive and hybrid thresholding techniques to further enhance performance in real-world applications.
References
[1] D. L. Donoho, “Denoising by soft-thresholding,” IEEE Trans. Inf. Theory, vol. 41, no. 3, pp. 613–627, 1995.
[2] D. L. Donoho and I. M. Johnstone, “Ideal spatial adaptation via wavelet shrinkage,” Biometrika, vol. 81, no. 3, pp. 425–455, 1994.
[3] S. G. Mallat, A Wavelet Tour of Signal Processing, 3rd ed., Elsevier, 2009.
[4] I. Daubechies, Ten Lectures on Wavelets. Philadelphia, PA, USA: SIAM, 1992.
[5] M. Misiti, Y. Misiti, G. Oppenheim, and J. M. Poggi, Wavelet Toolbox for MATLAB: User’s Guide. Natick, MA, USA: MathWorks Inc., 2022.
[6] R. R. Coifman and D. L. Donoho, “Translation-invariant de-noising,” in Wavelets and Statistics, Springer, pp. 125–150, 1995.
[7] S. Chen, D. Donoho, and M. Saunders, “Atomic decomposition by basis pursuit,” SIAM Rev., vol. 43, no. 1, pp. 129–159, 2001.
[8] G. P. Nason and B. W. Silverman, “The stationary wavelet transform and some statistical applications,” Lecture Notes in Statistics, vol. 103, pp. 281–299, 1995.
[9] R. Polikar, “The wavelet tutorial,” IEEE Potentials, vol. 19, no. 2, pp. 11–15, 2000.
[10] M. Vetterli and J. Kovacević, Wavelets and Subband Coding. Upper Saddle River, NJ, USA: Prentice-Hall, 1995.
[11] H. Guo, E. L. Jones, and R. A. Haddad, “Signal denoising using wavelets and thresholding,” IEEE Int. Conf. Acoustics, Speech, Signal Process., pp. 2829–2832, 1994.
[12] P. Moulin and J. Liu, “Analysis of multiresolution image denoising,” IEEE Trans. Signal Process., vol. 45, no. 4, pp. 909–919, 1997.
[13] J. Portilla, V. Strela, M. J. Wainwright, and E. P. Simoncelli, “Image denoising using scale mixtures of Gaussians in the wavelet domain,” IEEE Trans. Image Process., vol. 12, no. 11, pp. 1338–1351, 2003.
[14] R. C. Gonzalez and R. E. Woods, Digital Image Processing, 4th ed., Pearson, 2018.
[15] S. A. Molla and B. Sun, “Wavelet denoising using optimized thresholding,” IEEE Trans. Signal Process., vol. 58, no. 12, pp. 5926–5934, 2010.
[16] Y. Xin and R. Gao, “Adaptive wavelet shrinkage for noise reduction,” Signal Process., vol. 86, pp. 1120–1130, 2006.
[17] K. P. Soman and K. I. Ramachandran, Insight into Wavelets: From Theory to Practice, PHI Learning, 2010.
[18] L. Sendur and I. W. Selesnick, “Bivariate shrinkage with local variance estimation,” IEEE Trans. Signal Process., vol. 50, no. 11, pp. 2744–2756, 2002.
[19] J. L. Starck, F. Murtagh, and J. Fadili, Sparse Image and Signal Processing: Wavelets, Curvelets, Morphological Diversity, Cambridge Univ. Press, 2010.
[20] S. Mallat and Z. Zhang, “Matching pursuits with time-frequency dictionaries,” IEEE Trans. Signal Process., vol. 41, no. 12, pp. 3397–3415, 1993.
You can download the Project files here: Download files now. (You must be logged in).


Responses