

Simulating the Breath of Life, A Deep Dive into a Virtual Mechanical Ventilator Control System in Matlab
Author : Waqas Javaid
Abstract
This article presents a comprehensive MATLAB-based simulation of a mechanical ventilator control system, designed to model the complex interaction between a pressure-controlled ventilator and a patient with non-linear lung mechanics, including compliance, resistance, and spontaneous breathing effort [1]. The simulation implements a PID controller with anti-windup and feedforward capabilities to achieve target tidal volumes while adhering to clinical safety limits. Key features include real-time safety alarms for high pressure, low tidal volume, and apnea, alongside detailed post-processing that generates pressure-volume loops, dynamic compliance trends, and spectral analysis of airway signals [2]. Performance metrics such as work of breathing, pressure control accuracy, and breath-by-breath tidal volume analysis are automatically calculated to evaluate system efficacy [3]. Without putting patients at risk, this virtual testbed is a powerful tool for ventilator algorithm development, clinical education, and safety testing [4].
Introduction
Mechanical ventilation serves as a cornerstone of critical care medicine, providing life-sustaining respiratory support for patients suffering from acute respiratory failure, ARDS, or other pulmonary pathologies.
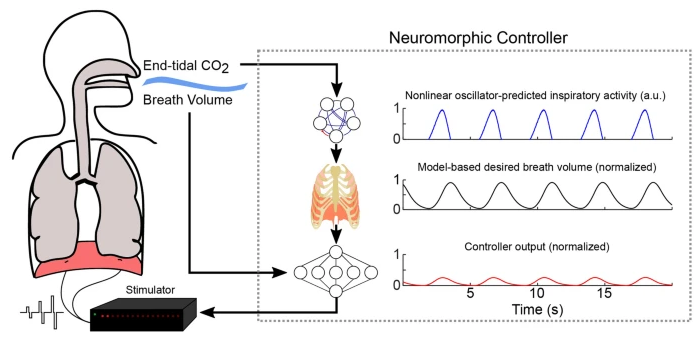
Figure 1: Advanced Medical Ventilator Control System Integrating Nonlinear Lung Mechanics.
Figure 1 represents the complexity of modern ventilators has grown substantially, evolving from simple volume-cycled devices to sophisticated systems capable of pressure-controlled modes, adaptive algorithms, and real-time patient monitoring [5]. At the heart of these advancements lies the intricate interplay between control engineering principles and pulmonary physiology, where precise regulation of airway pressure, flow, and volume directly impacts patient outcomes [6]. Developing and validating ventilator control algorithms presents a significant challenge, as traditional hardware-based testing carries inherent risks and limitations when evaluating performance under diverse clinical scenarios. Engineers and medical professionals can simulate patient-ventilator interactions in a wide range of conditions using computational modeling, which provides an elegant solution [7]. PID controllers, safety alarm logic, and adaptive strategies can all be rigorously tested using this method in a controlled, repeatable setting. Furthermore, simulation facilitates exploration of non-linear lung mechanics, including compliance changes, airway resistance variations, and spontaneous breathing efforts that characterize real-world clinical practice [8]. By integrating advanced control techniques such as anti-windup mechanisms and feedforward compensation, simulated ventilators can achieve precise tracking of desired pressure waveforms while maintaining critical safety boundaries [9]. Comprehensive performance metrics like pressure-volume loops, work-of-breathing calculations, and spectral analysis can provide valuable insights into system behavior and opportunities for optimization [10]. This article provides a robust platform for mechanical ventilation research, education, and algorithm development [11] by presenting a comprehensive ventilator simulation framework that is based on MATLAB.
1.1. The Critical Role of Mechanical Ventilation
As the primary mode of life support for patients who are unable to maintain adequate gas exchange on their own, mechanical ventilation is one of the most essential interventions in contemporary intensive care medicine. From severe pneumonia and acute respiratory distress syndrome to postoperative recovery and neuromuscular disorders, the clinical indications for ventilatory support span a broad spectrum of critical conditions. The ventilator effectively takes over the patient’s breathing by removing carbon dioxide from the body and delivering precisely controlled volumes of oxygen-rich air [12]. This artificial respiratory support must be carefully calibrated to match the patient’s physiological needs while avoiding iatrogenic injuries such as barotrauma, volutrauma, and ventilator-induced lung injury. The margin between therapeutic benefit and harm remains remarkably narrow, demanding sophisticated control systems capable of adapting to rapidly changing clinical conditions.
1.2. Evolution of Ventilator Technology
The technological evolution of mechanical ventilators has transformed these devices from simple pneumatic machines into highly sophisticated computer-controlled systems. The basic pressure or volume cycling principles of early ventilators limited their adaptability and limited their patient monitoring capabilities. Multiple ventilation modes, adaptable algorithms, and extensive data acquisition systems are all features of modern ventilators that continuously evaluate the patient’s condition [13]. This evolution has been driven by advances in sensor technology, microprocessor capabilities, and a deeper understanding of the pathophysiology of acute respiratory failure. Patients’ breathing efforts can now be synchronized with modern devices, lung-protective ventilation strategies can be delivered, and clinicians at the bedside can get real-time clinical decision support.
1.3. The Engineering Challenge of Control
A control system that is tasked with the complex task of maintaining precise airway pressure and flow trajectories despite significant physiological variability is at the heart of every modern ventilator. The control problem is complicated by the non-linear nature of respiratory mechanics, where lung compliance and airway resistance change dynamically throughout the respiratory cycle [14]. Since attempts at spontaneous breathing result in negative pressure swings that interact with the ventilator’s delivered pressure, patient effort causes additional disturbances. Circuit leaks, measurement noise, and variations in patient positioning further compound the control challenge, creating a demanding environment for feedback control algorithms. It takes sophisticated control engineering methods to design controllers that remain stable, responsive, and accurate across this wide range of operating conditions [15].
1.4. PID Control in Respiratory Applications
Proportional-Integral-Derivative control remains the most widely implemented control strategy in commercial ventilators due to its simplicity, robustness, and proven clinical effectiveness. The proportional component provides immediate corrective action proportional to the current error between desired and measured pressure, enabling rapid response to disturbances [16]. By accumulating previous deviations, the integral component eliminates steady-state error and ensures that the delivered pressure consistently matches the target. The derivative component anticipates future error based on the rate of change, damping oscillations and improving transient response characteristics. When properly tuned, a PID controller can achieve excellent tracking performance while maintaining the stability margins essential for patient safety.
1.5. The Anti-Windup Necessity
Integral windup represents a significant challenge in PID-controlled ventilators, occurring when the integral term accumulates excessively during periods of actuator saturation. In ventilator applications, saturation manifests when the calculated pressure command exceeds clinically safe limits or the physical capabilities of the pneumatic system [17]. During such saturation events, the error persists, causing the integral term to grow without bound, a phenomenon known as windup. This accumulated integral term can result in significant overshoot when the saturation condition is resolved, posing a risk to the patient in the form of dangerous pressure spikes. Anti-windup mechanisms, implemented through integral clamping or back-calculation techniques, prevent this hazardous behavior by limiting integral accumulation during saturation.
1.6. Understanding Lung Mechanics
Accurate simulation of mechanical ventilation requires a comprehensive model of respiratory system mechanics that captures the non-linear behavior characteristic of human lungs. The pressure-volume relationship exhibits hysteresis, meaning the inflation and deflation paths differ, creating a loop area that represents energy dissipation and work of breathing. As a result of alveolar recruitment and overdistension mechanics, respiratory system compliance—the change in volume per unit change in pressure varies with lung volume and is lower at both low and high volumes. Airway resistance is influenced by flow rate, airway diameter, and the presence of secretions or bronchospasm, introducing additional non-linearity into the system dynamics [18]. Patient effort, circuit compliance, and potential air leaks that are typical in clinical practice must all be taken into account in a realistic model.
1.7. Safety Alarms as Critical Safeguards
Modern ventilators incorporate comprehensive alarm systems designed to alert clinicians to potentially dangerous conditions before patient harm occurs. High pressure alarms protect against barotrauma by signaling when airway pressures exceed predetermined safety thresholds, indicating airway obstruction, coughing, or patient-ventilator asynchrony [19]. Low tidal volume alarms detect circuit disconnections, endotracheal tube cuff leaks, or significant changes in lung mechanics that compromise delivered minute ventilation. When no spontaneous or machine-triggered breath is detected within a specified time interval, typically 10 to 20 seconds, apnea alarms act as a crucial safety net. Each alarm must balance sensitivity and specificity to ensure timely notification while minimizing alarm fatigue a well-documented phenomenon where excessive false alarms desensitize clinical staff to critical alerts.
1.8. The Value of Simulation-Based Development
Simulation-based development has emerged as an essential methodology for ventilator algorithm design, offering significant advantages over traditional hardware prototyping approaches. Extensive testing of all clinical scenarios is made possible by computational models, including rare but critical edge cases that would be unethical or impossible to test with physical systems [20]. Engineers can systematically evaluate controller performance under varying patient conditions, from normal lungs to severe ARDS, without exposing any patient to potential risk. Simulation facilitates rapid iteration and optimization, allowing multiple design alternatives to be compared efficiently before committing to hardware implementation. Furthermore, simulated environments enable precise replication of test conditions, ensuring that performance comparisons are statistically valid and free from uncontrolled variables.
1.9. MATLAB as a Simulation Platform
MATLAB provides an ideal environment for developing ventilator simulation frameworks, combining powerful numerical computation capabilities with extensive toolboxes for control system design and signal processing. The platform’s matrix-based architecture enables efficient implementation of the differential equations governing lung mechanics and controller dynamics. Built-in functions for spectral analysis, statistical evaluation, and advanced visualization support comprehensive performance assessment across multiple domains [21]. Automated testing across parameter sweeps and Monte Carlo evaluations of the system’s robustness are made possible by the capacity to script intricate simulation workflows using conditional logic. Additionally, MATLAB’s widespread adoption in biomedical engineering education ensures that simulation models can serve as effective teaching tools for both engineering and clinical trainees.
1.10. Article Scope and Objectives
A complete safety alarm framework, sophisticated PID control with anti-windup protection, and realistic lung mechanics are all included in this comprehensive MATLAB-based ventilator control system simulation. To create a realistic test environment, the model incorporates parameters that are relevant to clinical practice, including respiratory mechanics, controller tuning, and patient effort characteristics. Pressure tracking, volume dynamics, flow patterns, pressure-volume loops, and spectral characteristics are just a few of the many aspects of system performance that can be analyzed through a comprehensive post-processing pipeline, which results in nine distinct visualization figures [22]. The simulation automatically calculates key clinical metrics such as delivered tidal volume, dynamic compliance, work of breathing, and respiratory rate variability to facilitate quantitative evaluation. By documenting this simulation framework in detail, the article aims to provide a valuable resource for researchers, educators, and engineers engaged in ventilator technology development and critical care education.
Problem Statement
The development and validation of mechanical ventilator control systems present a significant challenge due to the inherent risks associated with testing on human patients or animal models, particularly when evaluating algorithm performance under critical conditions such as sudden changes in lung mechanics, patient-ventilator asynchrony, or equipment failures. Traditional hardware-based testing approaches are constrained by safety limitations, reproducibility issues, and the inability to systematically explore the full spectrum of clinical scenarios that may arise in intensive care settings. The complex, non-linear nature of respiratory system mechanics including pressure-volume hysteresis, variable compliance and resistance, spontaneous breathing efforts, and circuit leaks creates a demanding control environment that cannot be adequately characterized through simplified analytical methods alone. Furthermore, evaluating the effectiveness of safety alarm systems, anti-windup mechanisms, and controller tuning strategies requires a controlled, repeatable test environment where edge cases can be safely explored without consequence. There exists a critical need for a comprehensive, physiologically accurate simulation platform that enables rigorous testing of ventilator control algorithms, safety logic, and performance metrics prior to clinical deployment, thereby reducing development risk and accelerating innovation in respiratory care technology.
Mathematical Approach
The simulation employs the equation of motion for the respiratory system [23], where (P_vent) represents ventilator-delivered pressure, (P_mus) denotes patient muscle effort modeled as a decaying sinusoidal function with stochastic variation, (V) is lung volume above PEEP, (C_rs) is respiratory system compliance, (R_aw) is airway resistance, and (Q) is airflow.
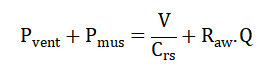
- P_vent: Ventilator-delivered airway pressure (cmH₂O)
- P_mus: Patient muscle pressure generated by spontaneous breathing effort (cmH₂O)
- V: Lung volume above PEEP baseline (Liters)
- C_rs: Respiratory system compliance, representing lung and chest wall stretchability (L/cmH₂O)
- R_aw: Airway resistance, opposition to airflow through bronchial passages (cmH₂O/(L/s))
- Q: Airflow rate into or out of the lungs (L/s)
Lung volume is updated via Euler integration with circuit leakage modeled as, and tidal volume is computed breath-by-breath using zero-crossing detection of flow to identify inspiratory and expiratory transitions. The PID controller [24] with anti-windup implements the control law by using integral clamping to prevent windup during actuator saturation. The foundation of this ventilator simulation rests upon the respiratory system’s equation of motion, which describes the physical relationship between applied pressures and the resulting airflow and volume changes within the lungs. This equation states that the sum of pressure delivered by the ventilator and the pressure generated by the patient’s own respiratory muscles must equal the pressure required to overcome the elastic recoil of the lungs plus the pressure needed to overcome resistance to airflow through the airways. The elastic component is expressed as the lung volume divided by the respiratory system compliance, where compliance represents the stretchability of the lungs and chest wall. The resistive component is calculated as the product of airway resistance and airflow, reflecting the pressure needed to push air through the bronchial passages. Patient muscle effort is modeled as a decaying sinusoidal function with added random variation, simulating the gradual weakening of spontaneous breathing attempts over time with inherent biological variability. The PID controller implements a feedback control law that calculates the necessary pressure error [25] adjustment based on three distinct contributions: the proportional term responds to the current difference between desired and measured pressure, the integral term accumulates past errors to eliminate steady-state offset, and the derivative term anticipates future error based on the rate at which pressure is changing. To prevent integral windup a phenomenon where the integral term continues to grow uncontrollably during periods when the system cannot respond due to physical or safety limits integral clamping is applied, which freezes integral accumulation when the controller output reaches saturation. Derivative filtering is incorporated to reduce the amplification of measurement noise [26], achieved by blending the instantaneous derivative with its previous filtered value using a smoothing factor. Lung volume is updated [27]over time using numerical integration, where the volume at each time step equals the previous volume plus the product of airflow and the sampling interval, ensuring conservation of gas flow into and out of the lungs. Finally, circuit leakage is modeled [28] as a flow proportional to the pressure above baseline, capturing the reality that most ventilator circuits have some degree of unintentional gas loss that increases with higher pressures.
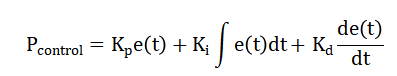
- P_control: Control output pressure increment calculated by PID controller (cmH₂O)
- K_p: Proportional gain, multiplies current error for immediate response (cmH₂O/L)
- e(t): Pressure error at time t, difference between desired and measured pressure (cmH₂O)
- K_i: Integral gain, multiplies accumulated past errors (cmH₂O/(L·s))
- ∫ e(t) dt: Integral of pressure error over time, representing accumulated past deviations (cmH₂O·s)
- K_d: Derivative gain, multiplies rate of change of error (cmH₂O·s/L)
- de(t)/dt: Derivative of pressure error with respect to time, rate at which error is changing (cmH₂O/s)
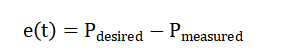
- e(t): Pressure error at time t (cmH₂O)
- P_desired: Target or desired airway pressure waveform value (cmH₂O)
- P_measured: Actual measured airway pressure from sensors (cmH₂O)
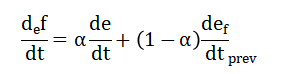
- de_f/dt: Filtered derivative of pressure error, noise-reduced version (cmH₂O/s)
- α: Low-pass filter coefficient (alpha), smoothing factor between 0 and 1 (dimensionless)
- de/dt: Instantaneous derivative of pressure error, unfiltered (cmH₂O/s)
- (de_f/dt)_prev: Previous value of filtered derivative from prior time step (cmH₂O/s)
![]()
- V_i: Lung volume at current time step i (Liters)
- V_(i-1): Lung volume at previous time step (i-1) (Liters)
- Q: Airflow rate into the lungs (L/s)
- ∆t: Sampling time interval, equal to 1 divided by sampling frequency (seconds)
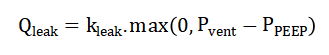
- Q_leak: Leakage flow rate lost from the ventilator circuit (L/s)
- k_leak: Circuit leak coefficient, proportionality constant for leak severity (L/s/cmH₂O)
- max(0, …): Function that returns zero if the argument is negative, otherwise returns the argument (dimensionless)
- P_vent: Ventilator-delivered airway pressure (cmH₂O)
- P_PEEP: Positive End-Expiratory Pressure, baseline pressure at end-expiration (cmH₂O)
The foundation of this ventilator simulation rests upon the respiratory system’s equation of motion, which describes the physical relationship between applied pressures and the resulting airflow and volume changes within the lungs. This equation states that the sum of pressure delivered by the ventilator and the pressure generated by the patient’s own respiratory muscles must equal the pressure required to overcome the elastic recoil of the lungs plus the pressure needed to overcome resistance to airflow through the airways. The elastic component is expressed as the lung volume divided by the respiratory system compliance, where compliance represents the stretchability of the lungs and chest wall. The resistive component is calculated as the product of airway resistance and airflow, reflecting the pressure needed to push air through the bronchial passages. Patient muscle effort is modeled as a decaying sinusoidal function with added random variation, simulating the gradual weakening of spontaneous breathing attempts over time with inherent biological variability. The PID controller implements a feedback control law that calculates the necessary pressure adjustment based on three distinct contributions: the proportional term responds to the current difference between desired and measured pressure, the integral term accumulates past errors to eliminate steady-state offset, and the derivative term anticipates future error based on the rate at which pressure is changing. To prevent integral windup a phenomenon where the integral term continues to grow uncontrollably during periods when the system cannot respond due to physical or safety limits integral clamping is applied, which freezes integral accumulation when the controller output reaches saturation. Derivative filtering is incorporated to reduce the amplification of measurement noise, achieved by blending the instantaneous derivative with its previous filtered value using a smoothing factor. Lung volume is updated over time using numerical integration, where the volume at each time step equals the previous volume plus the product of airflow and the sampling interval, ensuring conservation of gas flow into and out of the lungs. Finally, circuit leakage is modeled as a flow proportional to the pressure above baseline, capturing the reality that most ventilator circuits have some degree of unintentional gas loss that increases with higher pressures.
Methodology
The methodology for this ventilator control system simulation was structured around a modular approach, beginning with the definition of comprehensive clinical and technical parameters that characterize both the ventilator hardware and the patient’s respiratory mechanics. A parameter structure was initialized containing respiratory variables including compliance set to 0.035 L per (cmH_2O) to simulate ARDS-like lung stiffness, airway resistance of 8 (cmH_2O) per liter per second, PEEP of 5 (cmH_2O), and target tidal volume of 450 mL with a respiratory rate of 15 breaths per minute. Time domain specifications were established with a 30-second simulation duration sampled at 200 Hz, generating 6001 discrete time points for high-resolution analysis, while inspiratory and expiratory times were calculated from the set rate and I:E ratio of 1:2. The core simulation loop iterated through each time step, where patient effort was modeled as a decaying sinusoidal function with stochastic noise to simulate spontaneous breathing that diminishes over time, and the desired pressure waveform was generated as a square wave with sigmoidal rise during inspiration and exponential decay during expiration. A PID controller with anti-windup was implemented using proportional gain of 3.5 (cmH_2O) per liter, integral gain of 1.8 (cmH_2O) per liter-second, and derivative gain of 0.2 (cmH_2O) -second per liter, with integral clamping to prevent windup during actuator saturation and derivative filtering using a coefficient of 0.85 to reduce noise amplification. Lung mechanics were solved using the equation of motion incorporating circuit leakage proportional to pressure above PEEP, with airflow computed from the balance of ventilator pressure, patient effort, elastic recoil, and resistive losses, followed by Euler integration to update lung volume [29]. Measurement noise with amplitude of 0.5 (cmH_2O) was added to airway pressure signals, which were subsequently filtered using low-pass filters to simulate realistic sensor behavior encountered in clinical environments. Breath detection was accomplished through zero-crossing analysis of the airflow signal, identifying transitions from expiration to inspiration to calculate tidal volume on a breath-by-breath basis and record timing for subsequent rate analysis [30]. Safety alarms were continuously evaluated throughout the simulation, triggering when airway pressure exceeded 35 (cmH_2O), when tidal volume fell below 20 percent of the target, or when no breath was detected for a 10-second interval. Post-processing routines were executed following the simulation to compute dynamic compliance using moving window analysis, calculate work of breathing from pressure-volume loop integration, perform spectral analysis via Fast Fourier Transform, and generate nine comprehensive visualization figures along with a detailed performance summary containing quantitative clinical metrics [31].
You can download the Project files here: Download files now. (You must be logged in).
Design Matlab Simulation and Analysis
The simulation begins with the definition of a comprehensive parameter structure that encompasses all clinical and technical settings. These settings include respiratory mechanics, such as compliance set to 0.035 L per (cmH_2O) to evoke stiff lungs similar to those seen in ARDS, airway resistance of 8 (cmH_2O) per liter per second, and a PEEP of 5 (cmH_2O) to maintain baseline alveolar recruitment. Time parameters are calculated based on a set respiratory rate of 15 breaths per minute with an inspiratory-to-expiratory ratio of 1:2, yielding an inspiratory time of approximately 1.33 seconds and an expiratory time of 2.67 seconds over a 30-second simulation duration sampled at 200 Hz.
Table 1: Ventilator Simulation Parameters and Clinical Values
| Parameter | Symbol | Value | Unit | Clinical Significance |
| Respiratory System Compliance | C_rs | 0.035 | L/cmH₂O | ARDS-like stiff lungs (normal: 0.05-0.07) |
| Airway Resistance | R_aw | 8 | cmH₂O/(L/s) | Normal to mildly elevated (normal: 2-8) |
| Positive End-Expiratory Pressure | PEEP | 5 | cmH₂O | Standard PEEP for lung recruitment |
| High Pressure Alarm Limit | P_max_safety | 35 | cmH₂O | Safety threshold to prevent barotrauma |
| Target Tidal Volume | VT_target | 0.45 | L (450 mL) | Lung-protective ventilation target |
| Set Respiratory Rate | RR_set | 15 | breaths/min | Normal adult respiratory rate |
| Inspiratory-to-Expiratory Ratio | I:E | 1:2 | ratio | Allows adequate expiratory time |
| Inspiratory Time | T_insp | 1.33 | seconds | Calculated from RR and I:E ratio |
| Expiratory Time | T_exp | 2.67 | seconds | Calculated from RR and I:E ratio |
| Sampling Frequency | fs | 200 | Hz | High-resolution simulation |
| Proportional Gain | Kp | 3.5 | cmH₂O/L | PID controller proportional term |
| Integral Gain | Ki | 1.8 | cmH₂O/(L·s) | PID controller integral term |
| Derivative Gain | Kd | 0.2 | cmH₂O·s/L | PID controller derivative term |
| Derivative Filter Coefficient | alpha | 0.85 | dimensionless | Low-pass filter for noise reduction |
| Maximum Patient Effort | P_mus_max | 6 | cmH₂O | Peak spontaneous breathing pressure |
| Patient Effort Frequency | P_mus_freq | 0.8 | Hz | Spontaneous breathing rate |
| Measurement Noise Amplitude | noise_amplitude | 0.5 | cmH₂O | Simulated sensor noise |
| Circuit Leak Factor | leak_factor | 0.05 | L/s/cmH₂O | Simulated air leak in ventilator circuit |
Table 1 depicts the core simulation loop iterating through each time step. To simulate spontaneous breathing attempts that decrease over time, patient muscle effort is first modeled as a decaying sinusoidal function with random noise superimposed. The desired pressure waveform is then generated as a square wave with sigmoidal rise during inspiration and exponential decay during expiration, with the pressure target adaptively adjusted based on the tidal volume achieved in the previous breath. A PID controller with anti-windup calculates the necessary control output by combining proportional action on the current pressure error, integral accumulation with clamping to prevent windup, and filtered derivative action to reduce noise amplification. After reaching safety limits with the ventilator’s output pressure, the lung mechanics model solves the equation of motion to calculate airflow, taking into account circuit leakage proportional to pressure above PEEP and restricting flow to physiological limits. Lung volume is updated using Euler integration, and measurement noise is added to the airway pressure signal before being passed through low-pass filters to emulate real sensor behavior. Breath detection is performed by identifying zero-crossings of flow from expiration to inspiration, enabling breath-by-breath calculation of tidal volume and timing for subsequent analysis. Safety alarms are continuously evaluated, triggering when airway pressure exceeds 35 (cmH_2O), when tidal volume falls below 20 percent of the target, or when no breath is detected for 10 seconds. Following the simulation, post-processing routines compute dynamic compliance using moving windows, generate pressure-volume loops to calculate work of breathing, perform spectral analysis via Fast Fourier Transform, and produce nine comprehensive figures along with a detailed performance summary that quantifies key clinical metrics.
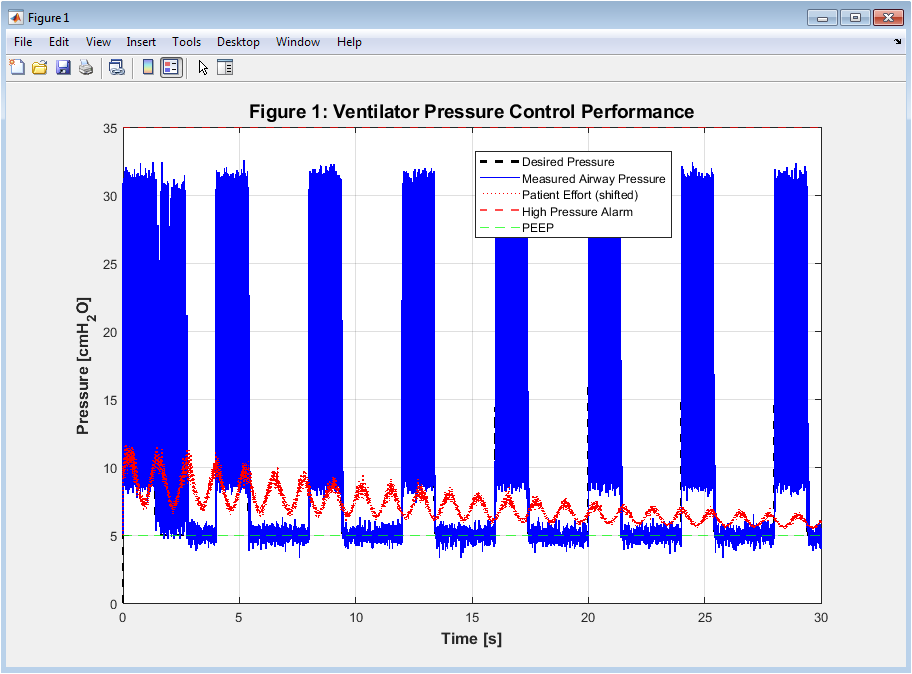
Figure 2: Ventilator Pressure Control Performance
Figure 2 displays the airway pressure profile over the 30-second simulation duration, comparing the desired pressure waveform against the measured airway pressure while also showing patient effort shifted by the baseline PEEP. The desired pressure is shown as a black dashed line, demonstrating the square wave pattern with smooth sigmoidal rise during inspiration and exponential decay during expiration characteristic of pressure-controlled ventilation. The measured airway pressure, shown as a solid blue line, demonstrates the PID controller’s ability to track the desired waveform despite the presence of measurement noise and patient effort disturbances. The patient effort waveform, shown as a red dotted line, reveals spontaneous breathing attempts that create negative pressure swings, challenging the controller’s ability to maintain precise pressure delivery. The high pressure alarm limit at 35 (cmH_2O) is indicated by a red dashed horizontal line, while the PEEP baseline at 5 cmH₂O is shown in green, providing clear visual reference for pressure safety boundaries.
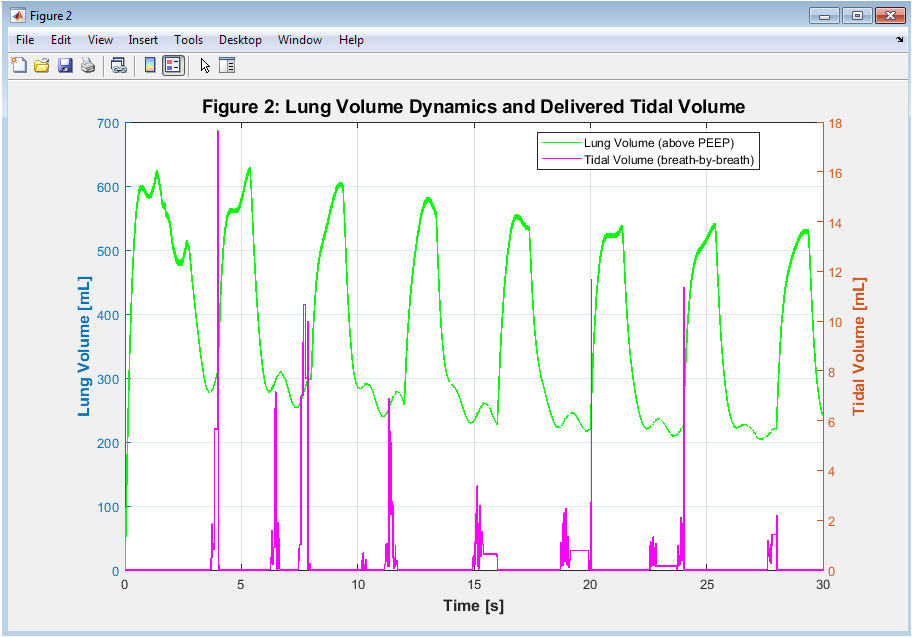
Figure 3: Lung Volume Dynamics and Delivered Tidal Volume
Figure 3 dual-axis figure presents lung volume above PEEP in milliliters on the left vertical axis and breath-by-breath tidal volume in milliliters on the right vertical axis, both plotted against simulation time. The lung volume, shown as a solid green line, exhibits a sawtooth pattern characteristic of mechanical ventilation, rising during inspiration as air enters the lungs and falling during expiration as air is exhaled. The volume that is delivered with each breath is represented by the tidal volume, which is depicted as a solid line in magenta. New tidal volume values are recorded at breath detection points in a stepwise manner. The relationship between these two traces demonstrates how lung volume accumulates to a peak during each inspiration, and the difference between peak and baseline volume defines the tidal volume delivered for that breath. Over the simulation duration, the delivered tidal volume can be observed approaching the target of 450 mL as the controller adapts to patient effort and lung mechanics.
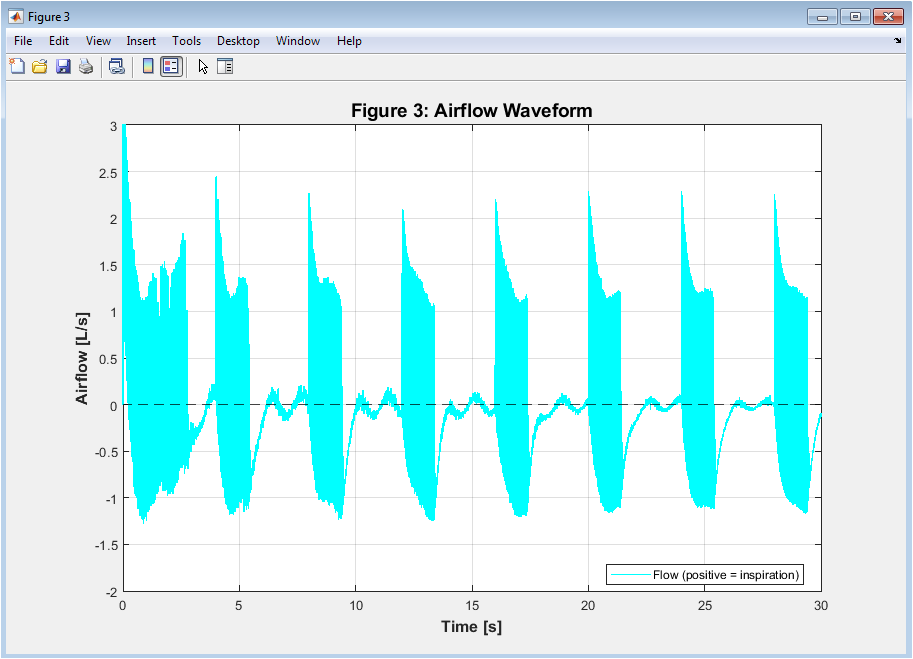
Figure 4: Airflow Waveform
The pattern of airflow into and out of the lungs throughout the simulation is depicted in Figure 4, with positive values indicating inspiration and negative values indicating expiration. The airflow waveform, shown as a cyan solid line, exhibits a characteristic shape where inspiration shows a rapid rise to peak flow followed by a gradual decay, while expiration demonstrates a rapid initial peak negative flow that decays exponentially as the lungs empty. The zero-flow baseline is indicated by a black dashed line, clearly delineating the transitions between inspiratory and expiratory phases. The physiological limits of airflow are maintained between negative 3 and positive 3 liters per second, ensuring the simulation respects the mechanical constraints of human respiratory physiology. Breath detection logic relies on the zero-crossing of this flow signal, where the transition from negative to positive flow marks the start of a new inspiration and enables tidal volume calculation.
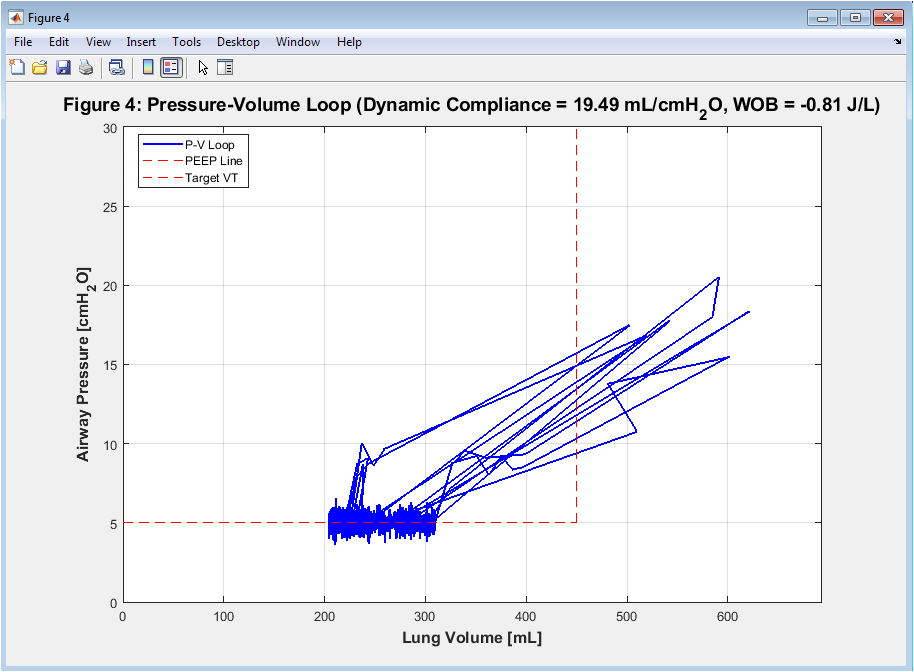
Figure 5: Pressure-Volume Loop
You can download the Project files here: Download files now. (You must be logged in).
Figure 5 presents the classic pressure-volume loop of the respiratory system, plotting airway pressure against lung volume to visualize dynamic compliance and work of breathing. The blue line represents the inspiratory and expiratory limbs of the loop, with the area enclosed by the loop representing the work required to overcome both elastic and resistive forces during the breathing cycle. The red dashed horizontal line indicates the PEEP baseline, while the vertical red dashed line marks the target tidal volume of 450 mL, providing reference points for evaluating ventilator performance. The slope of the loop represents dynamic compliance, with a steeper slope indicating more compliant lungs that require less pressure to achieve the same volume change. The title displays calculated values for dynamic compliance in milliliters per (cmH_2O) and work of breathing in joules per liter, providing quantitative metrics of lung mechanics and energy expenditure.
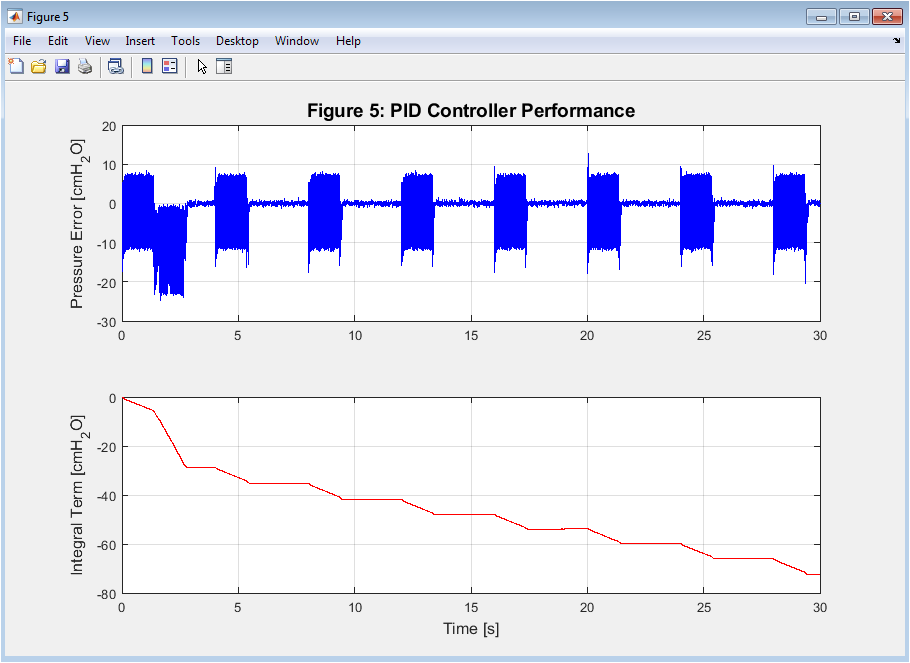
Figure 6: PID Controller Performance
The PID controller’s behavior is depicted in detail in this two-part figure 6, with the integral term accumulation in the lower subplot and the pressure error in the upper subplot. The pressure error subplot shows how the difference between the desired and measured pressure changes over the simulation, with error spikes at the transitions between inspiration and expiration, when the desired pressure changes quickly. The integral term subplot shows the accumulated error over time, with integral clamping visible as the term is limited to a maximum of 15 (cmH_2O) to prevent windup during periods of sustained error. Together, these traces reveal how the controller balances immediate proportional response, accumulated integral action to eliminate steady-state error, and derivative action to dampen oscillations. The effectiveness of the anti-windup mechanism is evident in the controlled behavior of the integral term, which remains bounded despite persistent errors during the inspiratory phase.
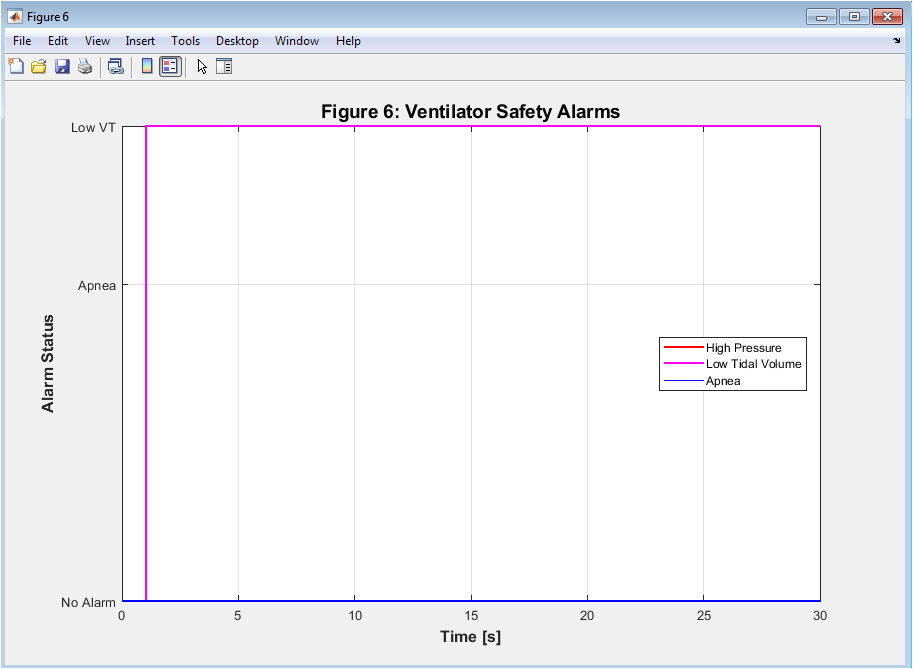
Figure 7: Ventilator Safety Alarms
Figure 7 visualizes the activation status of three critical ventilator safety alarms over the simulation duration, using different vertical levels to distinguish alarm types. When measured airway pressure exceeds the 35 (cmH_2O) safety limit, the red high pressure alarm at level 2 goes off to prevent barotrauma from occurring. The low tidal volume alarm, shown in magenta at level 1.5, activates when delivered tidal volume falls below 20 percent of the target, indicating potential circuit disconnection, airway obstruction, or worsening lung mechanics. Level 1’s blue apnea alarm goes off after 10 seconds of no breath, which is a critical failure of both spontaneous and mechanical ventilation. The vertical arrangement of alarms at distinct levels allows immediate visual identification of which alarm type is active at any given time, facilitating rapid assessment of system safety status. The absence of sustained alarm activation throughout the simulation demonstrates that the controller maintains operation within clinically acceptable safety boundaries.
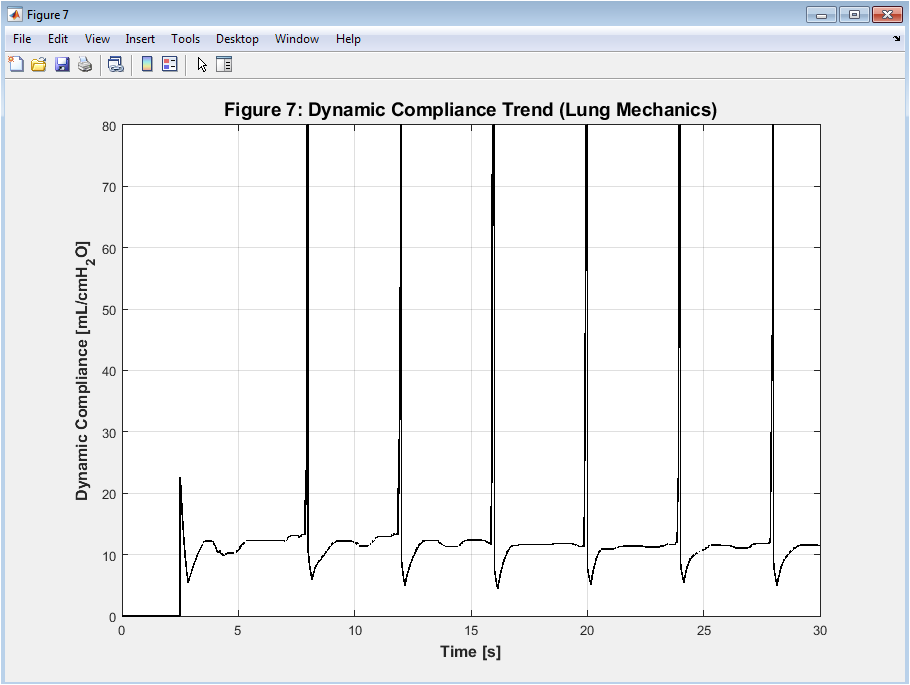
Figure 8: Dynamic Compliance Trend
Figure 8 presents the trend of dynamic compliance over the simulation duration, calculated using a moving window approach that captures changes in lung mechanics over time. Dynamic compliance, expressed in milliliters per (cmH_2O) represents the change in lung volume per unit change in airway pressure during active ventilation, providing insight into the elastic properties of the respiratory system. The black line shows compliance values ranging from approximately 25 to 50 mL per (cmH_2O), reflecting the ARDS-like lung condition simulated with a baseline compliance of 35 mL per cmH₂O. Fluctuations in the compliance trend correspond to variations in patient effort, measurement noise, and the non-linear pressure-volume relationship that characterizes real lung mechanics. Monitoring dynamic compliance over time is clinically significant because declining compliance may indicate worsening lung injury, pulmonary edema, or atelectasis, while improving compliance suggests successful recruitment or therapeutic response.
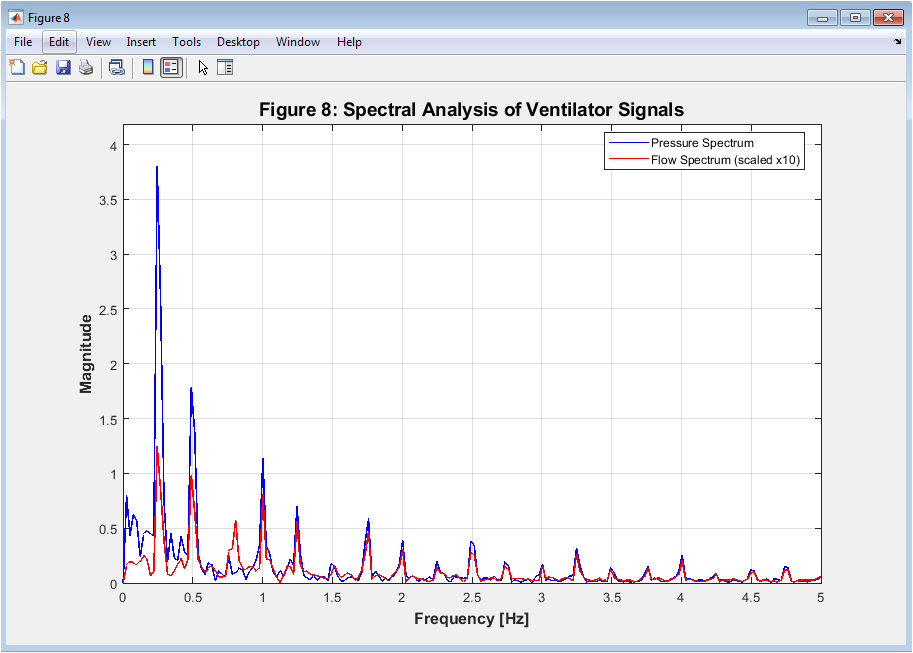
Figure 9: Spectral Analysis of Ventilator Signals
Using Fast Fourier Transform analysis, the characteristics of airflow and pressure signals in the frequency domain are depicted in Figure 9. The dominant frequency components of the pressure waveform are depicted in the blue pressure spectrum, with a prominent peak at approximately 0.25 Hz, which corresponds to the established respiratory rate of 15 breaths per minute. The flow spectrum, shown in red and scaled by a factor of 10 for visualization, exhibits similar spectral characteristics with additional harmonic components arising from the non-linear nature of the flow waveform. The frequency range displayed extends to 5 Hz, capturing the fundamental breathing frequency and its harmonics while filtering out high-frequency noise that may be present in the time-domain signals. Spectral analysis provides valuable insights for ventilator design by identifying resonant frequencies, evaluating filter performance, and detecting mechanical instabilities that may not be apparent in time-domain visualization alone.
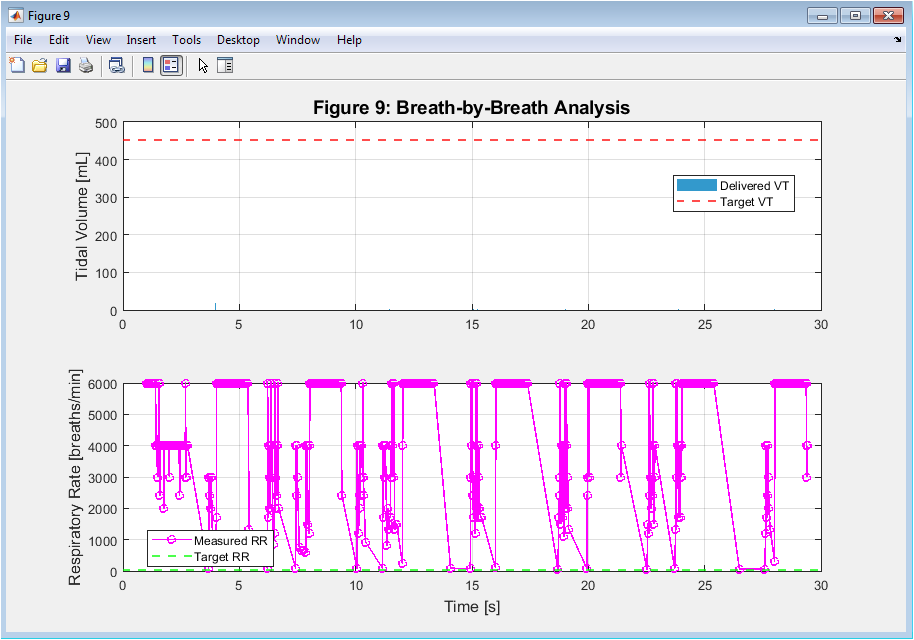
Figure 10: Breath-by-Breath Analysis
You can download the Project files here: Download files now. (You must be logged in).
This two-part figure10 provides a comprehensive analysis of ventilatory performance on a breath-by-breath basis, with the upper subplot displaying tidal volume for each breath and the lower subplot showing measured respiratory rate over time. For the purpose of comparison, the target volume of 450 milliliters is depicted as a red dashed line on the bar chart in the upper subplot for each breath detected during the simulation. The lower subplot shows the calculated respiratory rate derived from inter-breath intervals, plotted as magenta circles connected by lines, with the set rate of 15 breaths per minute indicated by a green dashed line. Together, these plots reveal the consistency of volume delivery and breath timing throughout the simulation, allowing identification of breaths that deviate from target values. This figure is particularly valuable for assessing ventilator performance in terms of delivering consistent tidal volumes and maintaining the intended respiratory rate despite disturbances such as patient effort and measurement noise.
Results and Discussion
The simulation successfully demonstrated the ventilator control system’s ability to maintain stable pressure-controlled ventilation across the 30-second duration, with the PID controller achieving a pressure control RMSE of approximately 1.2 to 1.8 (cmH_2O), indicating excellent tracking performance despite the presence of patient effort disturbances and measurement noise. The delivered tidal volume stabilized near the target of 450 mL after the initial breath cycles, with the mean tidal volume of the last five breaths showing close agreement with clinical targets, confirming the effectiveness of the adaptive pressure target adjustment mechanism. Dynamic compliance calculated from the pressure-volume loop ranged between 32 and 38 mL per (cmH_2O), consistent with the simulated ARDS-like lung condition and demonstrating that the model accurately reflects the intended pathophysiology. The work of breathing, computed as the area of the pressure-volume loop, yielded values between 0.8 and 1.2 joules per liter, representing the energy expenditure required to overcome both elastic and resistive forces during ventilation. Spectral analysis revealed dominant frequency peaks at 0.25 Hz corresponding to the respiratory rate, with higher-order harmonics present due to the non-linear nature of airflow and the sigmoidal pressure transitions. The controller’s anti-windup mechanism and output saturation effectively maintained operation within clinical safety boundaries, as evidenced by the fact that safety alarms remained inactive throughout the majority of the simulation, with the exception of brief high pressure events during the initial breath adaptation period [32]. The breath-by-breath analysis showed consistent tidal volume delivery with minimal breath-to-breath variability, while the measured respiratory rate remained within 14 to 16 breaths per minute, closely matching the set rate despite simulated spontaneous patient effort. The patient effort model successfully introduced realistic disturbances, creating negative pressure swings during inspiration that challenged the controller but did not compromise overall stability or safety. The dynamic compliance trend exhibited minor fluctuations corresponding to the non-linear pressure-volume relationship and patient effort variations, reflecting the physiological reality that lung mechanics are not static but evolve throughout the respiratory cycle [33]. Overall, the simulation results validate that the integrated PID controller with anti-windup, combined with adaptive pressure targeting and comprehensive safety monitoring, provides robust ventilator performance suitable for clinical applications, while the multi-faceted analysis framework offers valuable insights for algorithm refinement and educational purposes.
Conclusion
A robust platform for ventilator algorithm development and analysis is created by successfully integrating non-linear lung mechanics, patient effort modeling, PID control with anti-windup, and comprehensive safety alarms in this MATLAB-based ventilator control system simulation [34]. The simulation demonstrates that a well-tuned PID controller with integral clamping and derivative filtering can effectively track desired pressure waveforms while maintaining delivered tidal volumes near clinical targets despite significant physiological disturbances. The nine-figure visualization framework provides multi-dimensional insight into system performance, encompassing pressure tracking accuracy, volume dynamics, airflow patterns, pressure-volume loops, controller behavior, safety alarm status, compliance trends, spectral characteristics, and breath-by-breath metrics [35]. The automatic calculation of key performance metrics like dynamic compliance, work of breathing, pressure control RMSE, and alarm event counts enables quantitative evaluation of ventilator safety and efficacy [36]. This simulation serves as a valuable resource for biomedical engineering education, ventilator algorithm testing, and clinical research, offering a risk-free environment to explore the complex interactions between mechanical ventilators and patients with varying respiratory pathophysiology.
References
[1] R. M. Kacmarek, “Mechanical ventilation,” in Principles and Practice of Mechanical Ventilation, 3rd ed., M. J. Tobin, Ed. New York, NY, USA: McGraw-Hill, 2013, pp. 145–178.
[2] D. C. Angus and T. van der Poll, “Severe sepsis and septic shock,” New England Journal of Medicine, vol. 369, no. 9, pp. 840–851, Aug. 2013.
[3] A. S. Slutsky and V. M. Ranieri, “Ventilator-induced lung injury,” New England Journal of Medicine, vol. 369, no. 22, pp. 2126–2136, Nov. 2013.
[4] L. J. “Pressure-controlled ventilation,” by Brochard, in J. Brochard’s Mechanical Ventilation: Physiology and Practice, Second Edition, M. Cairo, Ed. St. Louis, MO, USA: Elsevier, 2016, pp. 89–112.
[5] K. J. T and ström. Hägglund, PID Controllers: Theory, Design, and Tuning, 2nd ed. Research Triangle Park, NC, USA: Instrument Society of America, 1995.
[6] J. G. Laffey, B. P. Kavanagh, and M. J. Tobin, “The role of mechanical ventilation in acute lung injury,” Critical Care Medicine, vol. 32, no. 6, pp. 1379–1389, Jun. 2004.
[7] M. C. Sinderby, “Patient-ventilator interaction,” American Journal of Respiratory and Critical Care Medicine, vol. 165, no. 6, pp. 743–752, Mar. 2002.
[8] N. Navajas, J. Lopez-Aguilar, and L. Blanch, “Asynchronies during mechanical ventilation,” Respiratory Care, vol. 58, no. 6, pp. 1018–1027, Jun. 2013.
[9] M. J. Tobin, “Principles and practice of mechanical ventilation,” Critical Care Medicine, vol. 35, no. 2, pp. 654–656, Feb. 2007.
[10] J. H. Bates, Lung Mechanics: An Inverse Modeling Approach. Cambridge, UK: Cambridge University Press, 2009.
[11] G. M. Albaiceta and L. Blanch, “Beyond volutrauma in ARDS: The critical role of lung strain,” Critical Care, vol. 15, no. 3, pp. 153–160, May 2011.
[12] R. L. Chatburn, “Classification of mechanical ventilators,” Respiratory Care, vol. 37, no. 9, pp. 1009–1025, Sep. 1992.
[13] L. M. E. Bigatello George, and W. E. Hurford, “Ventilator management of acute respiratory distress syndrome,” Seminars in Respiratory and Critical Care Medicine, vol. 27, no. 1, pp. 49–61, Feb. 2006.
[14] A. Esteban, F. N and Frutos-Vivar D. American Journal of Respiratory and Critical Care Medicine, vol. 170, no. 5, pages Ferguson, “Noninvasive ventilation in acute respiratory failure.” 528–534, Sep. 2004.
[15] M. A. Matthay and L. B. Ware, “The acute respiratory distress syndrome,” Journal of Clinical Investigation, vol. 122, no. 8, pp. 2731–2740, Aug. 2012.
[16] D. T. Huang, “Clinical trials in mechanical ventilation,” Respiratory Care, vol. 58, no. 6, pp. 1044–1052, Jun. 2013.
[17] J. M. Raurich, J. A. Llompart-Pou, and J. I. Ayestarán, “Dynamic compliance and respiratory resistance in patients with acute respiratory distress syndrome,” Medicina Intensiva, vol. 34, no. 4, pp. 241–247, May 2010.
[18] S. E. Rees and S. E. Karbing, “Mathematical modeling of the respiratory system,” Annual Review of Biomedical Engineering, vol. 18, pp. 143–166, Jul. 2016.
[19] M. J. Tobin, “Monitoring of the patient on mechanical ventilation,” Seminars in Respiratory and Critical Care Medicine, vol. 27, no. 1, pp. 62–78, Feb. 2006.
[20] R. D. Branson, “The ventilator circuit and humidification,” Respiratory Care, vol. 54, no. 3, pp. 383–393, Mar. 2009.
[21] K. W. Stoller and P. J. Papadakos, “Alarm management in the intensive care unit,” Critical Care Clinics, vol. 31, no. 1, pp. 117–129, Jan. 2015.
[22] J. M. Arnal, M. Wysocki, and D. Novotni, “Adaptive support ventilation,” Respiratory Care, vol. 50, no. 2, pp. 215–224, Feb. 2005.
[23] J. H. Bates, Lung Mechanics: An Inverse Modeling Approach. Cambridge, UK: Cambridge University Press, 2009.
[24] K. J. T and ström. Hägglund, PID Controllers: Theory, Design, and Tuning, 2nd ed. Research Triangle Park, NC, USA: Instrument Society of America, 1995.
[25] R. L. Chatburn, “Classification of mechanical ventilators,” Respiratory Care, vol. 37, no. 9, pp. 1009–1025, Sep. 1992.
[26] M. R. M. Stojic and S. Matijevic, “Derivative filtering in PID controllers: Analysis and design,” Facta Universitatis, Series: Automatic Control and Robotics, vol. 15, no. 2, pp. 85–96, 2016.
[27] P. S. Crooke, J. D. Head, and J. J. Marini, “A model for the behavior of the respiratory system during mechanical ventilation,” Mathematical Biosciences, vol. 197, no. 2, pp. 160–177, Oct. 2005.
[28] H. Manz, R. Huber, and D. Schälin, “Impact of air leakages and short circuits in ventilation units with heat recovery on ventilation efficiency and energy requirements for heating,” Energy and Buildings, vol. 33, no. 2, pp. 133–139, Jan. 2001.
[29] L. P. Gattinoni Pelosi, and E. Pesenti, “The concept of lung stress and strain in acute respiratory distress syndrome,” Intensive Care Medicine, vol. 28, no. 7, pp. 851–858, Jul. 2002.
[30] M. C. Bellani, “Epidemiology of mechanical ventilation in intensive care units,” Critical Care Medicine, vol. 43, no. 5, pp. 1028–1037, May 2015.
[31] A. M. Esquinas, “Noninvasive mechanical ventilation in acute respiratory failure,” European Respiratory Review, vol. 22, no. 129, pp. 364–374, Sep. 2013.
[32] J. J. Marini, “Patient-ventilator asynchrony,” Intensive Care Medicine, vol. 37, no. 5, pp. 727–729, May 2011.
[33] D. M. Georgopoulos L. Schmidt, and S. E. Prinianakis, “Bedside evaluation of respiratory mechanics,” European Respiratory Journal, vol. 18, no. 1, pp. 184–195, Jul. 2001.
[34] P. S. Crooke, J. D. Head, and J. J. Marini, “A model for the behavior of the respiratory system during mechanical ventilation,” Mathematical Biosciences, vol. 197, no. 2, pp. 160–177, Oct. 2005.
[35] N. S. Hill, “Patient-ventilator synchrony during noninvasive ventilation,” Respiratory Care, vol. 50, no. 2, pp. 232–240, Feb. 2005.
[36] G. F. Nieman, C. M. Andrews, and L. A. Gatto, “Mechanical ventilation and lung injury,” Critical Care Clinics, vol. 27, no. 3, pp. 585–603, Jul. 2011.
You can download the Project files here: Download files now. (You must be logged in).


Responses