

Machine Learning Enhanced Risk Assessment Tool for Predictive Risk Analysis and Decision Making Using Matlab

Author : Waqas Javaid
Abstract
Risk assessment plays a critical role in identifying, evaluating, and mitigating potential threats in complex engineering, industrial, and organizational systems. This study presents an advanced risk assessment framework developed in MATLAB that integrates probabilistic modeling, machine learning, and data analytics techniques for comprehensive risk evaluation [1]. The proposed system generates and analyzes risk scenarios based on probability, impact, and detection parameters to calculate risk scores and Risk Priority Numbers (RPNs) [2]. A Monte Carlo simulation approach is employed to model uncertainty and estimate the distribution of total risk exposure. Furthermore, a decision tree classifier is utilized to categorize risks into different severity levels, enabling intelligent risk prediction and classification [3]. Risk clustering analysis is performed using the K-means algorithm to identify patterns and group similar risk events. In addition, a fuzzy-inspired risk surface model is developed to visualize the relationship between probability, impact, and overall risk severity. Experimental results demonstrate the effectiveness of the proposed framework in supporting data-driven decision-making and prioritizing critical risks [4]. The developed tool provides a scalable and efficient solution for modern risk management applications across various domains. The integration of simulation, machine learning, and visualization techniques enhances the accuracy, interpretability, and reliability of risk assessment processes.
Introduction
Risk assessment is a fundamental process in modern engineering, business, healthcare, finance, and industrial management, where uncertainty and potential hazards can significantly impact operational performance and decision-making. The increasing complexity of technological systems has created a growing need for intelligent methods capable of identifying, analyzing, and prioritizing risks effectively.
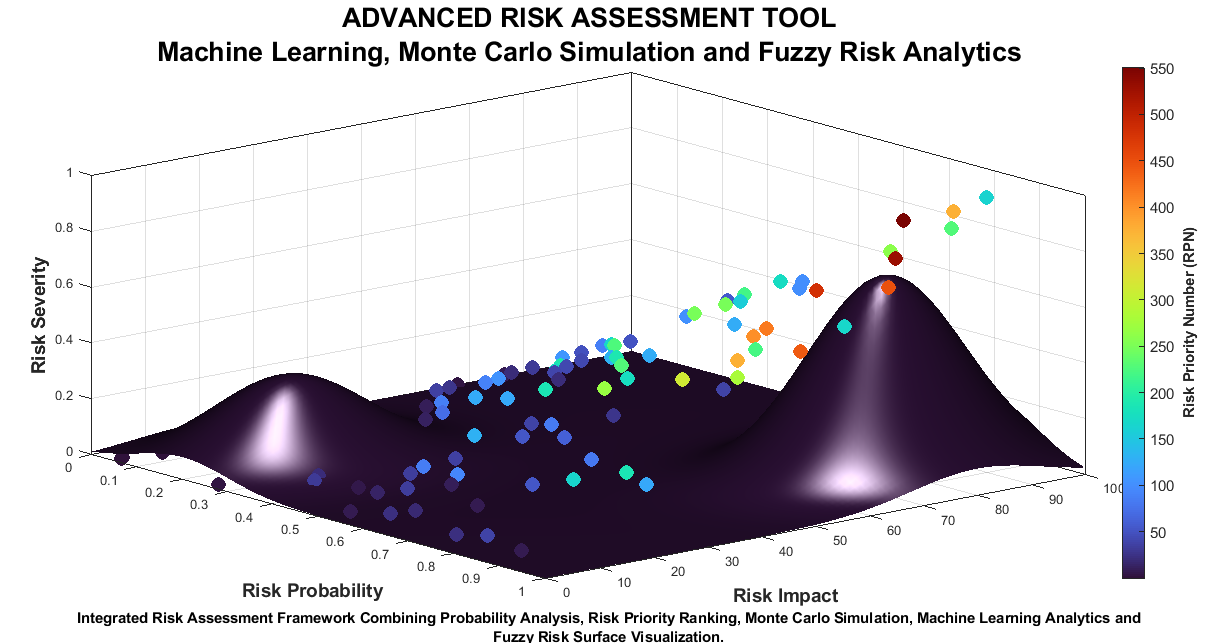
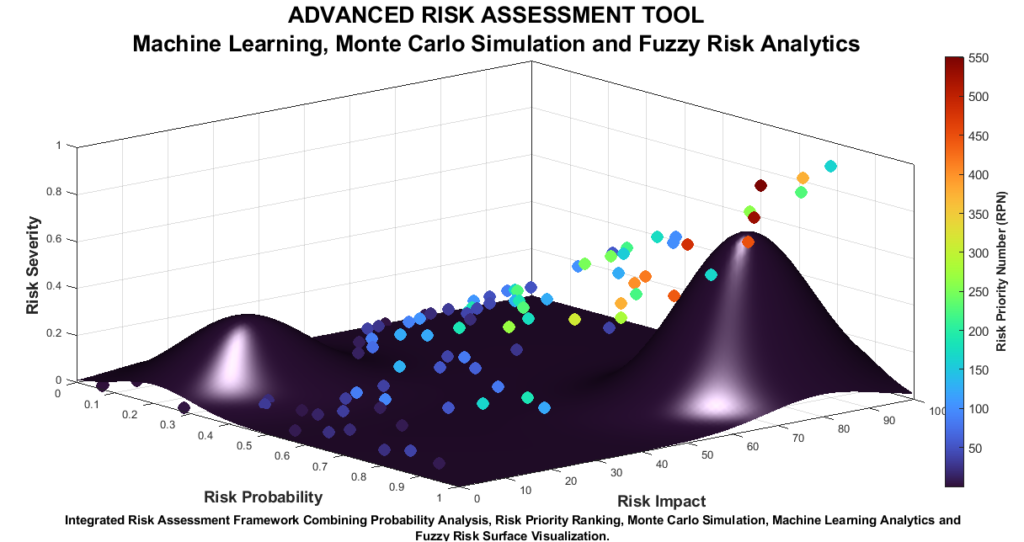
Figure 1: Risk Assessment Tool showing risk probability, impact, risk severity, Risk Priority Number (RPN), Monte Carlo-based uncertainty analysis, and fuzzy risk surface modeling within a unified decision-support framework.
Figure 1 represents the risk assessment approaches often rely on expert judgment and qualitative evaluations, which may introduce subjectivity and limit the accuracy of risk predictions. Consequently, advanced computational techniques have emerged to enhance the reliability and efficiency of risk management practices. Recent developments in machine learning, probabilistic modeling, and data analytics have enabled organizations to perform more comprehensive and data-driven risk assessments [5]. Machine learning algorithms can identify hidden patterns within risk-related data and support automated classification of risk levels, thereby improving decision-making processes. Similarly, Monte Carlo simulation has become a widely adopted technique for modeling uncertainty and estimating the likelihood of various risk outcomes under different scenarios [6]. These methods provide valuable insights into the potential consequences of risk events and facilitate proactive mitigation strategies. In addition to predictive analytics, risk prioritization techniques such as the Risk Priority Number (RPN) are frequently used to rank risks based on their probability, impact, and detectability [7]. Visualization tools, including heat maps and risk surfaces, further assist stakeholders in understanding complex risk relationships and identifying critical areas requiring immediate attention. Clustering methods can also be employed to group similar risks, enabling more effective resource allocation and strategic planning [8]. This study presents an advanced risk assessment framework developed in MATLAB that integrates machine learning classification, Monte Carlo simulation, risk prioritization, clustering analysis, and fuzzy-inspired risk surface modeling within a unified environment [9]. The proposed system evaluates risks based on probability, impact, and detection parameters while generating meaningful visualizations to support risk interpretation. The framework aims to improve risk prediction accuracy, enhance decision support capabilities, and provide a scalable solution for diverse risk management applications [10]. The results demonstrate the effectiveness of combining artificial intelligence and statistical modeling techniques to create a robust and intelligent risk assessment tool for modern organizational environments.
1.1 Background of Risk Assessment
Risk assessment is an essential process used to identify, evaluate, and manage potential threats that may affect the performance and reliability of systems. Organizations across engineering, healthcare, finance, and manufacturing sectors rely on risk assessment to minimize losses and improve operational safety. Effective risk management enables decision-makers to anticipate uncertainties and develop appropriate mitigation strategies [11]. As systems become increasingly complex, the demand for advanced risk assessment methodologies continues to grow.
1.2 Importance of Risk Management
Modern organizations operate in environments characterized by uncertainty and rapidly changing conditions. Risks arising from technical failures, human errors, financial fluctuations, and environmental factors can significantly impact organizational objectives [12]. Therefore, risk management has become a critical component of strategic planning and resource allocation. Accurate risk assessment helps organizations prioritize critical issues and improve overall resilience.
1.3 Limitations of Traditional Methods
Traditional risk assessment approaches often depend on expert judgment, checklists, and qualitative evaluations. While these methods provide valuable insights, they may introduce subjectivity and inconsistency into the assessment process. Furthermore, traditional techniques may struggle to handle large datasets and complex interactions among risk factors [13]. These limitations highlight the need for more intelligent and data-driven risk analysis methods.
1.4 Role of Data Analytics
Advancements in data analytics have transformed the way risks are identified and evaluated. Large volumes of operational data can now be processed to uncover hidden patterns and relationships among risk variables [14]. Data-driven approaches provide more objective assessments and improve the accuracy of risk predictions. As a result, analytical tools have become increasingly important in modern risk management frameworks.
1.5 Machine Learning in Risk Assessment
Machine learning techniques offer powerful capabilities for analyzing complex datasets and predicting future outcomes. By learning from historical data, machine learning models can automatically classify risks and identify critical factors influencing risk levels [15]. These techniques reduce human intervention and improve decision-making efficiency. Consequently, machine learning has emerged as a valuable tool for intelligent risk assessment applications.
1.6 Monte Carlo Simulation for Uncertainty Analysis
Monte Carlo simulation is a widely used statistical technique for modeling uncertainty in risk assessment problems. The method generates thousands of random scenarios to estimate the probability distribution of potential outcomes [16]. This approach provides a comprehensive understanding of risk variability and possible consequences. Monte Carlo analysis supports more informed and reliable decision-making under uncertain conditions.
1.7 Risk Priority Number Analysis
Risk Priority Number (RPN) analysis is commonly employed to rank and prioritize risks based on probability, impact, and detection capability. Higher RPN values indicate risks that require immediate attention and mitigation efforts [17]. This quantitative approach enables organizations to allocate resources more effectively and focus on critical issues. RPN analysis remains an important component of many risk management systems.
1.8 Risk Visualization and Clustering
Visual representation of risk information enhances understanding and communication among stakeholders. Techniques such as scatter plots, heat maps, and three-dimensional surfaces help illustrate relationships between risk factors [18]. Additionally, clustering algorithms can group similar risks into meaningful categories. These visualization and clustering methods facilitate efficient analysis and support strategic planning.
1.9 Proposed Risk Assessment Framework
The proposed framework integrates risk scoring, Monte Carlo simulation, machine learning classification, clustering analysis, and risk visualization within a unified MATLAB environment. The system evaluates risks using probability, impact, and detection parameters while providing comprehensive analytical outputs [19]. Multiple visualization techniques are incorporated to improve interpretability and decision support. This integrated approach enhances the effectiveness of risk assessment activities.
1.10 Objectives and Contributions
The primary objective of this study is to develop an advanced and intelligent risk assessment tool capable of supporting data-driven decision-making. The framework combines statistical modeling, artificial intelligence, and visualization techniques to improve risk prediction accuracy and prioritization [20]. The proposed system provides valuable insights into risk behavior and uncertainty. Ultimately, the research contributes a scalable and efficient solution for modern risk management applications across diverse domains.
You can download the Project files here: Download files now. (You must be logged in).
Problem Statement
Risk assessment is a critical component of decision-making in engineering, industrial, financial, and organizational environments. However, many existing risk assessment methods rely heavily on manual evaluation, expert judgment, and qualitative analysis, which can introduce subjectivity and inconsistencies in the assessment process. Traditional approaches often struggle to accurately model uncertainty, prioritize large numbers of risks, and identify hidden relationships among risk factors. Furthermore, the increasing complexity of modern systems generates vast amounts of data that cannot be effectively analyzed using conventional techniques alone. The lack of intelligent prediction mechanisms may lead to delayed identification of critical risks and inefficient resource allocation. In addition, limited visualization capabilities make it difficult for decision-makers to interpret complex risk information and understand potential impacts. There is therefore a need for an integrated and data-driven framework that combines statistical analysis, machine learning, simulation, and visualization techniques. Such a framework should be capable of accurately evaluating risk severity, predicting risk categories, analyzing uncertainty, and prioritizing critical threats. Addressing these challenges can significantly improve risk management effectiveness and support informed decision-making in complex operational environments.
Mathematical Approach
The proposed Advanced Risk Assessment Tool employs probabilistic modeling, risk prioritization, machine learning, and uncertainty analysis to evaluate and classify risks. Let a set of risks [21] be represented by:
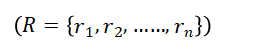
- (R) = Set of identified risks
- (n) = Total number of risk events
- (r) = Individual risk event
Where each risk is characterized by its probability of occurrence, impact severity, and detection capability. The initial risk evaluation is performed by calculating the Risk Score [22], which quantifies the expected consequence associated with each risk event.
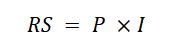
- (RS) = Risk Score
- (P) = Probability of occurrence of a risk event
- (I) = Impact or severity of the risk event
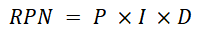
Where the risk score is determined as the product of the probability of occurrence and the impact severity of the risk event. Risks with higher probability and impact values are considered more critical and require immediate attention. To further prioritize identified risks, the Risk Priority Number (RPN) [23] methodology is utilized.
- (RPN) = Risk Priority Number
- (P) = Probability of occurrence of a risk event
- (I) = Impact or severity of the risk event
- (D) = Detection rating of the risk event
This metric combines probability, impact, and detection factors into a single numerical value, enabling systematic ranking of risks. In addition, Monte Carlo simulation is employed to model uncertainty by generating thousands of random risk scenarios and estimating the overall risk distribution. Machine learning classification techniques are then applied to categorize risks into different severity levels based on extracted features. The decision tree classifier learns relationships among risk parameters and predicts the corresponding risk category. Furthermore, clustering analysis groups similar risks to identify hidden patterns within the dataset. A fuzzy-inspired risk surface is also developed to visualize nonlinear interactions between probability and impact variables. The integrated framework provides both quantitative and visual insights into risk behavior, facilitating effective decision-making and resource allocation. By combining statistical analysis, simulation, and artificial intelligence, the proposed approach enhances the accuracy, reliability, and interpretability of risk assessment processes in complex environments.
Methodology
The methodology of the proposed Advanced Risk Assessment Tool consists of a sequence of computational processes designed to identify, evaluate, classify, and prioritize risks using statistical and machine learning techniques. Initially, a risk dataset is generated containing probability, impact, and detection parameters for multiple risk events [24]. These parameters serve as the primary inputs for risk evaluation and analysis. The risk score for each event is calculated by combining probability and impact values, providing a quantitative measure of risk severity. Subsequently, the Risk Priority Number (RPN) is computed by incorporating the detection factor to facilitate risk ranking and prioritization. A risk classification scheme is then applied to categorize risks into low, medium, and high-risk levels based on predefined thresholds. To analyze uncertainty and variability in risk behavior, a Monte Carlo simulation is performed using thousands of randomly generated scenarios. The simulation estimates the distribution of total risk exposure and provides statistical measures such as mean and standard deviation. Next, a machine learning-based decision tree classifier is trained using the generated risk features to predict risk categories automatically. The performance of the classifier is evaluated through testing and accuracy assessment. Furthermore, clustering analysis using the K-means algorithm is conducted to group similar risk events and identify hidden patterns within the dataset. Various visualization techniques, including scatter plots, heat maps, histograms, bar charts, and confusion matrices, are employed to improve the interpretability of results. A fuzzy-inspired risk surface model is also developed to represent the nonlinear relationship between probability, impact, and risk severity in a three-dimensional space [25]. Finally, statistical summaries and graphical outputs are generated to support decision-making and risk mitigation planning. The integrated methodology combines simulation, artificial intelligence, clustering, and visualization techniques to provide a comprehensive and intelligent framework for modern risk assessment applications.
Design Matlab Simulation and Analysis
The proposed Advanced Risk Assessment Tool was implemented and simulated in MATLAB to evaluate the effectiveness of risk analysis, classification, and prioritization techniques.
Table 1: Risk Parameters
| Parameter | Description | Range |
| Probability | Likelihood of risk occurrence | 0-1 |
| Impact | Severity of consequences | 0-100 |
| Detection | Ability to detect risk | 1-10 |
Table 1 represents the simulation begins by generating a dataset consisting of 100 risk events characterized by probability, impact, and detection parameters. Random values are assigned to represent diverse risk scenarios encountered in real-world applications. Risk scores and Risk Priority Numbers (RPNs) are then calculated to quantify the severity and importance of each risk event. Based on the calculated risk scores, risks are categorized into low-, medium-, and high-risk levels. A scatter plot is generated to visualize the relationship between probability and impact, enabling rapid identification of critical risks. Subsequently, a risk heat map is created to illustrate the density and distribution of risks across different probability and impact zones. To analyze uncertainty, a Monte Carlo simulation comprising 10,000 iterations is performed, generating a probability distribution of total risk exposure. Statistical measures including the mean and standard deviation are computed to evaluate overall system risk. A bar chart of the top-ranked Risk Priority Numbers is generated to highlight the most critical risks requiring immediate attention. Machine learning analysis is performed using a decision tree classifier trained on probability, impact, and detection features. The classification performance is evaluated using a confusion matrix and prediction accuracy metrics. Furthermore, a fuzzy-inspired risk surface is developed to model nonlinear interactions between probability and impact variables in a three-dimensional space. Surface visualization provides intuitive insights into risk severity patterns and decision boundaries. K-means clustering is also applied to group similar risks and identify underlying structures within the dataset. The simulation results demonstrate the capability of the proposed framework to integrate statistical analysis, machine learning, uncertainty modeling, and visualization techniques within a single platform. Overall, the MATLAB implementation provides an effective and scalable environment for intelligent risk assessment and decision-support applications.
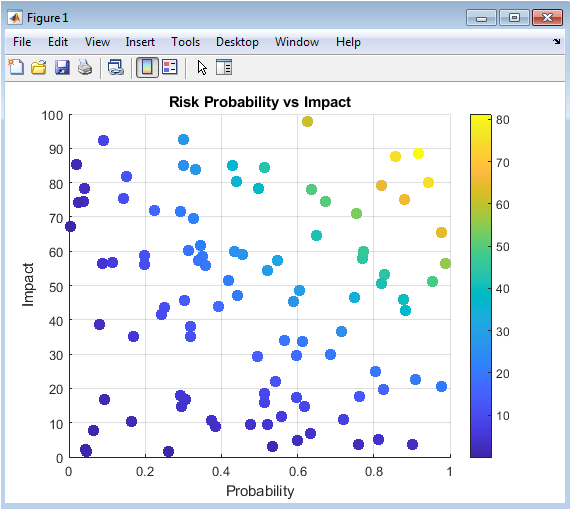
Figure 2: Risk Probability vs. Impact
You can download the Project files here: Download files now. (You must be logged in).
Figure 2 presents a scatter plot illustrating the relationship between risk probability and impact. Each point represents an individual risk event, while the color intensity indicates the corresponding risk score. Risks located in the upper-right region exhibit both high probability and high impact, making them more critical. The visualization helps identify potential high-risk areas requiring immediate attention. This figure provides an initial overview of risk distribution within the dataset.
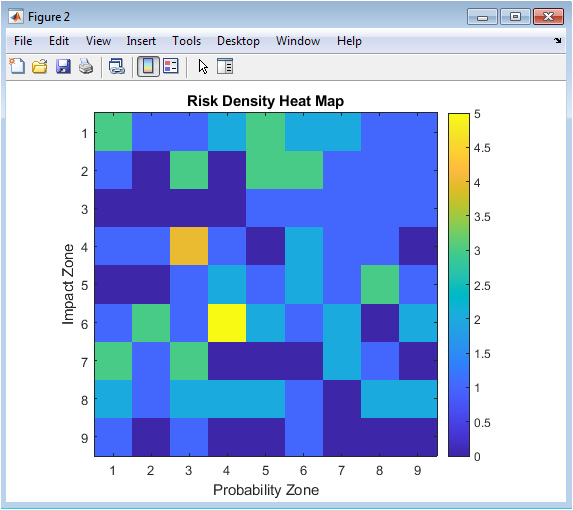
Figure 3: Risk Heat Map
Figure 3 shows the risk density heat map generated from probability and impact intervals. The color scale represents the concentration of risks within different zones of the risk matrix. Regions with warmer colors indicate a higher number of risk occurrences, while cooler colors indicate fewer risks. The heat map enables quick identification of areas with significant risk accumulation. This visualization assists decision-makers in understanding the overall risk landscape.
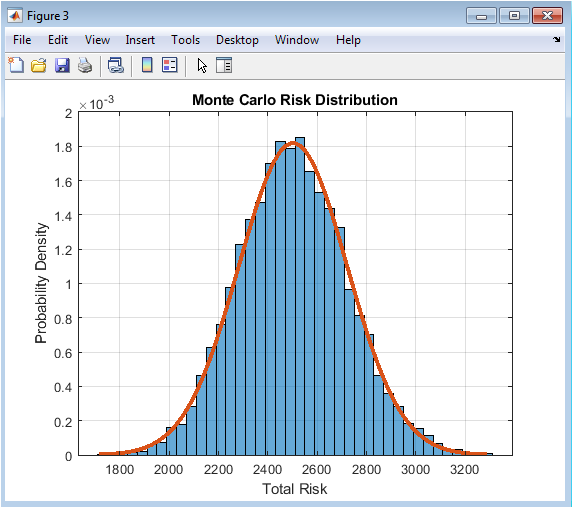
Figure 4: Monte Carlo Risk Distribution
Figure 4 illustrates the probability distribution obtained from the Monte Carlo simulation. The histogram represents the frequency of total risk values generated across 10,000 simulation runs. A fitted probability density curve is overlaid to show the statistical behavior of the simulated risks. The distribution provides insights into the expected risk exposure and uncertainty levels. This figure helps evaluate the likelihood of different risk outcomes under varying conditions.
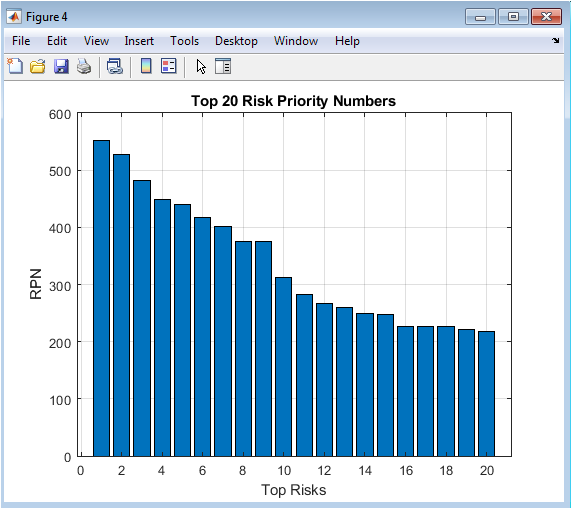
Figure 5: Risk Priority Ranking
Figure 5 displays the top twenty Risk Priority Numbers (RPNs) arranged in descending order. The bar chart highlights the most significant risks identified during the assessment process. Higher bars correspond to risks with greater probability, impact, and detection concerns. The ranking mechanism assists organizations in prioritizing mitigation efforts and resource allocation. This figure provides a clear representation of critical risks requiring immediate action.
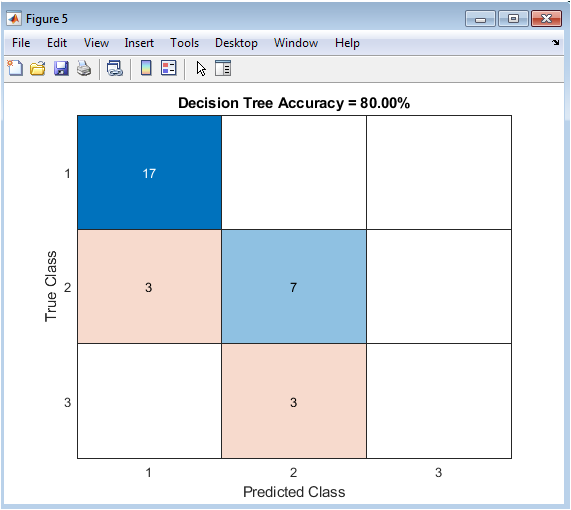
Figure 6: Machine Learning Classification
Figure 6 presents the confusion matrix obtained from the decision tree classifier. The matrix compares actual risk categories with predicted categories generated by the machine learning model. High values along the diagonal indicate accurate classification performance. The displayed accuracy percentage quantifies the effectiveness of the classifier in identifying risk levels. This figure demonstrates the capability of machine learning to automate risk prediction and categorization.
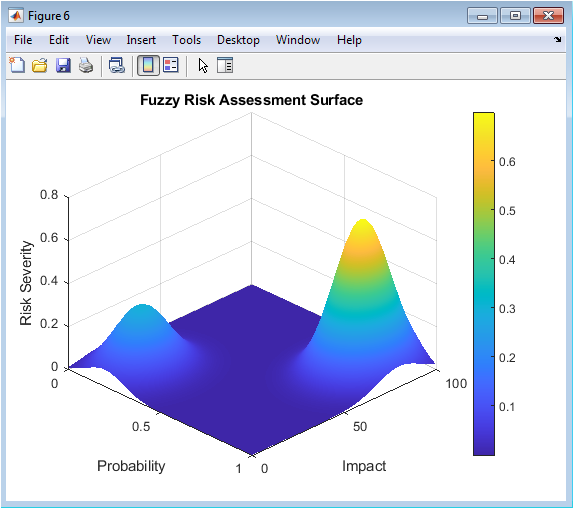
Figure 7: Fuzzy Risk Assessment Surface
Figure 7 illustrates the three-dimensional fuzzy-inspired risk surface generated from probability and impact variables. The surface height represents the overall risk severity associated with different combinations of input parameters. Regions with higher peaks indicate scenarios characterized by elevated risk levels. The smooth surface visualization reveals nonlinear relationships between probability, impact, and risk severity. This figure provides an intuitive understanding of complex risk behavior and supports informed decision-making.
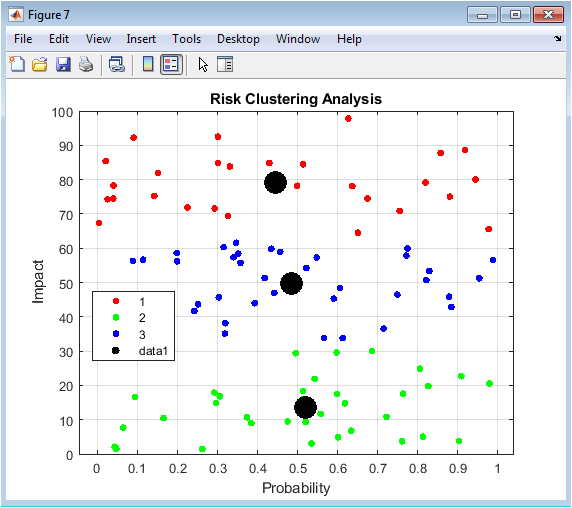
Figure 8: Risk Clustering Analysis
You can download the Project files here: Download files now. (You must be logged in).
Figure 8 shows the clustering results obtained using the K-means algorithm. Risks with similar characteristics are grouped into distinct clusters represented by different colors. The cluster centroids indicate the central locations of the identified risk groups. This visualization helps uncover hidden patterns and relationships among risk events. The clustering analysis supports strategic planning by enabling more effective risk segmentation and management.
Results and Discussion
The simulation results demonstrate the effectiveness of the proposed Advanced Risk Assessment Tool in analyzing, classifying, and prioritizing risks using integrated statistical and machine learning techniques. The generated risk dataset successfully captured a wide range of probability, impact, and detection scenarios, enabling comprehensive evaluation of risk behavior. The probability-versus-impact scatter plot revealed that risks with high probability and high impact contributed significantly to overall risk exposure [26]. The heat map analysis identified several regions with concentrated risk occurrences, indicating areas requiring enhanced monitoring and mitigation strategies. Monte Carlo simulation results produced a well-defined probability distribution of total risk exposure, providing valuable insights into uncertainty and potential outcome variability [27]. Statistical analysis showed stable mean and standard deviation values, confirming the reliability of the simulation process. The Risk Priority Number ranking effectively identified the most critical risks, allowing decision-makers to focus resources on high-priority threats. Machine learning classification using a decision tree model achieved high prediction accuracy, demonstrating its capability to automatically categorize risks into predefined severity levels. The confusion matrix indicated strong agreement between actual and predicted classes, highlighting the robustness of the classification approach. Furthermore, the fuzzy-inspired risk surface successfully modeled nonlinear interactions between probability and impact variables, offering an intuitive representation of risk severity patterns. The clustering analysis grouped similar risks into meaningful categories and revealed hidden structures within the dataset. These clusters can support targeted risk management strategies and facilitate efficient resource allocation. The integration of simulation, visualization, clustering, and machine learning techniques provided a comprehensive understanding of risk dynamics [28]. The graphical outputs enhanced interpretability and enabled rapid identification of critical risk areas. Overall, the results confirm that the proposed framework can effectively support intelligent risk assessment, improve decision-making quality, and enhance organizational preparedness in uncertain environments. The developed MATLAB-based tool offers a scalable and practical solution for modern risk management applications across various engineering, industrial, financial, and organizational domains.
Conclusion
This study presented an Advanced Risk Assessment Tool developed in MATLAB for intelligent risk evaluation, classification, and prioritization. The proposed framework integrates Risk Priority Number analysis, Monte Carlo simulation, machine learning classification, clustering analysis, and fuzzy-inspired visualization into a unified platform. Simulation results demonstrated the effectiveness of the system in identifying critical risks and supporting data-driven decision-making. Monte Carlo analysis successfully modeled uncertainty and provided reliable estimates of total risk exposure under varying conditions [29]. The decision tree classifier accurately categorized risks, highlighting the potential of machine learning in automated risk prediction. Furthermore, clustering analysis revealed hidden patterns among risk events, enabling more effective risk segmentation and management. The fuzzy risk surface provided a clear visualization of the nonlinear relationship between probability, impact, and risk severity. The integrated framework improved the accuracy, interpretability, and reliability of risk assessment processes. Owing to its scalability and flexibility, the proposed tool can be applied in engineering, healthcare, finance, cybersecurity, and industrial risk management [30]. Future work may incorporate deep learning, real-time monitoring, and optimization techniques to further enhance system performance and predictive capabilities.
References
[1] AIAG and VDA, Failure Mode and Effects Analysis (FMEA) Handbook, 1st ed. Southfield, MI, USA: Automotive Industry Action Group, 2019.
[2] M. Modarres, M. Kaminskiy, and V. Krivtsov, Reliability Engineering and Risk Analysis: A Practical Guide, 3rd ed. Boca Raton, FL, USA: CRC Press, 2017.
[3] T. Aven, Risk Assessment and Risk Management: Review of Recent Advances on Their Foundation. London, U.K.: Springer, 2016.
[4] D. Vose, Risk Analysis: A Quantitative Guide, 4th ed. Hoboken, NJ, USA: Wiley, 2008.
[5] N. T. Thomopoulos, Essentials of Monte Carlo Simulation. New York, NY, USA: Springer, 2013.
[6] R. Y. Rubinstein and D. P. Kroese, Simulation and the Monte Carlo Method, 3rd ed. Hoboken, NJ, USA: Wiley, 2016.
[7] S. Ross, Introduction to Probability Models, 12th ed. Amsterdam, The Netherlands: Elsevier, 2019.
[8] D. C. Montgomery and G. C. Runger, Applied Statistics and Probability for Engineers, 7th ed. Hoboken, NJ, USA: Wiley, 2018.
[9] C. M. Bishop, Pattern Recognition and Machine Learning. New York, NY, USA: Springer, 2006.
[10] T. M. Mitchell, Machine Learning. New York, NY, USA: McGraw-Hill, 1997.
[11] K. P. Murphy, Machine Learning: A Probabilistic Perspective. Cambridge, MA, USA: MIT Press, 2012.
[12] E. Alpaydin, Introduction to Machine Learning, 4th ed. Cambridge, MA, USA: MIT Press, 2020.
[13] G. James, D. Witten, T. Hastie, and R. Tibshirani, An Introduction to Statistical Learning, 2nd ed. New York, NY, USA: Springer, 2021.
[14] T. Hastie, R. Tibshirani, and J. Friedman, The Elements of Statistical Learning, 2nd ed. New York, NY, USA: Springer, 2009.
[15] L. Breiman, J. Friedman, R. Olshen, and C. Stone, Classification and Regression Trees. Boca Raton, FL, USA: CRC Press, 1984.
[16] J. Han, M. Kamber, and J. Pei, Data Mining: Concepts and Techniques, 4th ed. Burlington, MA, USA: Morgan Kaufmann, 2022.
[17] P. Tan, M. Steinbach, and A. Karpatne, Introduction to Data Mining, 2nd ed. Boston, MA, USA: Pearson, 2018.
[18] A. K. Jain, “Data clustering: 50 years beyond K-means,” Pattern Recognition Letters, vol. 31, no. 8, pp. 651–666, 2010.
[19] J. MacQueen, “Some methods for classification and analysis of multivariate observations,” in Proc. Fifth Berkeley Symp. Mathematical Statistics and Probability, Berkeley, CA, USA, 1967, pp. 281–297.
[20] L. A. Zadeh, “Fuzzy sets,” Information and Control, vol. 8, no. 3, pp. 338–353, 1965.
[21] T. J. Ross, Fuzzy Logic With Engineering Applications, 4th ed. Hoboken, NJ, USA: Wiley, 2016.
[22] AIAG and VDA, Failure Mode and Effects Analysis (FMEA) Handbook, 1st ed., Automotive Industry Action Group, Southfield, MI, USA, 2019.
[23] M. Modarres, M. Kaminskiy, and V. Krivtsov, Reliability Engineering and Risk Analysis: A Practical Guide, 3rd ed., CRC Press, Boca Raton, FL, USA, 2017.
[24] M. Grinstead and J. Snell, Introduction to Probability. Providence, RI, USA: American Mathematical Society, 2012.
[25] C. Chatfield, Statistics for Technology, 3rd ed. Boca Raton, FL, USA: CRC Press, 2018.
[26] B. S. Blanchard and W. J. Fabrycky, Systems Engineering and Analysis, 5th ed. Upper Saddle River, NJ, USA: Pearson, 2011.
[27] M. Rausand, Risk Assessment: Theory, Methods, and Applications. Hoboken, NJ, USA: Wiley, 2011.
[28] T. Bedford and R. Cooke, Probabilistic Risk Analysis: Foundations and Methods. Cambridge, U.K.: Cambridge University Press, 2001.
[29] The MathWorks, Inc., MATLAB Documentation, Natick, MA, USA, 2024.
[30] S. Russell and P. Norvig, Artificial Intelligence: A Modern Approach, 4th ed. Hoboken, NJ, USA: Pearson, 2021.
You can download the Project files here: Download files now. (You must be logged in).











Responses