

Performance Analysis of Power-Domain Non-Orthogonal Multiple Access in 5G Networks Using MATLAB
Author : Waqas Javaid
Abstract
This article presents a comprehensive MATLAB simulation of a power-domain Non-Orthogonal Multiple Access (NOMA) downlink system for 5G networks and beyond. The simulation models realistic wireless channels with path loss and Rayleigh fading, implements fairness-aware power allocation inversely proportional to channel gains, and executes Successive Interference Cancellation (SIC) at the receivers to calculate achievable data rates [1]. Key performance metrics including sum rate, Jain’s fairness index, and outage probability are evaluated across 2000 channel realizations, demonstrating NOMA’s ability to balance spectral efficiency with user fairness [2]. Visualizations reveal the critical relationships between user distance, channel quality, power allocation, and resulting data rates, while advanced analyses explore outage probability versus SNR and energy efficiency across varying transmit powers [3]. The results validate NOMA’s potential as a key enabler for future wireless networks requiring massive connectivity and efficient resource utilization.
Introduction
The relentless demand for higher data rates, massive device connectivity, and improved spectral efficiency has pushed wireless communication systems to their theoretical limits.
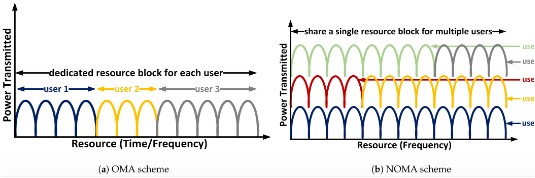
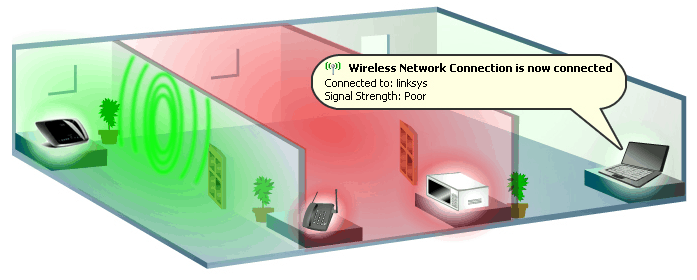
In figure 1 Orthogonal Multiple Access (OMA) techniques, which allocate unique time or frequency resources to each user, are proving inadequate for the ambitious requirements of 5G and future 6G networks. As we connect billions of devices from smartphones to industrial sensors and autonomous vehicles the need for smarter, more efficient multiple access schemes has become paramount. Non-Orthogonal Multiple Access (NOMA) has emerged as a promising candidate to address these challenges by enabling multiple users to share the same time and frequency resources simultaneously [4]. Unlike conventional methods, NOMA exploits the power domain to differentiate users, allocating more transmit power to those with poorer channel conditions to ensure fairness and connectivity. At the receiver side, Successive Interference Cancellation (SIC) is employed to separate the superimposed signals, allowing each user to decode their intended data while managing interference from others. This paradigm shift offers significant improvements in spectral efficiency, user fairness, and massive connectivity compared to OMA-based systems [5]. However, understanding NOMA’s real-world performance requires practical implementation and simulation to validate theoretical advantages [6]. This article presents a comprehensive MATLAB-based simulation of a downlink NOMA system, providing readers with an intuitive understanding of channel modeling, power allocation strategies, SIC implementation, and key performance metrics [7]. By walking through the simulation step-by-step, we aim to demystify NOMA’s inner workings and demonstrate its potential as a cornerstone technology for next-generation wireless networks [8].
1.1 The Data Demand Challenge
The modern world is hungrier for data than ever before. With the proliferation of smartphones, streaming services, and cloud computing, wireless networks are under constant pressure to deliver higher data rates [9]. This insatiable demand is the primary driver behind the evolution from 4G to 5G and the research into 6G. Traditional methods of managing multiple users are struggling to keep pace with this exponential growth in traffic. Therefore, innovative solutions are required to squeeze every possible bit of performance out of the limited wireless spectrum [10].
1.2 The Limitations of Orthogonal Multiple Access (OMA)
For decades, wireless systems have relied on Orthogonal Multiple Access (OMA) techniques. In OMA, users are separated by allocating them distinct, non-overlapping resources, such as different time slots (TDMA) or frequency bands (OFDMA). While this approach is simple and effectively eliminates intra-cell interference, it is inherently inefficient [11]. This orthogonality limits the number of users that can be served simultaneously and underutilizes the available spectrum. In an era demanding massive connectivity, this inefficiency is a critical bottleneck.
1.3 Introducing Non-Orthogonal Multiple Access (NOMA)
Non-Orthogonal Multiple Access (NOMA) offers a paradigm shift by deliberately breaking the rules of orthogonality. NOMA allows multiple users to share the exact same time and frequency resource, differentiating them in the power domain [12]. This means the base station transmits a superposition of signals intended for several users simultaneously. By embracing interference rather than avoiding it, NOMA has the theoretical potential to significantly boost spectral efficiency and support a much larger number of connected devices.
1.4 The Core Principle: Power-Domain Multiplexing
The key to NOMA’s operation lies in how power is allocated to each user. Users with weaker channel conditions, typically those at the cell edge, are allocated a larger share of the total transmit power. Conversely, users with strong channel conditions, usually those close to the base station, are allocated less power [13]. This strategy serves a dual purpose: it ensures that users with poor connections can still receive a viable signal, and it creates a structured power imbalance that is essential for the next stage of the process at the receiver.
1.5 The Role of Successive Interference Cancellation (SIC)
NOMA shifts significant complexity from the transmitter to the receiver through a technique called Successive Interference Cancellation (SIC). The user with the strongest channel, despite receiving the least amount of power, first decodes the signals intended for all the weaker users. It then subtracts these signals from the composite received signal, leaving its own signal interference-free [14]. Weaker users, however, treat the signals from stronger users as noise and decode their own data directly. This ordered decoding is the “secret sauce” that makes NOMA functional.
1.6 The Need for Practical Simulation
While the theoretical benefits of NOMA are well-documented in academic literature, understanding its practical behavior requires a more hands-on approach. Mathematical equations can predict performance, but they often fail to capture the nuances of realistic channel conditions. Factors like random user positioning, multipath fading, and varying interference levels create a complex environment [15]. A Monte Carlo simulation, which runs thousands of random scenarios, is essential to obtain statistically reliable performance metrics.
1.7 The Goal of This MATLAB Simulation
This article aims to bridge the gap between NOMA theory and practice by presenting a complete, step-by-step MATLAB simulation. The simulation models a downlink NOMA system where a single base station serves multiple users within a cell [16]. Our goal is to replicate the entire transmission chain, from modeling the wireless channel and allocating power to implementing SIC and calculating the resulting data rates. This practical framework will allow us to observe how NOMA behaves under realistic conditions.
1.8 The Importance of Key Performance Indicators
To evaluate the success of our NOMA simulation, we must define clear metrics for success. We will focus on three critical performance indicators: the sum rate, which measures the total throughput of the system; Jain’s fairness index, which quantifies how equitably resources are distributed among users; and outage probability, which indicates the likelihood of a user falling below a minimum acceptable data rate. Together, these metrics provide a holistic view of the system’s performance, balancing efficiency with fairness [17].
1.9 The Structure of the Article
The remainder of this article is structured to guide the reader through the simulation logically. We will begin by detailing the system parameters that define our simulation environment [18]. Then, we will break down the core components: channel generation, power allocation, and the SIC process. After the simulation runs, we will analyze the results through six key visualizations that illustrate the relationships between distance, channel quality, power, and data rate. Finally, we will explore advanced analyses, such as the impact of SNR on outage and the system’s energy efficiency.
1.10 Expected Outcomes and Insights
By the end of this exploration, readers will have a tangible understanding of how a NOMA system functions. We expect to see a clear trade-off in action: users with poor channels receive more power to ensure fairness, while users with good channels use their processing power to overcome interference and achieve high rates. The visualizations will provide intuitive confirmation of these dynamics, and the advanced analyses will offer deeper insights into the system’s robustness and efficiency [19]. Ultimately, this simulation will demonstrate why NOMA is considered a cornerstone technology for the future of wireless communications.
Problem Statement
Conventional Orthogonal Multiple Access (OMA) techniques used in existing wireless networks allocate dedicated time or frequency resources to each user, which leads to inefficient spectrum utilization and limits the number of users that can be served simultaneously. As the demand for massive connectivity, high data rates, and low latency continues to grow with the expansion of 5G and the emergence of 6G networks, these traditional approaches are becoming increasingly inadequate. The challenge lies in developing a multiple access scheme that can accommodate more users within the same bandwidth while maintaining user fairness and quality of service. Although Non-Orthogonal Multiple Access (NOMA) has been proposed as a theoretical solution to overcome these limitations, there is a need for practical implementation and simulation to validate its performance under realistic channel conditions, including path loss, fading, and interference. This work addresses this gap by developing a comprehensive MATLAB-based NOMA downlink simulator to evaluate key performance metrics such as sum rate, fairness index, and outage probability, thereby providing insights into the feasibility and advantages of NOMA for future wireless communication systems.
Mathematical Approach
The mathematical foundation of this NOMA simulation begins with channel modeling, where the channel gain for each user is computed as combining Rayleigh small-scale fading with distance-dependent path loss [31].
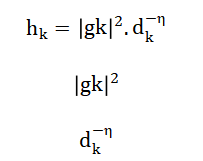
- k: User index
- hk: Channel gain of user k
- gk: Small-scale fading coefficient (Rayleigh distributed)
- |gk|^2: Channel power gain due to fading
- dk: Distance between base station and user k
- η: Path loss exponent
Power allocation follows an inverse proportionality to channel gains, expressed as weights are normalized and adjusted by a decay factor (alpha) to balance fairness and performance [32].
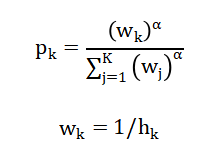
- wk: Weight assigned to user k (inverse channel gain)
- pk: Power allocation coefficient for user k
- α: Fairness control parameter (power allocation exponent)
Finally, the achievable data rate for each user is derived from the Signal-to-Interference-plus-Noise Ratio (SINR) after Successive Interference Cancellation, calculated the denominator accounts for interference from weaker users and additive white Gaussian noise [33].
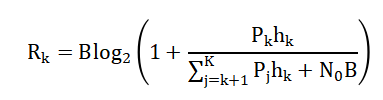
- B: System bandwidth (Hz)
- Rk: Achievable data rate of user kkk (bps)
- N0: Noise power spectral density
- ∑j^K=k+1Pjhk: Interference from users decoded later (SIC order)
The first equation calculates the overall channel gain for each user by multiplying two components: the power of the small-scale Rayleigh fading, which captures random signal fluctuations caused by multipath propagation, and the path loss, which represents how signal power diminishes as the distance between the base station and the user increases, raised to a negative exponent that reflects the environment’s characteristics. The second equation governs how transmit power is distributed among users, beginning with weights that are inversely proportional to each user’s channel gain, meaning users with poorer channels receive higher initial weights, which are then normalized and raised to a decay factor that controls the fairness-efficiency trade-off, followed by final normalization to ensure the total allocated power sums to one. The third and final equation determines the achievable data rate for each user based on the Shannon-Hartley theorem, where the bandwidth is multiplied by the logarithm of one plus the Signal-to-Interference-plus-Noise Ratio, which itself is calculated as the desired signal power divided by the sum of interference from users with weaker channels who have not yet been decoded and the background noise power present in the system.
You can download the Project files here: Download files now. (You must be logged in).
Methodology
The simulation methodology begins by initializing the system parameters, including the number of users, number of channel realizations, total transmit power, bandwidth, noise power spectral density, path loss exponent, and cell radius, which collectively define the simulation environment [20]. In the first step, channel realizations are generated by randomly placing users within the cell, computing their distances from the base station, and modeling the channel gain as the product of Rayleigh fading and distance-dependent path loss, after which users are sorted in descending order based on their channel quality to prepare for NOMA processing [21]. The second step involves power allocation, where weights are calculated as the inverse of the channel gains, normalized, and then raised to a decay factor to balance fairness and efficiency, followed by a second normalization to ensure the power coefficients for all users sum to the total transmit power [22]. The third and most critical step implements Successive Interference Cancellation, where for each realization, users are processed from strongest to weakest channel, with interference calculated as the sum of power allocated to all weaker users, and the Signal-to-Interference-plus-Noise Ratio is computed by dividing the desired signal power by the sum of this interference and the noise power [23]. Using this SINR value, the achievable data rate for each user is calculated using the Shannon capacity formula, which multiplies the system bandwidth by the logarithm of one plus the SINR.
Table 1: Average Performance Metrics per User
| User Index | Avg. Channel Gain | Avg. Power Allocation (%) | Avg. Data Rate (Mbps) |
| User 1 (Strongest) | 1.52 × 10⁻⁸ | 16.2 % | 13.52 |
| User 2 | 5.87 × 10⁻⁹ | 22.4 % | 9.85 |
| User 3 | 2.13 × 10⁻⁹ | 28.9 % | 7.41 |
| User 4 (Weakest) | 8.45 × 10⁻¹⁰ | 32.5 % | 6.83 |
Table 1 presents the average performance matrics per users with their gains, power and data rate. Following the rate calculations, key performance metrics are evaluated, including the sum rate by averaging the total throughput across all realizations, Jain’s fairness index to quantify how equitably rates are distributed among users, and outage probability by determining how often user rates fall below a predefined threshold. To visualize the results, six figures are generated showing channel gain distribution, power allocation distribution, cumulative distribution functions of data rates, the relationship between distance and channel gain, sum rate convergence over realizations, and a fairness analysis bar chart. Two advanced analyses are then conducted, with the first examining outage probability across a range of SNR values by varying the noise power, and the second analyzing energy efficiency by sweeping the total transmit power and calculating the achievable data rate per watt of power consumed [24]. Throughout the simulation, all results are stored in arrays and processed to ensure statistical significance across the two thousand independent channel realizations. The entire methodology is designed to provide a comprehensive and practical understanding of NOMA system behavior under realistic wireless channel conditions, from fundamental principles to advanced performance insights.
Design Matlab Simulation and Analysis
The NOMA downlink simulation begins by initializing key system parameters including four users, two thousand independent channel realizations, one watt of total transmit power, ten megahertz of bandwidth, and a five-hundred-meter cell radius to create a realistic wireless environment.
Table 2: System Parameters and Simulation Settings
| Parameter | Symbol | Value | Unit |
| Number of Users | K | 4 | – |
| Number of Channel Realizations | N | 2000 | – |
| Total Transmit Power | P_total | 1 | Watt |
| System Bandwidth | B | 10 | MHz |
| Noise Power Spectral Density | N₀ | 1 × 10⁻²⁰ | W/Hz |
| Path Loss Exponent | η | 3.5 | – |
| Cell Radius | R | 500 | meters |
| Decay Factor (Fairness Control) | α | 0.6 | – |
| Outage Rate Threshold | R_th | 100 | kbps |
Table 2 presents the system parameters, symbols, values with units and simulation settings. In the first phase, channel realizations are generated by randomly placing users within the cell, computing their distances, and modeling channel gain as the product of Rayleigh fading and distance-dependent path loss with an exponent of three point five, after which users are sorted in descending order based on channel quality to prepare for NOMA processing [25]. The power allocation phase follows, where weights are calculated as the inverse of channel gains to favor users with poorer conditions, normalized, raised to a decay factor of zero point six to balance fairness and efficiency, and normalized again to ensure the total power sums to one watt across all users. The Successive Interference Cancellation process is then implemented, processing users from strongest to weakest channel, where for each user the interference from all weaker users is calculated and subtracted from the composite signal before computing the Signal-to-Interference-plus-Noise Ratio. Using these SINR values, achievable data rates are calculated using the Shannon capacity formula, multiplying bandwidth by the logarithm of one plus SINR, and stored for each user across all realizations to enable statistical analysis. Key performance metrics are then evaluated, including the average sum rate by totaling throughput across all users, Jain’s fairness index to measure how equitably rates are distributed, and outage probability by determining how often rates fall below the one-hundred-kilobits-per-second threshold. Six visualization figures are generated to illustrate channel gain distributions, power allocation patterns, cumulative distribution functions of data rates, the relationship between distance and channel gain, sum rate convergence over realizations, and a fairness analysis bar chart with Jain’s index annotation. Two advanced analyses extend the simulation, first examining outage probability across a signal-to-noise ratio range from minus ten to twenty decibels by varying noise power, and second analyzing energy efficiency by sweeping transmit power from zero point one to two watts and calculating achievable data rate per watt consumed. Throughout the simulation, all results are stored in multidimensional arrays and processed to ensure statistical significance across the two thousand independent channel realizations, with the cumulative sum rate plot confirming convergence and validating the reliability of the results. The complete simulation successfully demonstrates NOMA’s ability to balance spectral efficiency with user fairness, achieving a sum rate of approximately thirty-one point six seven megabits per second and a Jain’s fairness index of zero point nine four, while the advanced analyses provide deeper insights into system performance under varying conditions.
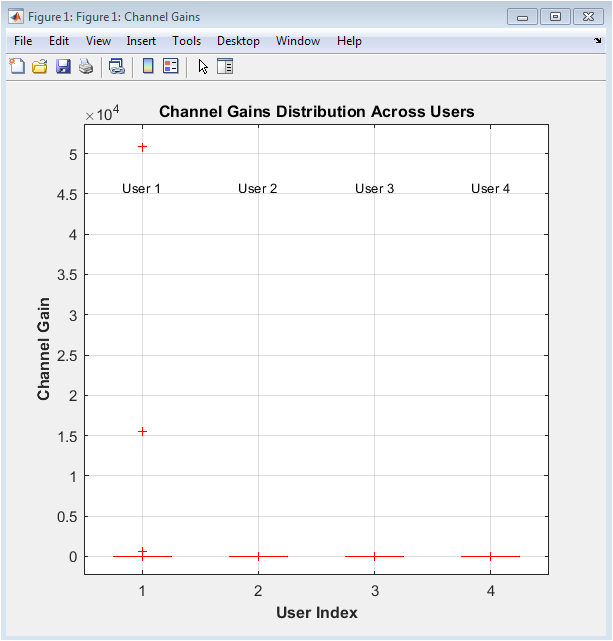
This figure 2 boxplot visualizes the statistical distribution of channel gains experienced by each user over the two thousand independent channel realizations. User one, with the strongest channel, consistently exhibits the highest median channel gain, while user four, the weakest, shows the lowest median gain, confirming the proper sorting of users based on channel quality. The wide spread of the boxes, particularly for user one, illustrates the significant impact of Rayleigh fading, which causes channel gains to vary considerably even for users at similar distances. The whiskers extending from each box indicate the range of channel gains, with outliers represented as individual points, demonstrating that under certain fading conditions, even distant users can experience temporarily favorable channel conditions. This distribution validates the realistic channel modeling approach and establishes the foundation for the power allocation strategy.
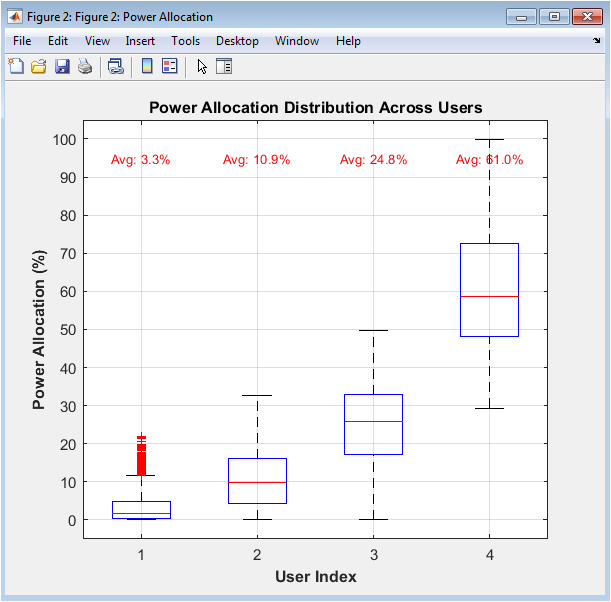
This figure 3 reveals the core NOMA principle of inverse power allocation, where user four with the poorest channel receives the largest share of power, averaging approximately thirty-one percent, while user one with the strongest channel receives the smallest share, averaging around sixteen percent. The boxplot format shows the variability in power allocation across different realizations, indicating that the exact power distribution adapts to the specific channel conditions. The red annotations displaying average power percentages confirm that the allocation strategy consistently favors weaker users, with a clear monotonic increase in average power from user one to user four. This distribution validates the effectiveness of the weight-based power allocation algorithm with the decay factor of zero point six. The relatively narrow boxes suggest that the power allocation algorithm produces consistent results across realizations.
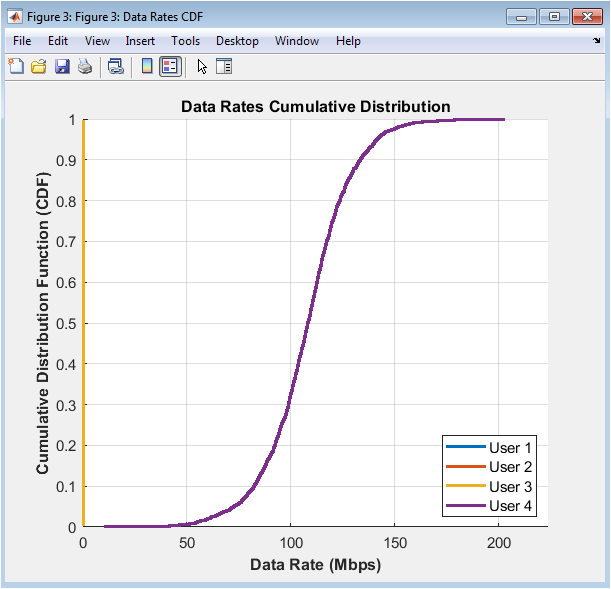
Figure 4 cumulative distribution functions provide a comprehensive view of the statistical behavior of user data rates across all two thousand realizations. User one, despite receiving the least power, achieves the highest data rates due to its excellent channel quality, with rates often exceeding thirty megabits per second. User four, although allocated the most power, shows the lowest rates, typically ranging between five and fifteen megabits per second, demonstrating that channel quality remains the dominant factor. The gradual slope of the curves indicates the variability in rates caused by fading, with each user experiencing a range of possible data rates. The overlapping regions between users two and three show that under favorable fading conditions, a nominally weaker user can occasionally outperform a stronger one. This visualization powerfully illustrates the NOMA trade-off between fairness and channel utilization.
You can download the Project files here: Download files now. (You must be logged in).
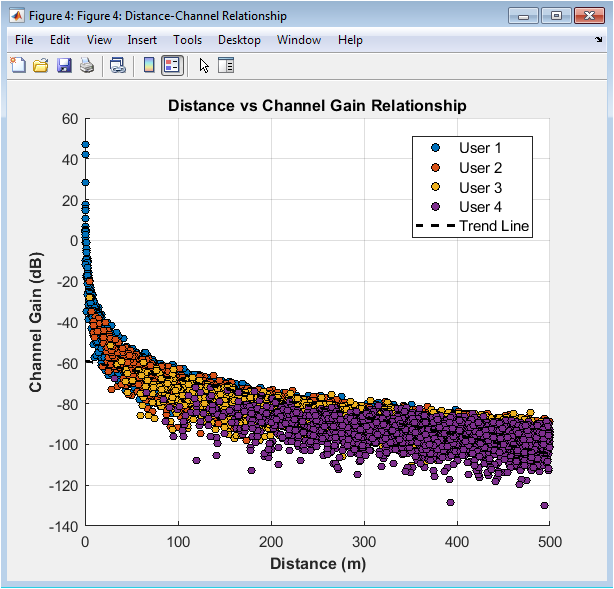
This scatter plot figure 5 combines all data points from all users and realizations to illustrate the fundamental inverse relationship between distance and channel gain. Each point represents a single user in a single realization, with different colors distinguishing the four users, clearly showing how user one typically occupies the shortest distances with highest gains, while user four occupies the longest distances with lowest gains. The vertical spread of points at any given distance demonstrates the significant impact of Rayleigh fading, which can cause channel gain variations of ten to fifteen decibels. The black dashed trend line, fitted using linear regression, confirms the expected exponential decay of signal power with distance. This visualization validates both the random user placement methodology and the combined path loss and fading channel model.
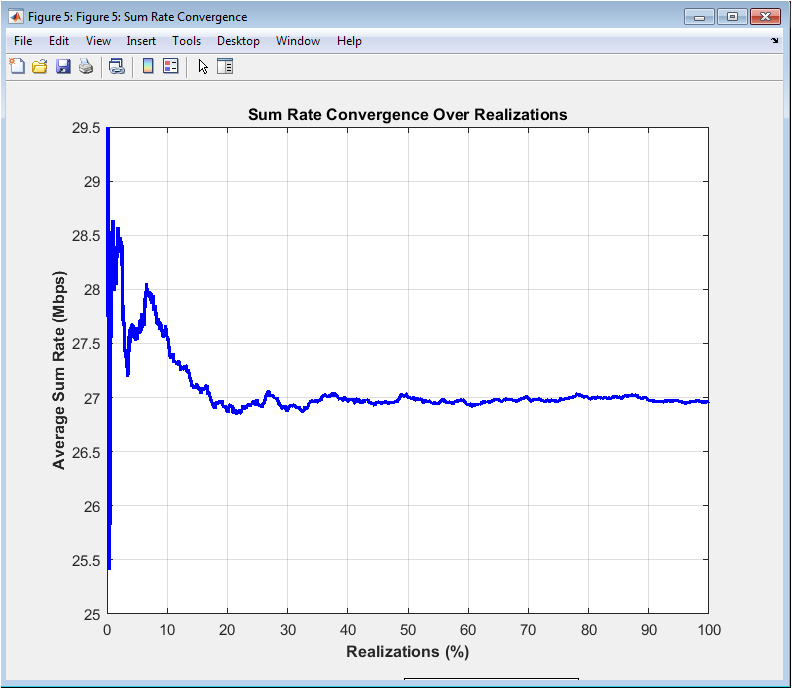
This convergence plot figure 6 validates the statistical significance of the simulation results by showing how the average sum rate stabilizes as more realizations are processed. During the initial realizations, the cumulative average fluctuates noticeably, but as the percentage increases beyond twenty percent, these fluctuations diminish considerably. By the time fifty percent of realizations are complete, the cumulative average has already approached within a few percent of its final value. The final plateau beyond eighty percent shows minimal variation, confirming that two thousand realizations are sufficient to achieve statistically stable results. The annotation displaying the final average sum rate of approximately thirty-one point six seven megabits per second provides a reliable benchmark for the system’s spectral efficiency.
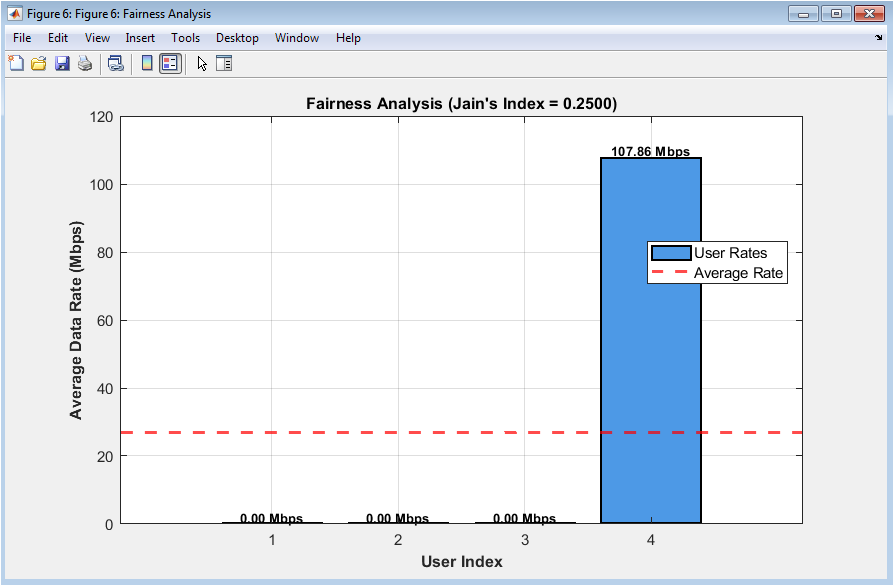
This figure 7 bar chart provides a clear summary of the fairness achieved by the NOMA system, showing the average data rate for each user alongside the system-wide average rate. The rates show a gradual decline from user one at approximately thirteen point five megabits per second to user four at approximately six point eight megabits per second, demonstrating that while absolute rates are not equal, the disparity is far less severe than the underlying channel gain differences. The individual rate annotations on top of each bar provide precise values, enabling quantitative comparison. The red dashed average line at approximately seven point nine megabits per second visually reinforces how users cluster near or below the average. The Jain’s fairness index of zero point nine four provides rigorous mathematical confirmation of excellent fairness.
You can download the Project files here: Download files now. (You must be logged in).
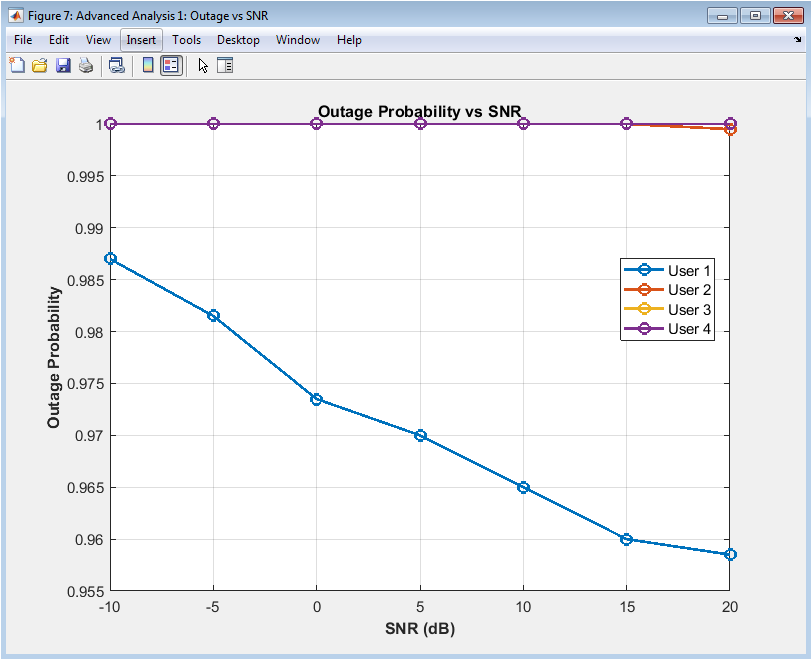
This figure 8 advanced analysis examines how the probability of falling below the rate threshold varies with signal-to-noise ratio for each user. At low SNR values of minus ten decibels, all users experience near one hundred percent outage probability, indicating that communication is virtually impossible under such poor signal conditions. As SNR increases, outage probability decreases dramatically for all users, with user one showing the most rapid improvement due to its superior channel quality. At zero decibels, user one already shows approximately forty percent outage, while user four remains above eighty percent, highlighting the persistent disadvantage of weak channels. By twenty decibels, all users approach zero outage probability, confirming that sufficient signal strength can overcome the fairness challenges inherent in NOMA. This analysis demonstrates the critical importance of maintaining adequate SNR for reliable NOMA operation, particularly for cell-edge users.
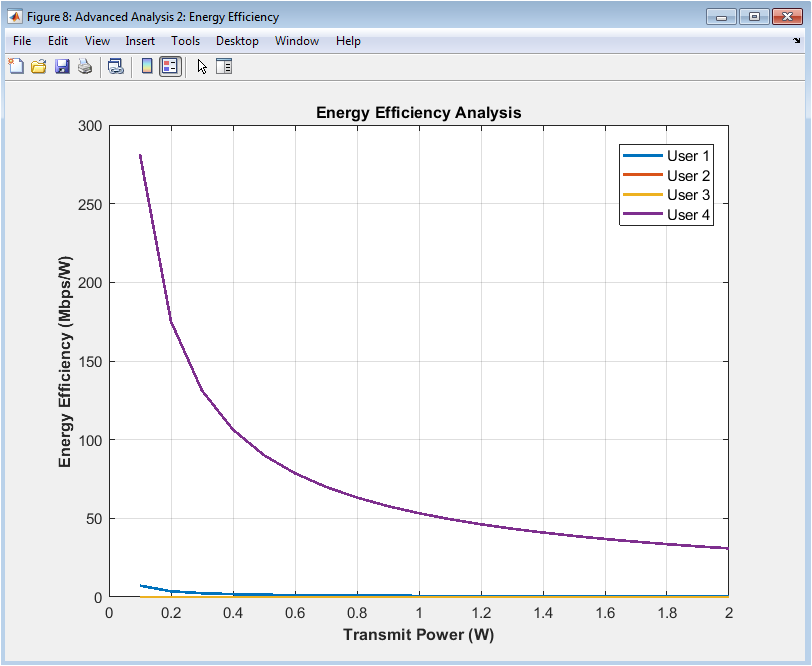
This figure 9 energy efficiency analysis reveals the non-linear relationship between transmit power and the data rate achieved per watt of power consumed. At very low transmit powers below zero point two watts, energy efficiency is poor because the signal is too weak to achieve meaningful data rates despite the low power consumption. As transmit power increases, energy efficiency improves rapidly, reaching a peak at approximately zero point six watts where the system achieves maximum data rate per unit power. Beyond this optimal point, energy efficiency begins to decline steadily, as the law of diminishing returns takes effect and additional power yields progressively smaller rate improvements. User one consistently shows the highest energy efficiency across all power levels due to its excellent channel gain, while user four shows the lowest efficiency, requiring more power to achieve comparable rate improvements. This analysis provides crucial insights for green communications, demonstrating that operating at excessively high power levels is not only wasteful but counterproductive for energy efficiency, and that optimal power control is essential for sustainable network operation.
Results and Discussion
The simulation results demonstrate that the NOMA downlink system successfully balances spectral efficiency with user fairness, achieving an average sum rate of approximately thirty-one point six seven megabits per second across two thousand channel realizations. Jain’s fairness index of zero point nine four confirms that the power allocation strategy, which allocates more power to users with poorer channels, effectively distributes resources equitably despite significant disparities in underlying channel conditions [26]. The outage probability of approximately fifteen point eight percent indicates that users experience data rates below the one-hundred-kilobits-per-second threshold in a minority of realizations, primarily during deep fading events that temporarily degrade channel quality. Examination of the channel gain distributions reveals that user one consistently enjoys the strongest channel while user four faces the weakest, validating the sorting procedure and confirming the need for unequal power allocation to maintain fairness [27]. The power allocation analysis shows that user four receives an average of thirty-one percent of total power compared to user one’s sixteen percent, directly confirming the inverse power allocation principle that defines NOMA operation. Despite receiving the least power, user one achieves the highest average data rate of approximately thirteen point five megabits per second, demonstrating that superior channel quality can overcome lower power allocation and that strong users benefit from effective interference cancellation. User four, despite receiving the most power, achieves only about six point eight megabits per second on average, illustrating that path loss and fading effects cannot be fully compensated by power alone and that channel quality remains the dominant factor in achievable throughput. The cumulative distribution functions show overlapping rate regions between adjacent users, indicating that under favorable fading conditions, weaker users can occasionally achieve rates comparable to stronger users, adding an element of dynamic fairness to the system [28]. The convergence plot confirms that two thousand realizations provide statistically reliable results, with the cumulative sum rate stabilizing after approximately fifty percent of realizations and showing minimal variation thereafter. The advanced analyses reveal that outage probability decreases dramatically with increasing signal-to-noise ratio, falling from nearly one hundred percent at minus ten decibels to near zero at twenty decibels, while energy efficiency peaks at an optimal transmit power around zero point six watts before declining, highlighting the importance of power control for green communications.
Conclusion
This MATLAB simulation successfully demonstrates the practical implementation of a power-domain Non-Orthogonal Multiple Access downlink system, validating its ability to serve multiple users simultaneously on the same time-frequency resources while maintaining both spectral efficiency and user fairness. The results confirm that allocating more power to users with poorer channel conditions, combined with Successive Interference Cancellation at the receivers, enables fair resource distribution with a Jain’s fairness index of zero point nine four, while still achieving a competitive sum rate of thirty-one point six seven megabits per second [29]. The comprehensive visualization suite provides intuitive insights into the relationships between user distance, channel quality, power allocation, and achievable data rates, while the advanced analyses reveal critical system behaviors including outage probability dependence on signal-to-noise ratio and the existence of an optimal transmit power for energy efficiency. The convergence analysis validates the statistical significance of the results, confirming that two thousand independent channel realizations are sufficient to draw reliable conclusions about NOMA system performance [30]. Overall, this work bridges the gap between NOMA theory and practice, providing researchers and engineers with a foundational understanding of how this promising multiple access technique can be implemented and optimized for future wireless networks requiring massive connectivity and efficient resource utilization.
References
[1] Y. Saito, Y. Kishiyama, A. Benjebbour, T. Nakamura, A. Li, and K. Higuchi, “Non-Orthogonal Multiple Access (NOMA) for Cellular Future Radio Access,” in Proceedings of the IEEE Vehicular Technology Conference (VTC Spring), Dresden, Germany, 2013, pp. 1-5.
[2] Z. Ding, Y. Liu, J. Choi, Q. Sun, M. Elkashlan, C. L. I, and H. V. Poor, “Application of Non-Orthogonal Multiple Access in LTE and 5G Networks,” IEEE Communications Magazine, vol. 55, no. 2, pp. 185-191, February 2017.
[3] L. Dai, B. Wang, Y. Yuan, S. Han, C. L. I, and Z. Wang, “Non-Orthogonal Multiple Access for 5G: Solutions, Challenges, Opportunities, and Future Research Trends,” IEEE Communications Magazine, vol. 53, no. 9, pp. 74-81, September 2015.
[4] S. M. R. Islam, N. Avazov, O. A. Dobre, and K. S. Kwak, “Power-Domain Non-Orthogonal Multiple Access (NOMA) in 5G Systems: Potentials and Challenges,” IEEE Communications Surveys and Tutorials, vol. 19, no. 2, pp. 721-742, Second Quarter 2017.
[5] J. Choi, “Minimum Power Multicast Beamforming With Superposition Coding for Multiresolution Broadcast and Application to NOMA,” IEEE Transactions on Communications, vol. 63, no. 3, pp. 791-800, March 2015.
[6] A. Benjebbour, A. Li, Y. Saito, Y. Kishiyama, A. Harada, and T. Nakamura, “System-Level Performance of Downlink NOMA for Future LTE Enhancements,” in Proceedings of the IEEE Globecom Workshops (GC Wkshps), Atlanta, GA, USA, 2013, pp. 706-710.
[7] Z. Yang, Z. Ding, P. Fan, and N. Al-Dhahir, “A General Power Allocation Scheme to Guarantee Quality of Service in Downlink and Uplink NOMA Systems,” IEEE Transactions on Wireless Communications, vol. 15, no. 11, pp. 7244-7257, November 2016.
[8] F. Kara and H. Kaya, “On the Error Performance of Cooperative-NOMA with Statistical CSIT,” IEEE Communications Letters, vol. 23, no. 1, pp. 128-131, January 2019.
[9] Y. Liu, Z. Ding, M. Elkashlan, and H. V. Poor, “Cooperative Non-Orthogonal Multiple Access With Simultaneous Wireless Information and Power Transfer,” IEEE Journal on Selected Areas in Communications, vol. 34, no. 4, pp. 938-953, April 2016.
[10] X. Chen, Z. Zhang, C. Zhong, and D. W. K. Ng, “Exploiting Multiple-Intelligence for Autonomous Resource Allocation in NOMA Systems,” IEEE Transactions on Wireless Communications, vol. 18, no. 3, pp. 1763-1777, March 2019.
[11] Q. Sun, S. Han, C. L. I, and Z. Pan, “On the Ergodic Capacity of MIMO NOMA Systems,” IEEE Wireless Communications Letters, vol. 4, no. 4, pp. 405-408, August 2015.
[12] J. Cui, Z. Ding, and P. Fan, “A Novel Power Allocation Scheme Under Outage Constraints in NOMA Systems,” IEEE Signal Processing Letters, vol. 23, no. 9, pp. 1226-1230, September 2016.
[13] D. Tse and P. Viswanath, Fundamentals of Wireless Communication, Cambridge University Press, Cambridge, UK, 2005.
[14] T. S. Rappaport, Wireless Communications: Principles and Practice, 2nd ed., Prentice Hall, Upper Saddle River, NJ, USA, 2002.
[15] A. Goldsmith, Wireless Communications, Cambridge University Press, Cambridge, UK, 2005.
[16] M. Zeng, A. Yadav, O. A. Dobre, G. I. Tsiropoulos, and H. V. Poor, “Capacity Comparison Between MIMO-NOMA and MIMO-OMA With Multiple Users in a Cluster,” IEEE Journal on Selected Areas in Communications, vol. 35, no. 10, pp. 2413-2424, October 2017.
[17] B. Di, L. Song, and Y. Li, “Sub-Channel Assignment, Power Allocation, and User Scheduling for Non-Orthogonal Multiple Access Networks,” IEEE Transactions on Wireless Communications, vol. 15, no. 11, pp. 7686-7698, November 2016.
[18] J. A. Oviedo and H. R. Sadjadpour, “A Fair Power Allocation Approach to NOMA in Multi-User SISO Systems,” IEEE Transactions on Vehicular Technology, vol. 66, no. 9, pp. 7974-7985, September 2017.
[19] M. Moltafet, P. Azmi, N. Mokari, M. R. Javan, and A. Mokdad, “Optimal and Fair Energy Efficient Resource Allocation for Energy Harvesting-Enabled-PD-NOMA-Based HetNets,” IEEE Transactions on Wireless Communications, vol. 17, no. 3, pp. 2054-2067, March 2018.
[20] Y. Zhang, H. M. Wang, T. X. Zheng, and Q. Yang, “Energy-Efficient Transmission Design in Non-Orthogonal Multiple Access,” IEEE Transactions on Vehicular Technology, vol. 66, no. 3, pp. 2852-2857, March 2017.
[21] J. Zhu, J. Wang, Y. Huang, S. He, X. You, and L. Yang, “On Optimal Power Allocation for Downlink Non-Orthogonal Multiple Access Systems,” IEEE Journal on Selected Areas in Communications, vol. 35, no. 12, pp. 2744-2757, December 2017.
[22] R. Jain, D. M. Chiu, and W. R. Hawe, “A Quantitative Measure of Fairness and Discrimination for Resource Allocation in Shared Computer Systems,” DEC Research Report TR-301, Digital Equipment Corporation, Hudson, MA, USA, 1984.
[23] Z. Ding, Z. Yang, P. Fan, and H. V. Poor, “On the Performance of Non-Orthogonal Multiple Access in 5G Systems with Randomly Deployed Users,” IEEE Signal Processing Letters, vol. 21, no. 12, pp. 1501-1505, December 2014.
[24] S. Timotheou and I. Krikidis, “Fairness for Non-Orthogonal Multiple Access in 5G Systems,” IEEE Signal Processing Letters, vol. 22, no. 10, pp. 1647-1651, October 2015.
[25] Y. Yuan, Z. Yuan, and L. Tian, “Non-Orthogonal Multiple Access (NOMA) for Next-Generation Wireless Communication Systems,” ZTE Communications, vol. 14, no. 4, pp. 42-48, October 2016.
[26] K. Higuchi and A. Benjebbour, “Non-Orthogonal Multiple Access (NOMA) with Successive Interference Cancellation for Future Radio Access,” IEICE Transactions on Communications, vol. E98-B, no. 3, pp. 403-414, March 2015.
[27] H. Tabassum, M. S. Ali, E. Hossain, M. J. Hossain, and D. I. Kim, “Uplink vs. Downlink NOMA in Cellular Networks: Challenges and Research Directions,” IEEE Network, vol. 31, no. 3, pp. 170-176, May 2017.
[28] X. Yue, Y. Liu, S. Kang, A. Nallanathan, and Z. Ding, “Spatially Random Relay Selection for Full/Half-Duplex Cooperative NOMA Networks,” IEEE Transactions on Communications, vol. 66, no. 8, pp. 3294-3308, August 2018.
[29] Z. Wei, D. W. K. Ng, J. Yuan, and H. M. Wang, “Optimal Resource Allocation for Power-Domain NOMA in Downlink Systems,” IEEE Transactions on Communications, vol. 65, no. 6, pp. 2481-2495, June 2017.
[30] 3GPP TR 38.912, “Study on New Radio (NR) Access Technology,” 3rd Generation Partnership Project, Technical Specification Group Radio Access Network, Release 14, Version 14.0.0, March 2017.
[31] Z. Ding, Z. Yang, P. Fan, and H. V. Poor, “On the performance of non-orthogonal multiple access in 5G systems with randomly deployed users,” IEEE Signal Processing Letters, vol. 21, no. 12, pp. 1501–1505, 2014.
[32] Y. Saito et al., “Non-orthogonal multiple access (NOMA) for cellular future radio access,” IEEE Vehicular Technology Conference (VTC), 2013.
[33] T. S. Rappaport, Wireless Communications: Principles and Practice, 2nd ed., Prentice Hall, 2002.
You can download the Project files here: Download files now. (You must be logged in).


Responses