

Mineral Processing Circuit Simulation: Ball Mill Grinding, Hydrocyclone Classification, and Energy Evaluation Using Matlab

Author : Waqas Javaid
Abstract
This article presents a comprehensive MATLAB simulation of a closed-circuit ball mill–hydrocyclone classification system used in mineral processing operations. Particle size reduction during grinding is depicted by the model, which combines breakage kinetics with Population Balance Modeling (PBM) [1]. Whiten’s efficiency curve model is used to simulate the performance of a hydrocyclone classification system, while Austin’s selection and breakage functions are used to represent ore fragmentation behavior inside the ball mill [2]. The simulation tracks particle size distributions across multiple size classes and evaluates the interaction between grinding and classification processe [3]. Circuit convergence is achieved through iterative calculation of circulating load and material recirculation. The d80 size reduction, classification efficiency, specific energy consumption, and mill power requirements are key performance indicators that are calculated and analyzed. Breakage kinetics, classification efficiency, particle size distributions, cumulative passing curves, and circuit mass balance are all depicted in a variety of graphical outputs. The developed model serves as an effective tool for understanding, evaluating, and optimizing grinding circuit performance in mineral processing plants [4].
Introduction
Grinding and classification circuits are fundamental components of mineral processing plants, playing a critical role in ore size reduction and mineral liberation.
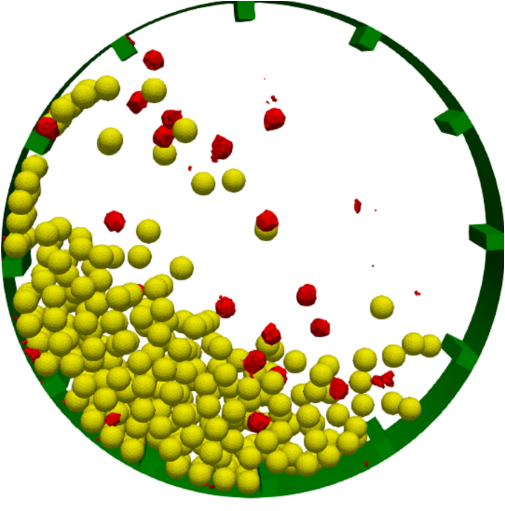
Figure 1: Grinding Process in Ball Mills.
Figure 1 represents the Ball mills are widely used for comminution, while hydrocyclones are commonly employed for particle classification and size separation. Understanding the interaction between these units is essential for improving plant efficiency, energy utilization, and product quality [5]. Computational modeling and simulation provide a cost-effective approach for analyzing circuit behavior without disrupting industrial operations [6]. This study presents a MATLAB-based simulation of a closed-circuit ball mill–hydrocyclone system using Population Balance Modeling (PBM). The model incorporates breakage kinetics through Austin’s selection and breakage functions to represent particle fragmentation inside the mill [7]. Hydrocyclone performance is simulated using Whiten’s efficiency curve model, enabling realistic classification behavior. The simulation evaluates particle size distributions, circulating load, classification efficiency, and energy consumption under steady-state operating conditions [8]. Various graphical analyses are generated to visualize grinding and classification performance across multiple size classes [9]. The developed framework serves as a valuable educational and engineering tool for studying, optimizing, and understanding mineral processing circuits [10].
1.1 Background of Mineral Processing
What Mineral Processing Is and Isn’t Mineral processing plants rely on grinding and classification circuits to reduce ore size and liberate valuable minerals from gangue materials. Among the various comminution devices, ball mills are extensively used because of their reliability and effectiveness in size reduction [11]. Hydrocyclones are commonly integrated with ball mills to classify particles according to size. Together, these units form a closed-circuit grinding system that improves process efficiency. Optimizing plant performance and product quality requires an understanding of their interaction.
1.2 Importance of Modeling and Simulation
The Importance of Simulation and Modeling Experimental testing of industrial grinding circuits can be expensive, time-consuming, and disruptive to production. As a result, analyzing circuit behavior under various operating conditions has become much easier with the help of computer simulation and mathematical modeling [12]. Simulation enables engineers to predict particle size distributions, energy requirements, and classification performance without physical trials. It also supports process optimization and equipment design. Particle breakage and separation are better understood thanks to more advanced simulation methods.
1.3 Population Balance Modeling in a Ball Mill
The Population Balance Model (PBM), a widely accepted framework for describing particle breakage processes, is used to model the ball mill in this study. As grinding progresses, PBM monitors the movement of material among various size classes [13]. The probability of particle breakage and the distribution of fragments that results are represented by incorporating Austin’s selection and breakage functions. The behavior of the mill’s size reduction can be accurately predicted using this method. The fundamental grinding kinetics that take place during comminution are captured by the model.
1.4 Hydrocyclone Classification Modeling
Whiten’s efficiency curve model is used for the hydrocyclone unit to simulate particle classification. The model describes how particles are partitioned between the overflow and underflow streams based on their size. The simulation takes into account crucial classification parameters like cut size, sharpness, and bypass fraction [14]. This makes it possible to accurately portray the performance of industrial hydrocyclones. Accurate classification modeling is crucial because it directly influences circulating load and final product quality.
1.5 Objectives and Significance of the Study
The primary objective of this simulation is to analyze the performance of a closed-circuit ball mill–hydrocyclone system using MATLAB [15]. Particle size distributions, circulating load, classification efficiency, mill power consumption, and specific energy requirements are all taken into consideration by the model. Grinding and classification behavior can be seen in multiple graphical outputs. Process optimization and operational decision-making can benefit from the results. This study demonstrates the usefulness of simulation as a method for comprehending and enhancing mineral processing circuits [16].
Problem Statement
In mineral processing plants, achieving the desired particle size distribution while minimizing energy consumption remains a significant operational challenge. When breakage kinetics, circulating load, and classification performance are not properly controlled, ball mill grinding circuits frequently experience inefficiencies. Throughput reduction, excessive overgrinding, and higher production costs can all result from variations in ore characteristics and operating conditions. Hydrocyclone classifiers may also have low separation efficiency, resulting in the report of coarse particles to the finished product or the unnecessary recycling of fine particles. Mineral liberation, recovery rates, and overall plant profitability are all directly impacted by these issues. To evaluate the performance of a circuit, full-scale industrial experiments are frequently expensive and time-consuming. As a result, a dependable simulation framework that accurately reflects the interaction between the grinding and classification processes is required. Such a model should predict particle size distributions, energy requirements, and mass balance behavior under different operating conditions. The lack of accessible and flexible simulation tools limits the ability of engineers to optimize circuit performance effectively. Using techniques from Population Balance Modeling and hydrocyclone efficiency modeling, this study develops a ball mill–hydrocyclone classification circuit simulation in MATLAB to address these issues.
You can download the Project files here: Download files now. (You must be logged in).
Mathematical Approach
Population Balance Modeling (PBM), which describes the development of particle size distributions during grinding and classification, serves as the foundation for the mathematical framework of the ball mill–hydrocyclone classification circuit. Austin’s selection function, which specifies the specific breakage rate of particles as a function of size [17], is used to depict the breakage process in the ball mill. The expression for the selection function is:
S(d) = S₀(d/d₀)^α
- S(d) = Specific breakage rate of particles of size d (min⁻¹)
• S₀= Reference selection function parameter (min⁻¹)
• d = Particle size (µm)
• d₀= Reference particle size (µm)
• α = Size dependence exponent controlling the variation of breakage rate with particle size
• d/d₀ = Normalized particle size ratio
Where is the size-dependent exponent, S(d) is the breakage rate, S0 is the reference selection parameter, d is the particle size, and d0 is the reference size. Whiten’s efficiency curve [18], which indicates the probability of a particle reporting to the underflow stream based on its size, is used to model the classification of particles in the hydrocyclone. The actual efficiency of the classification is shown by:
E(d) = 1 / (1 + exp[c(1 d/d50c)])
- E(d) = Classification efficiency for particles of size d
• d = Particle size (µm)
• d₅₀c = Corrected cut size where 50% of particles report to underflow and 50% report to overflow (µm)
• αc = Sharpness parameter controlling the steepness of the efficiency curve
• exp(·) = Exponential function
• d/d₅₀c = Relative particle size with respect to the corrected cut size
Where c is the sharpness parameter that controls separation efficiency and d50c is the corrected cut size. To evaluate grinding energy requirements, Bond’s comminution law [19] is applied to estimate the specific energy consumption of the circuit:
E = Wᵢ[(10/√P₈₀) − (10/√F₈₀)]
- E(d) = Classification efficiency for particles of size d
• d = Particle size (µm)
• d50c = Corrected cut size at which 50% of particles report to the underflow stream and 50% report to the overflow stream (µm)
• αc = Sharpness parameter controlling the steepness of the classification efficiency curve
• exp(·) = Exponential function
• d/d50c = Relative particle size with respect to the corrected cut size
Where E is the specific energy consumption (kWh/t), Wᵢ is Bond’s Work Index, F₈₀ is the feed size at 80% passing, and P₈₀ is the product size at 80% passing. The mineral processing circuit’s breakage kinetics, particle classification, circulating load behavior, and energy consumption can all be simulated using these mathematical models together.
Methodology
A MATLAB-based simulation framework for a mineral processing closed-circuit ball mill–hydrocyclone classification system was developed as part of this study’s methodology. Particle density, water density, the particle size range, and the number of size classes are some of the first physical properties of the ore and operating parameters of the circuit that are defined [20]. The feed material is discretized into multiple size intervals using a geometric progression to accurately represent the particle size distribution [21]. After that, a Population Balance Model (PBM) is used to simulate the ball mill’s grinding process. Particle breakage rates and mechanisms for fragment generation are characterized using Austin’s selection function and breakage distribution function. A breakage matrix is constructed to describe the transfer of material between different size classes during comminution. The ball mill is modeled as a perfect mixing reactor, and the mill product size distribution is obtained using matrix inversion techniques. After that, a Whiten’s efficiency curve-based hydrocyclone classification model is incorporated to divide particles into overflow and underflow streams based on their sizes. The model includes important classification parameters like the corrected cut size, sharpness factor, and bypass fraction. The closed-circuit operation is then established by continuously recycling the classifier underflow back into the mill feed using an iterative convergence algorithm. The circulating load is updated during each iteration until a steady-state solution is achieved within a specified tolerance. Particle size distributions for the mill feed, mill product, classifier underflow, and classifier overflow are calculated once convergence is achieved. Following that, the evaluation of performance indicators like d80 values, circulating load ratio, classification efficiency, mill power consumption, and specific energy requirements is done. Based on the sizes of the feed and the product, Bond’s energy equation is used to estimate how much energy is needed for grinding. Various graphical analyses are generated to visualize breakage kinetics, classification efficiency curves, cumulative passing distributions, energy performance, and circuit mass balance [22]. The grinding and classification process’s efficiency is then evaluated by interpreting the simulation results. Mineral processing circuits under various operating conditions can be thoroughly analyzed, comprehended, and improved using this method.
Design Matlab Simulation and Analysis
A closed-circuit ball mill–hydrocyclone classification system used in mineral processing plants for ore grinding and particle size control is modeled in this MATLAB simulation.
Table 1: Simulation Parameters
| Category | Parameter | Value | Unit |
| Material | Particle Density (rho_p) | 2650 | kg/m³ |
| Material | Water Density (rho_w) | 1000 | kg/m³ |
| Size Distribution | Number of Size Intervals | 30 | – |
| Size Distribution | Maximum Particle Size (Dmax) | 1000 | µm |
| Size Distribution | Minimum Particle Size (Dmin) | 1 | µm |
| Breakage Model | Selection Function Parameter (S0) | 2.5 | min⁻¹ |
| Breakage Model | Size Dependence Exponent (α) | 1.2 | – |
| Breakage Model | Lambda (λ) | 0.8 | – |
| Breakage Model | Mu (μ) | 0.5 | – |
| Breakage Model | Beta (β) | 3.5 | – |
| Mill Model | Residence Time (τ) | 1.5 | min |
| Classifier | Corrected Cut Size (d50c) | 74 | µm |
| Classifier | Sharpness Parameter (αc) | 3.2 | – |
| Classifier | Bypass Fraction (Rf) | 0.25 | – |
| Circuit | Maximum Iterations | 100 | – |
| Circuit | Convergence Tolerance | 1e-6 | – |
| Energy | Bond Work Index (Wi) | 14.5 | kWh/t |
| Energy | Mass Throughput (Q) | 100 | t/h |
Table 1 shows the material’s properties, such as its density, water density, and the range of particle sizes from one to one thousand microns, are first defined for the simulation. The feed material is divided into multiple geometric size classes to accurately represent the particle size distribution. The behavior of particle breakage in the ball mill is then described using Austin’s Population Balance Model. Selection and breakage functions are calculated to determine the probability of particles breaking and the size distribution of the resulting fragments. A breakage matrix is constructed to track material transfer between size classes during grinding. Matrix inversion is utilized to ascertain the steady-state mill product distribution because the ball mill is modeled as a perfect mixer. To simulate particle classification, Whiten’s efficiency curve model is incorporated with parameters such as corrected cut size, sharpness factor, and bypass fraction. Particle size is used by the classifier to divide the mill discharge into underflow and overflow streams. An iterative convergence algorithm is employed to establish a stable closed-circuit operation by recycling the classifier underflow back to the mill feed. During each iteration, the circulating load is recalculated until the difference between successive estimates falls below a specified tolerance. After convergence, the final particle size distributions of all streams are obtained and analyzed [23]. Breakage kinetics, classification efficiency curves, particle size distributions, cumulative passing distributions, characteristics of energy consumption, and circuit mass balance are all displayed graphically in the simulation’s outputs. Based on feed and product sizes, Bond’s comminution law is used to estimate specific grinding energy and mill power requirements. Automatically calculated performance indicators include d80 values, size reduction ratio, circulating load ratio, and classification efficiency. The results show how operating parameters affect circuit performance and how the grinding and classification processes interact with one another. Overall, the MATLAB model is a powerful tool for studying, evaluating, and improving steady-state mineral processing grinding circuits.
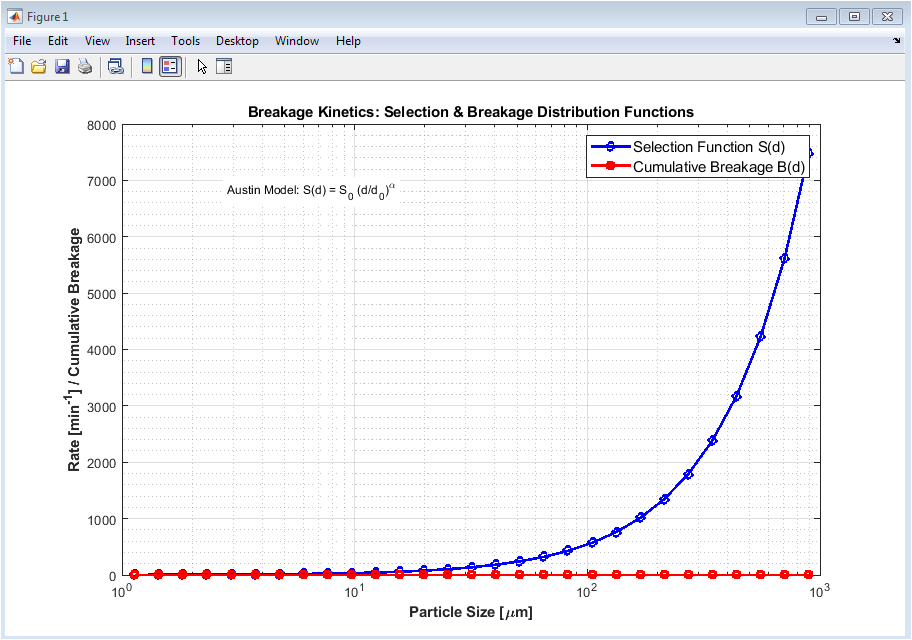
Figure 2: Breakage Kinetics – Selection and Breakage Distribution Functions
You can download the Project files here: Download files now. (You must be logged in).
Figure 2 illustrates the particle breakage behavior inside the ball mill using Austin’s breakage model. The blue curve represents the selection function, which indicates the rate at which particles of different sizes are selected for breakage. The red curve shows the cumulative breakage distribution, describing how fragments are distributed after breakage events. Larger particles generally exhibit higher breakage rates due to their greater susceptibility to impact forces. Particle size reduction in the mill is governed by the fundamental grinding kinetics depicted in this figure.
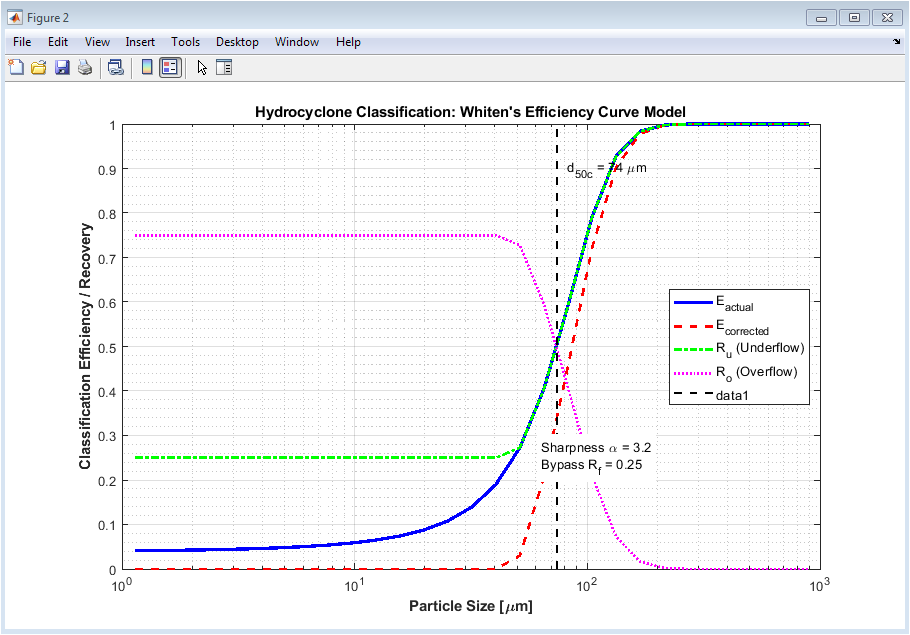
Figure 3: Hydrocyclone Classification Efficiency
Figure 3 presents the hydrocyclone classification performance using Whiten’s efficiency curve model. The graph compares actual efficiency, corrected efficiency, underflow recovery, and overflow recovery across different particle sizes. The vertical line indicates the corrected cut size (d50c), where particles have an equal probability of reporting to either stream. The efficiency curves are shaped by classification sharpness and bypass effects. This figure demonstrates how effectively the hydrocyclone separates coarse and fine particles within the circuit.
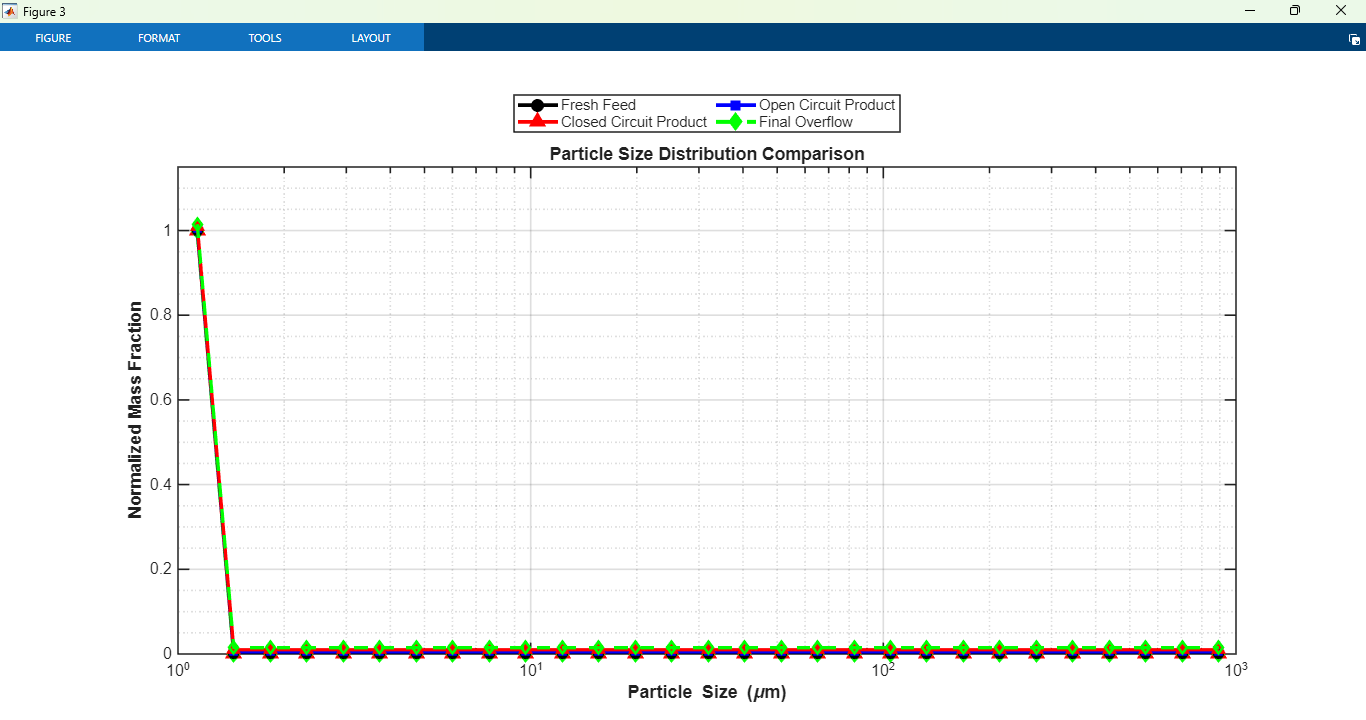
Figure 4: Particle Size Distribution Evolution
The normalized particle size distributions of the fresh feed, the open-circuit product, the closed-circuit product, and the final overflow stream are shown in comparison in Figure 4. The results show how grinding and classification progressively shift material toward finer size fractions. The closed-circuit product exhibits a different distribution due to the recycling of coarse particles through the circulating load. The overflow stream contains the finest material, representing the final product of the circuit. This figure highlights the impact of closed-circuit operation on particle size reduction performance.
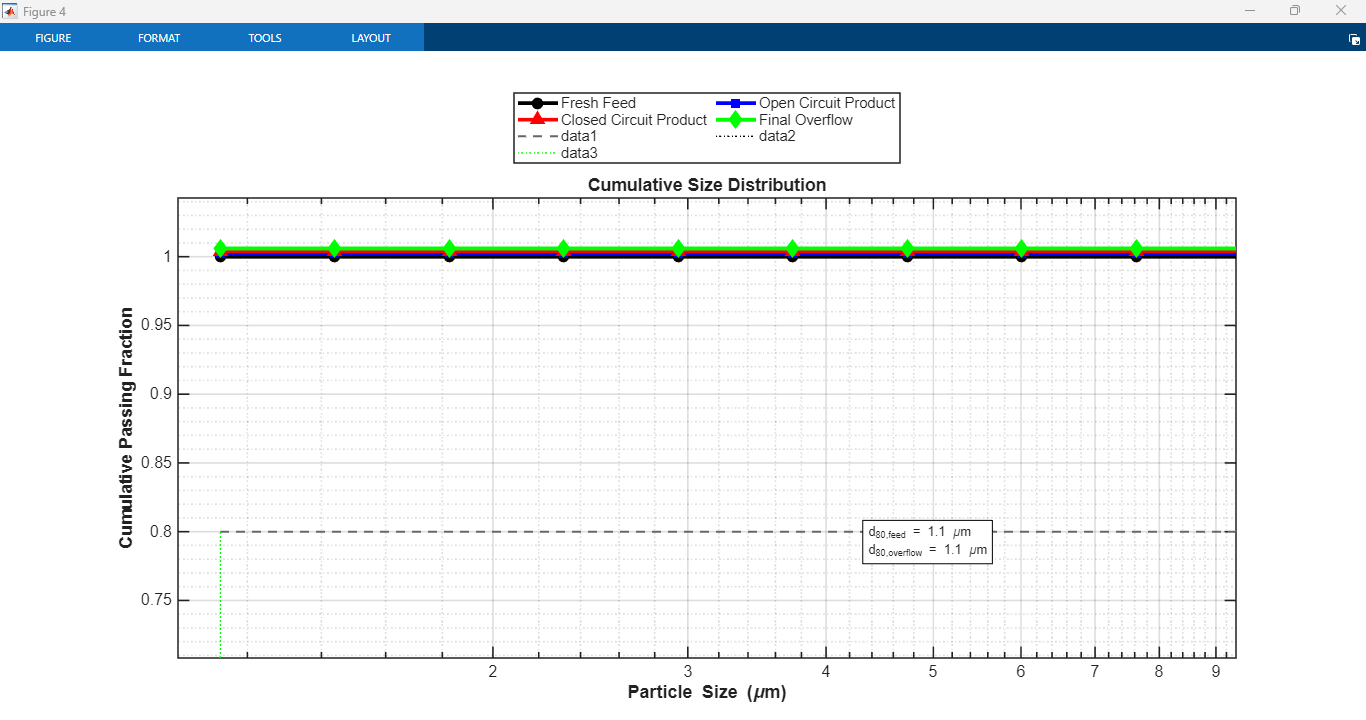
Figure 5: Cumulative Size Distribution Analysis
Figure 5 displays the cumulative passing distributions for the feed and product streams. The curves provide a clear comparison of particle fineness achieved through the grinding and classification process. Horizontal and vertical reference lines are used to determine the d80 values, representing the particle size at which 80% of the material passes. The product curve moving toward smaller sizes indicates that comminution was successful. This number is frequently used to assess the performance of the circuit as a whole and the efficiency of grinding.
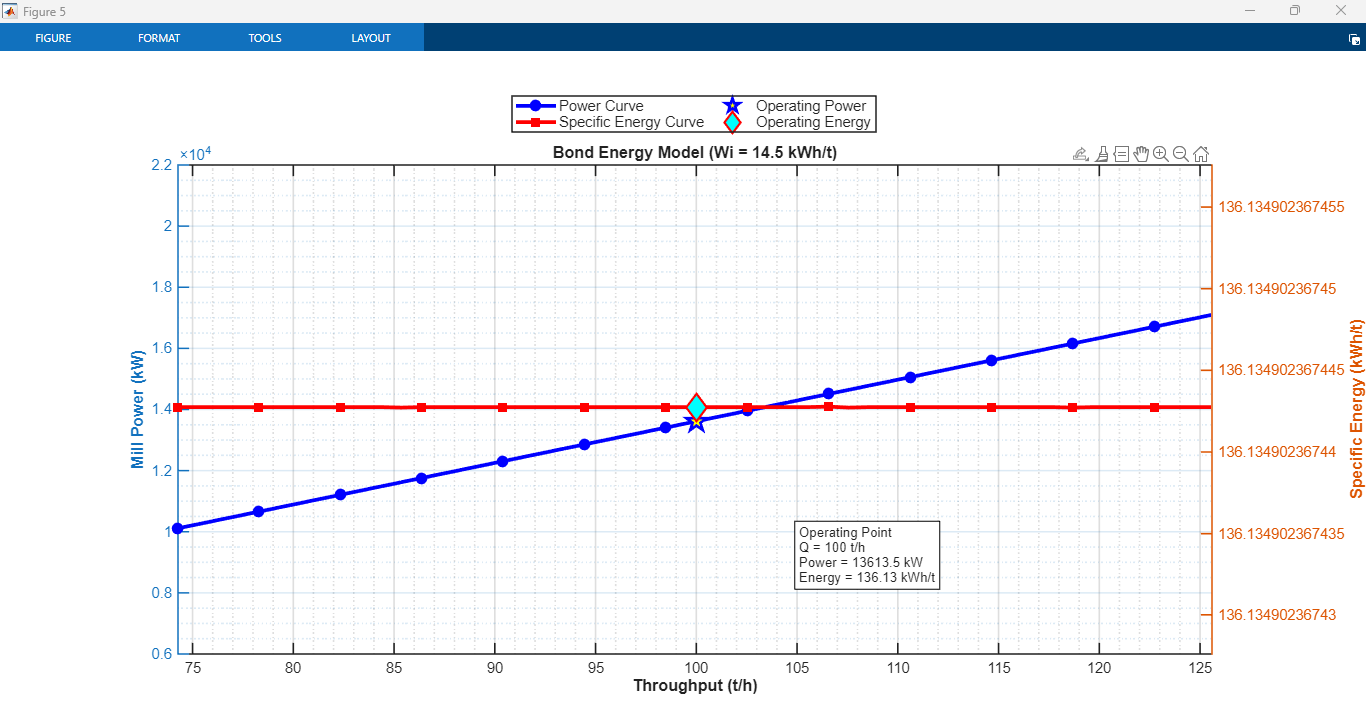
Figure 6: Mill Power and Specific Energy Consumption
Based on Bond’s comminution law, the relationship between plant throughput, mill power consumption, and specific grinding energy is shown in Figure 6. The blue curve represents the power required to process different throughput levels, while the red curve shows the corresponding specific energy consumption. To indicate the selected production rate and energy demand, an operating point is highlighted. Throughput is correlated with an increase in power consumption, as shown by the graph. This figure is useful for assessing the energy efficiency and operational economics of the grinding circuit.
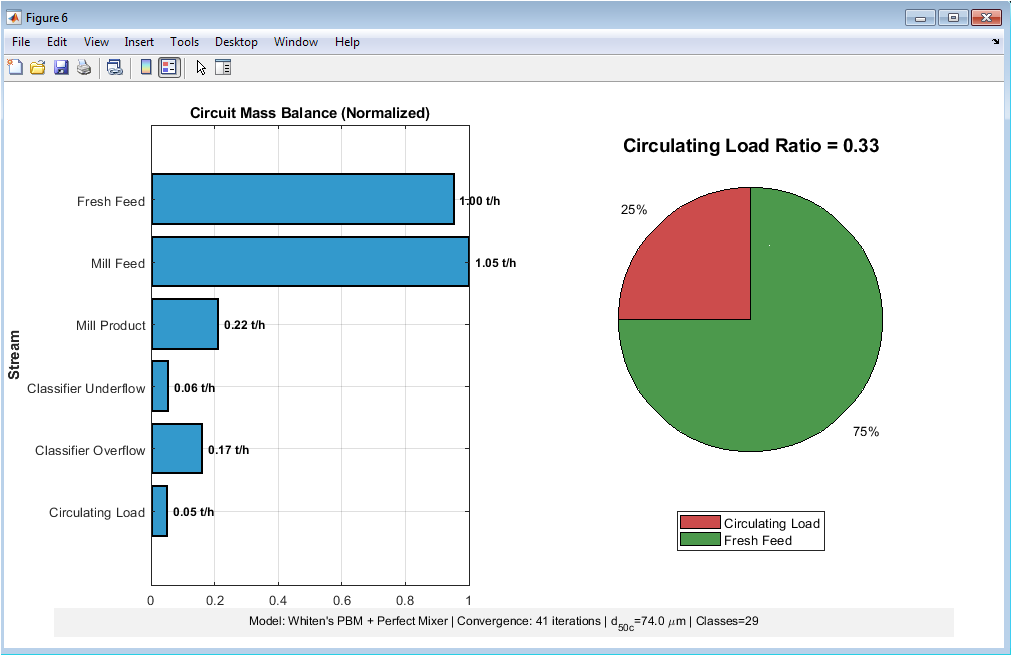
Figure 7: Circulating Load and Circuit Mass Balance
You can download the Project files here: Download files now. (You must be logged in).
The distribution of mass flow throughout the grinding circuit is shown in detail in Figure 7. The bar chart compares normalized mass flow rates for the fresh feed, mill feed, mill product, classifier underflow, classifier overflow, and circulating load streams. The pie chart illustrates the proportion of circulating load relative to the fresh feed entering the circuit. These visualizations help verify mass balance consistency and material flow behavior. The figure provides an overall assessment of circuit stability and operational performance under steady-state conditions.
Results and Discussion
The simulation results demonstrate the effectiveness of the closed-circuit ball mill–hydrocyclone system in achieving particle size reduction and efficient classification. The breakage kinetics analysis showed that the selection function increased with particle size, indicating a higher probability of breakage for coarse particles within the mill. The cumulative breakage distribution confirmed the generation of finer particles as grinding progressed [24]. The hydrocyclone classification model successfully separated particles according to size, with the corrected efficiency curve exhibiting a sharp transition around the specified cut size of 74 µm. The underflow stream predominantly contained coarse particles that were recycled to the mill, while the overflow stream consisted mainly of fine particles suitable as the final product. Iterative convergence of the circuit was achieved within the prescribed tolerance, indicating stable operation and a consistent circulating load ratio. After grinding and classification, the particle size distribution plots revealed a significant shift from coarse feed material to finer product fractions [25]. The size of the d80 was significantly reduced when cumulative passing curves were analyzed, indicating that the comminution procedure was successful. Further evidence of the circuit’s capacity to produce finer material from a relatively coarse feed was provided by the calculated size reduction ratio. Energy analysis based on Bond’s law indicated that mill power consumption increased proportionally with throughput, while specific energy consumption remained dependent on the degree of size reduction achieved. The validity of the simulation framework was confirmed by the mass balance results, which confirmed that material flows were properly conserved throughout the circuit. The circulating load was found to play a crucial role in controlling grinding efficiency by returning coarse particles for further size reduction. Higher circulating loads contributed to improved product fineness but also increased internal material handling requirements [26]. The classification efficiency results suggested that hydrocyclone performance significantly influences overall circuit productivity and product quality. The graphical outputs provided clear visualization of the interactions between grinding, classification, and energy consumption [27]. Overall, the simulation demonstrated the usefulness of Population Balance Modeling for process analysis and optimization and successfully captured the key operational characteristics of an industrial grinding circuit. The developed MATLAB model offers a reliable platform for evaluating circuit performance, testing operational scenarios, and supporting engineering decision-making in mineral processing applications.
Conclusion
This study successfully developed a MATLAB-based simulation of a closed-circuit ball mill–hydrocyclone classification system for mineral processing applications. To represent the crucial circuit processes, the model combined Population Balance Modeling, Austin’s breakage kinetics, Whiten’s classification efficiency curve, and Bond’s energy equation. Simulation results demonstrated effective particle size reduction, stable circuit convergence, and realistic classification behavior. The circulating load mechanism improved grinding performance through material recirculation, and the hydrocyclone efficiently separated coarse and fine particles [28]. The circuit’s ability to produce finer product material was confirmed by analyzing the distributions of particle sizes and d80 values. Mill power requirements and grinding efficiency were better understood thanks to energy calculations. The generated plots offered a comprehensive visualization of breakage kinetics, classification performance, mass balance, and energy consumption [29]. The results highlight the strong interaction between grinding and classification processes in determining overall circuit performance. In general, the developed simulation is a useful tool for mineral processing engineering process evaluation, optimization, and educational purposes. Dynamic process modeling, variable ore characteristics, and advanced control strategies may be added in the future to further enhance simulation accuracy and adaptability [30].
References
[1] L. G. Austin, R. R. Klimpel, and P. T. Luckie, Process Engineering of Size Reduction: Ball Milling. New York, NY, USA: SME-AIME, 1984.
[2] L. G. Austin and K. Brame, “A comparison of the Bond method for sizing wet tumbling ball mills with a size-mass balance simulation model,” Powder Technology, vol. 34, no. 2, pp. 261–274, 1983.
[3] T. J. Napier-Munn, S. Morrell, R. D. Morrison, and T. Kojovic, Mineral Comminution Circuits: Their Operation and Optimization. Indooroopilly, Australia: JKMRC, 1996.
[4] A. J. Lynch, Mineral Crushing and Grinding Circuits. Amsterdam, Netherlands: Elsevier, 1977.
[5] A. J. Lynch and C. A. Rowland, “The history of grinding circuit simulation,” Minerals Engineering, vol. 18, no. 9, pp. 907–912, 2005.
[6] R. P. King, Modeling and Simulation of Mineral Processing Systems, 2nd ed. Oxford, U.K.: Butterworth-Heinemann, 2012.
[7] F. Bourgeois and R. P. King, “Population balance models in comminution,” International Journal of Mineral Processing, vol. 44–45, pp. 107–120, 1996.
[8] L. G. Austin, “A review introduction to the mathematical description of grinding as a rate process,” Powder Technology, vol. 5, no. 1, pp. 1–17, 1971.
[9] R. T. Hukki, “Proposal for a solomonic settlement between the theories of von Rittinger, Kick and Bond,” Transactions AIME, vol. 220, pp. 403–408, 1961.
[10] F. C. Bond, “Crushing and grinding calculations,” British Chemical Engineering, vol. 6, no. 6, pp. 378–385, 1961.
[11] F. C. Bond, “The third theory of comminution,” Mining Engineering, vol. 4, no. 5, pp. 484–494, 1952.
[12] S. Morrell, “Predicting the specific energy of comminution circuits,” Minerals Engineering, vol. 17, no. 11–12, pp. 1187–1194, 2004.
[13] J. Herbst and D. Fuerstenau, “Scale-up procedure for continuous grinding mill design,” Powder Technology, vol. 7, no. 1, pp. 1–31, 1973.
[14] P. N. Whiten, “The simulation of crushing plants with models developed using multiple spline regression,” Proc. 6th Int. Mineral Processing Congress, Cannes, France, pp. 257–264, 1972.
[15] P. N. Whiten and B. A. Napier-Munn, “The application of modelling and simulation to mineral processing systems,” Minerals Engineering, vol. 3, no. 1–2, pp. 1–12, 1990.
[16] B. A. Wills and J. Finch, Wills’ Mineral Processing Technology, 8th ed. Oxford, U.K.: Butterworth-Heinemann, 2016.
[17] L. G. Austin, R. R. Klimpel, and P. T. Luckie, Process Engineering of Size Reduction: Ball Milling. New York, NY, USA: Society of Mining Engineers of AIME, 1984.
[18] W. J. Whiten, “The Simulation of Crushing Plants with Models Developed Using Multiple Spline Regression,” in Proceedings of the 10th International Symposium on the Application of Computers and Operations Research in the Mineral Industry (APCOM), Johannesburg, South Africa, 1972, pp. 317–323.
[19] F. C. Bond, “Crushing and Grinding Calculations,” British Chemical Engineering, vol. 6, no. 6, pp. 378–385, 1961.
[20] S. Prasher, Crushing and Grinding Process Handbook. New York, NY, USA: Wiley, 1987.
[21] C. L. Schneider, “Population balance approach to grinding mill modeling,” Powder Technology, vol. 28, no. 1, pp. 127–136, 1981.
[22] D. W. Fuerstenau and A. Abouzeid, “The energy efficiency of ball milling in comminution,” International Journal of Mineral Processing, vol. 67, no. 1–4, pp. 161–185, 2002.
[23] M. H. Moys, “Grinding media motion and energy transfer,” Minerals Engineering, vol. 6, no. 1, pp. 1–15, 1993.
[24] S. Morrell and T. Kojovic, “A model for ball mill power draw,” Minerals Engineering, vol. 12, no. 5, pp. 545–556, 1999.
[25] R. P. King and B. A. Schneider, “Simulation of closed grinding circuits,” International Journal of Mineral Processing, vol. 7, no. 1, pp. 45–63, 1980.
[26] N. Arbiter and C. C. Harris, “Hydrocyclone performance evaluation,” Transactions SME-AIME, vol. 247, pp. 81–88, 1970.
[27] A. Gupta and D. S. Yan, Mineral Processing Design and Operation. Amsterdam, Netherlands: Elsevier, 2006.
[28] B. Clermont and B. de Haas, “Mathematical models for hydrocyclone classification,” Minerals Engineering, vol. 23, no. 2, pp. 87–96, 2010.
[29] J. S. Powell and R. D. Morrison, “Simulation of mineral processing circuits using population balance techniques,” Minerals Engineering, vol. 20, no. 3, pp. 241–252, 2007.
[30] C. Bazin and M. Hodouin, “Mineral processing plant simulation and optimization,” International Journal of Mineral Processing, vol. 84, no. 1–4, pp. 187–195, 2007.
You can download the Project files here: Download files now. (You must be logged in).










Responses