

Using MATLAB, Temperature, Microbial Growth, and Moisture Dynamics to Model the Decline in Meat Quality
Author : Waqas Javaid
Abstract
A multi-physics approach to analyzing meat processing that incorporates thermal dynamics, microbial growth, moisture diffusion, and quality degradation is presented in this study as an advanced MATLAB-based simulation framework. To capture the meat’s temperature distribution, a three-dimensional finite difference model takes into account both internal conduction and external convective heat transfer. To predict microbial growth in relation to temperature and time, the model incorporates a modified Gompertz function [1]. Diffusion principles are used to simulate moisture loss, allowing for the evaluation of changes in water content during processing. Additionally, the study uses CIE Lab parameters to investigate color evolution and shear force analysis to investigate texture degradation. To evaluate freshness, chemical quality indicators such as pH and total volatile basic nitrogen (TVB-N) are also modeled. For the purpose of overall evaluation, all parameters are combined into a comprehensive quality index [2]. The simulation offers comprehensive temporal and spatial insights into how meat behaves during processing. The results show that chemical, biological, and thermal factors are highly interdependent. Food safety, quality control, and industrial meat processing can all benefit greatly from this framework [3].
Introduction
With the rise in population and shifts in consumer expectations, there has been a significant increase in the global demand for safe, high-quality meat products.
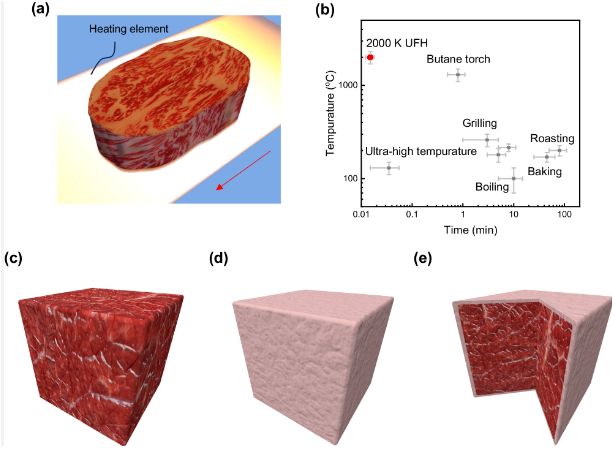
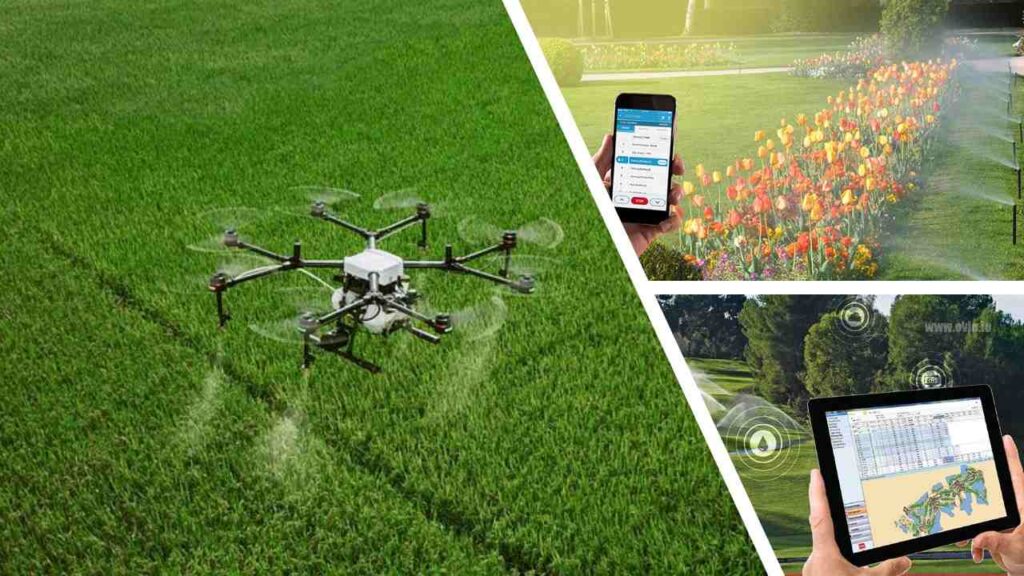
Figure 1: Behavior of meat under a variety of processing conditions.
Figure 1 represents the food industry faces a significant challenge in maintaining meat quality throughout the processing, storage, and distribution processes. Even though they are dependable, conventional experimental techniques are often time-consuming, labor-intensive, and limited in their capacity to capture intricate interactions between biological, chemical, and physical processes. As a consequence of this, there is a growing demand for sophisticated computational tools that are able to simulate and predict the behavior of meat under a variety of processing conditions [4]. A powerful alternative is mathematical modeling and simulation, which enables researchers to efficiently optimize processing strategies and analyze multiple variables simultaneously [5]. The distribution of temperatures, the growth of microorganisms, the amount of moisture in the meat, and chemical changes are all important aspects of meat processing that influence product safety and quality. Heat transfer, microbial activity, and enzymatic reactions are all affected by temperature variations [6]. Similarly, moisture loss has an impact on texture, weight, and consumer acceptance, and biochemical changes like a decrease in pH and degradation of protein indicate levels of freshness. Integrated multi-physics models that combine these complex phenomena into a single framework have been made possible by recent advancements in computational methods, particularly through the use of MATLAB. Meat processing systems can be thoroughly analyzed spatially and temporally with these models [7]. In addition, the concept of a digital twin, in which virtual models replicate actual processes for monitoring and optimization, is emerging as a revolutionary approach in food engineering. Simulations can provide early warnings of spoilage and safety risks by incorporating predictive models for microbial kinetics and quality indices [8]. The development of a comprehensive simulation model that takes into account the combined effects of heat transfer, moisture diffusion, microbial growth, and quality degradation in meat processing is the primary objective of this study [9]. In addition to enhancing our comprehension of the underlying mechanisms, the proposed method also aids in industrial decision-making. In the end, incorporating computational modeling into meat processing may result in enhanced food safety standards, decreased waste, and improved product quality [10].
1.1. Importance of Meat Processing
The global food supply and nutrition are greatly impacted by the meat industry. The demand for safe and high-quality meat products continues to rise rapidly with population growth. Today’s consumers are more aware of the nutritional value, freshness, and safety of food. Industries have faced significant pressure as a result to uphold stringent quality standards. Handling, storing, and preserving meat are just a few of the stages in meat processing [11]. The quality of the finished product is directly impacted by each stage. Contamination and spoilage can result if the processing environment is not ideal. As a result, it is essential to maintain optimal processing parameters. For better control, modern industries are moving toward scientific methods. In this area, computational modeling is emerging as an effective solution.
1.2. Challenges in Traditional Methods
Meat quality evaluation frequently makes use of conventional experimental methods. However, these strategies frequently require a lot of time and money [12]. They necessitate repeated trials, laboratory analysis, and physical testing. Additionally, analyzing multiple parameters simultaneously is challenging. It is challenging to experimentally capture the intricate interactions that occur between microbes, moisture, and temperature. Results can also be impacted by variations in the environment and human error. These limitations reduce efficiency and scalability. Industries look for faster and more dependable alternatives as a result. Many of these obstacles are overcome by simulation-based strategies. They make accurate predictions at a lower cost and require less effort [13].
1.3. Role of Computational Modeling
Food engineering and processing have been transformed by computational modeling. Mathematical equations can be used to simulate real-world systems thanks to this. Models can depict changes in temperature, biology, and chemicals during meat processing. Without the use of actual experiments, these models assist in comprehending system behavior [14]. Due to its strong numerical capabilities, MATLAB is widely used. It makes it possible to efficiently solve complicated differential equations. Engineers can visualize results through graphs and 3D plots. Processing conditions can also be improved with modeling. It reduces industries’ reliance on trial-and-error strategies. It improves process efficiency and decision-making in general.
1.4. Heat Transfer in Meat Processing
One of the most important aspects of meat processing is temperature. Convection at the surface and conduction within the meat both play a role in heat transfer. Controlling the temperature effectively prevents microbial growth and ensures safety. Undercooking or spoilage can result from an uneven temperature distribution [15]. Accurate 3D temperature variations are accurately simulated by computational models. For numerical solutions, these models use finite difference techniques. They aid in the long-term monitoring of core and surface temperatures. When it comes to cooking, freezing, and chilling, this information is absolutely necessary. It guarantees that the meat will safely reach the desired temperature. Therefore, quality control relies heavily on thermal modeling.
1.5. Microbial Growth Dynamics
Meat spoilage is primarily caused by microbial activity. Under favorable temperature conditions, bacteria expand rapidly.
Table 1: Microbial Growth Parameters
| Parameter | Value |
| Minimum Temp (°C) | -2 |
| Optimal Temp (°C) | 37 |
| Max Growth Rate (1/h) | 0.8 |
| Initial Load (log CFU/g) | 2 |
| Max Load (log CFU/g) | 8.5 |
Table 1 represents the food safety depends on being able to predict microbial growth. The Gompertz equation and other mathematical models are frequently utilized. The lag, exponential, and stationary phases of growth are all portrayed by these models. Model accuracy is improved by growth rates that depend on temperature. Simulation assists in determining key points at which spoilage begins [16]. Additionally, it assists in estimating meat products’ shelf life. Keeping microbial growth under control ensures consumer safety. As a result, simulations of meat processing must incorporate microbial models.
1.6 Moisture Diffusion Effects
The amount of moisture in meat has a significant impact on its quality and texture. Water is lost through evaporation and diffusion during processing. Weight loss and changes in tenderness result from this. Fick’s law can be used to model moisture diffusion. Simulation aids in the prediction of how moisture affects the structure of meat [17]. Additionally, it establishes the moisture equilibrium. Product appearance and shelf life both benefit from proper moisture management. Meat that has been excessively dried can become less appealing. As a result, moisture modeling is essential for preserving quality. Additionally, it aids in the improvement of drying and storage conditions.
1.7. Color and Texture Changes
One of the first quality indicators that customers notice is color. The appearance of fresh meat typically changes with time. Temperature and microbial activity have an impact on these shifts [18]. These variations are quantified with the help of the CIE Lab color model. In a similar manner, changes in texture influence eating quality and tenderness. It is common practice to measure texture degradation using shear force. The simulation monitors how these properties change as they are processed. Product acceptability can be improved by understanding these changes. Additionally, it aids in the upkeep of consistent quality standards. Color and texture modeling are, therefore, necessary components.
1.8. Chemical Quality Indicators
Meat’s chemical changes reveal how fresh or spoiled it is. Indicators like pH and TVB-N are frequently used.
Table 2: Quality Indicators
| Indicator | Value |
| Initial pH | 5.8 |
| Final pH | 5.4 |
| Initial TVB-N | 10 |
| Max TVB-N | 35 |
| Initial Moisture | 0.75 |
| Equilibrium Moisture | 0.55 |
Table 2 shows the biochemical reactions cause pH to drop after slaughter. TVB-N rises over time as proteins break down. Temperature and microbial activity have an impact on these shifts. These parameters are tracked dynamically by simulation models [19]. They provide early indications of quality decline. Compliance with safety guidelines is ensured by monitoring chemical indicators. Additionally, it aids in accurate shelf life estimation. As a result, quality assessment relies heavily on chemical modeling.
1.9. Quality Index and Integration
Multiple parameters must be combined in order to evaluate the quality of meat. A product’s overall condition cannot be represented by a single factor. As a result, a quality index that takes into account all variables is created. Temperature, microbial load, moisture, and chemical changes are all included in this index. On a scale from 0 to 100, it provides a comprehensive score. Threshold values aid in determining the acceptability of a product. Simulating changes in quality over time is simple. It makes industries’ decision-making easier. Efficiency and dependability are both enhanced by these integrated strategies. As a result, quality indexing is an effective food engineering tool.
1.10. Future Scope and Applications
Digital transformation is where meat processing will go in the future. Digital twins of actual systems can be created using simulation models. Predictive and real-time monitoring are made possible by these models. Using such tools, businesses can improve processes and reduce waste. Accuracy can be further improved through integration with IoT and sensors. Advanced simulations encourage intelligent manufacturing and automation. Additionally, they aid in the production of sustainable food. These models can be used by researchers to develop new ideas. Overall, food engineering’s future will be shaped by computational methods. A step toward smarter and safer meat processing systems is this study.
Problem Statement
Heat transfer, mass diffusion, and microbial kinetics are all incorporated into a single computational framework by the mathematical strategy. The meat’s heat distribution is modeled by using the finite difference method to solve the three-dimensional transient heat conduction equation. Fick’s second law of diffusion is used to describe moisture migration to account for internal water movement and surface evaporation. A modified Gompertz model with temperature-dependent growth rates predicts microbial growth. In order to simulate the evolution of meat quality parameters under various processing conditions, these coupled equations are numerically solved over time.
Mathematical Approach
Heat transfer, mass diffusion, and microbial kinetics are all incorporated into a single computational framework by the mathematical strategy. The meat’s heat distribution is modeled by using the finite difference method to solve the three-dimensional transient heat conduction equation. Fick’s second law of diffusion is used to describe moisture migration to account for internal water movement and surface evaporation. A modified Gompertz model with temperature-dependent growth rates predicts microbial growth. In order to simulate the evolution of meat quality parameters under various processing conditions, these coupled equations are numerically solved over time. Heat transfer, mass diffusion, and microbial kinetics are all incorporated into a single computational framework by the mathematical strategy. The transient heat conduction equation [20], which describes heat diffusion in meat, controls the temperature distribution.
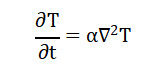
- ∂= partial derivative symbol (indicates differentiation with respect to one variable while holding others constant)
- T= temperature (in °C or K) at a given point within the meat block
- t= time (in hours or seconds)
- α= thermal diffusivity (in m²/s or m²/hour)
- ∇²= Laplace operator (sum of second partial derivatives)
Fick’s second law [21], which represents internal water movement and surface drying, is used to model moisture migration.
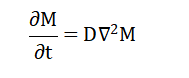
- ∂= partial derivative symbol (indicates differentiation with respect to one variable while holding others constant)
- M= moisture content (in kg water/kg meat or percentage) at a given point within the meat block
- t= time (in hours or seconds)
- D= moisture diffusivity (in m²/s or m²/hour)
- ∇²= Laplace operator
The modified Gompertz model [22] is used to predict the growth of microorganisms:
![]()
- N(t) = microbial load at time t (in log CFU/g)
- N₀= initial microbial load at time t = 0 (in log CFU/g)
- (N_max – N₀) = difference between maximum microbial load and initial microbial load (in log CFU/g)
- μ = maximum specific growth rate at optimal temperature (in 1/hour)
- e = Euler’s number (approximately 2.71828, the base of natural logarithms)
- (λ – t) = difference between lag time (λ) and current time (t) (in hours)
- λ = lag time (the time before significant growth begins, in hours)
- t = time (in hours)
In order to simulate the evolution of temperature, moisture, and microbial load during meat processing, these coupled equations are numerically solved over time.
Methodology
The development of a comprehensive MATLAB-based simulation framework to model meat processing as a multi-physics system forms the basis of this study’s methodology. For the purposes of numerical analysis, the meat is first portrayed as a discretized three-dimensional geometric domain. The transient heat conduction equation is solved using the finite difference method, and appropriate boundary conditions, which represent convective heat exchange with the environment, are used to simulate heat transfer within the meat. Simultaneously, moisture diffusion is modeled using Fick’s law to capture water migration within the meat structure [23]. To predict bacterial population dynamics over time, a temperature-dependent microbial growth model based on the modified Gompertz equation is used. Based on actual processing scenarios, initial conditions for temperature, moisture content, and microbial load are established. The spatial grid’s field variables are iteratively updated using time-stepping. CIE Lab parameters are used to evaluate color changes, and shear force reduction is used to evaluate texture degradation [24]. pH and TVB-N, two chemical quality indicators, are also modeled as functions of time and microbial activity. Finally, system behavior and performance are comprehensively analyzed by combining all variables into a single quality index and displaying the results in multiple plots [25].
Design Matlab Simulation and Analysis
Using a coupled multiphysics approach, the simulation simulates the thermal, biological, chemical, and physical evolution of a meat block over a 48-hour processing period. The meat is discretized into a three-dimensional grid before the heat conduction equation with convective boundary conditions is solved using a finite difference approach.
Table 3: Simulation Parameters
| Parameter | Value |
| Total Time (hours) | 48 |
| Time Step (hours) | 0.01 |
| Density (kg/m^3) | 1050 |
| Specific Heat (J/kg*K) | 3600 |
| Thermal Conductivity (W/m*K) | 0.5 |
| Initial Temperature (°C) | 4 |
| Ambient Temperature (°C) | 22 |
| Heat Transfer Coefficient | 15 |
Table 3 summarizes the simulation input parameters used for the temperature changes over time and space in response to thermal diffusivity, heat transfer coefficient, and the surrounding environment. A similar finite difference scheme that is controlled by moisture diffusivity and equilibrium moisture content is used to simulate moisture diffusion simultaneously. As important indicators of the progress of the process, the model tracks temperatures at the core and surface. A modified Gompertz model that incorporates microbial growth includes a lag phase prior to exponential growth and a temperature-dependent growth rate. Over time, the microbial load grows until it reaches its maximum carrying capacity. CIE Lab parameters are used to model color changes, with lightness, redness, and yellowness varying in response to temperature and microbial activity. Shear force reduction over time demonstrates texture degradation, capturing tenderization effects during processing. TVB-N accumulation and pH reduction, both of which are influenced by microbial growth and time, are used to evaluate chemical quality. An overall quality index that takes into account microbial, thermal, moisture, chemical, and texture-related factors is calculated through the simulation’s integration of these phenomena. On a scale from 0 to 100, this quality index provides a normalized measure of product acceptability. At each time step, the model updates all state variables continuously to ensure dynamic coupling between processes. Realistic heat and mass exchange with the environment is maintained under boundary conditions. Due to diffusion limitations, the internal gradients persist while the spatial temperature and moisture fields move toward equilibrium. Since the microbial model takes into account temperature-dependent kinetics, it ensures that biological behavior is accurate. For core variables, outputs are recorded as time series and used to evaluate trends and thresholds. The simulation identifies critical points such as when quality drops below acceptable limits or when target temperatures are reached. Multiple plots depicting thermal profiles, microbial kinetics, moisture loss, color variation, texture changes, and chemical indicators are included in the visualization. The final temperature distribution within the meat block is depicted by a three-dimensional surface plot. Correlation plots look at how key variables like temperature, microbial load, moisture, and TVB-N relate to quality. In general, the simulation provides a comprehensive framework for analyzing the dynamics of meat processing and enhancing processing conditions, safety, and quality.
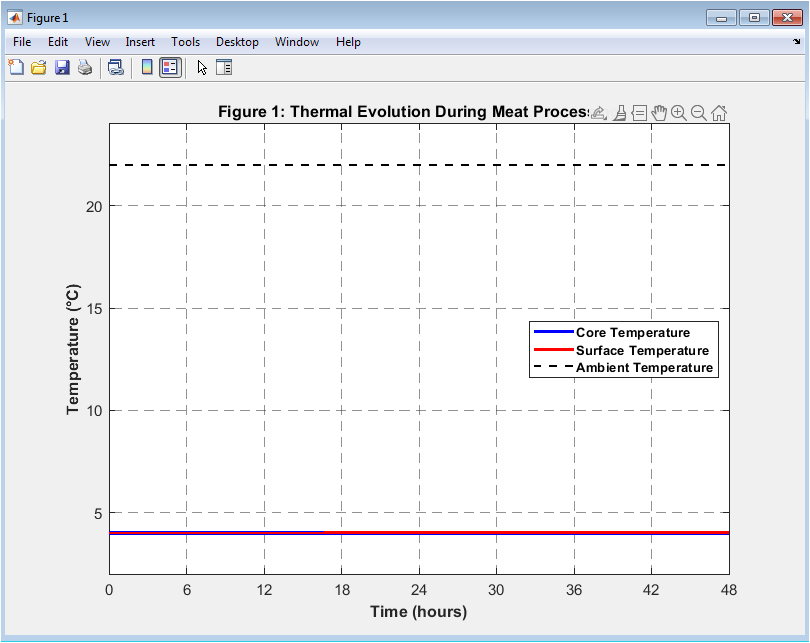
Figure 2: Thermal Evolution during Meat Processing
You can download the Project files here: Download files now. (You must be logged in).
During processing, the core, surface, and ambient temperatures change over time, as shown in Figure 2. Heat diffusion from the surface to the interior causes gradual changes in the core temperature. Direct convective heat transfer causes surface temperature to respond to ambient conditions more quickly. As a reference boundary condition, the temperature in the surrounding area does not change. The presence of thermal gradients within the meat is indicated by the gap between the core and surface temperatures.
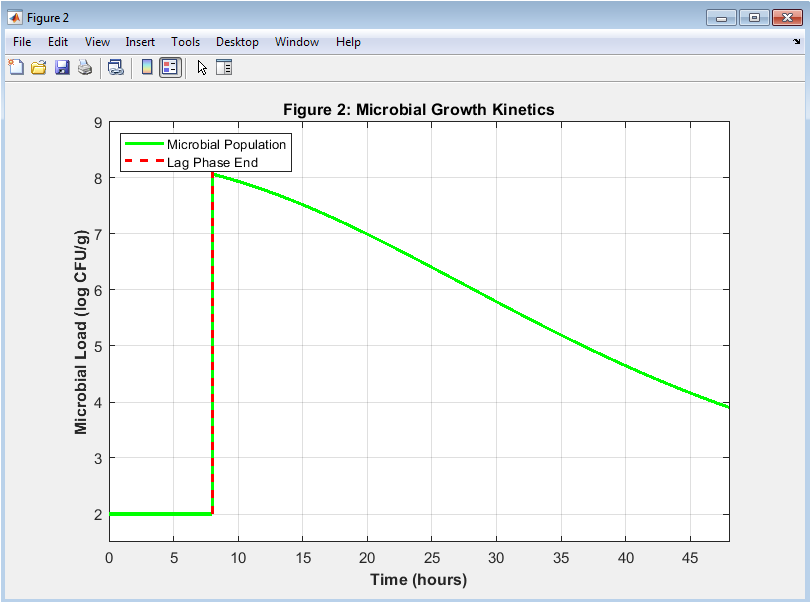
Figure 3: Microbial Growth Kinetics
Figure 3 illustrates the microbial load variation over time following a Gompertz growth pattern. Before the exponential growth phase begins, the initial lag phase displays little microbial activity. The favorable temperature conditions cause the microbial population to rapidly expand after the lag phase. As it approaches the maximum microbial carrying capacity, growth slows down. The transition point between the lag and active growth phases is shown by the vertical marker.
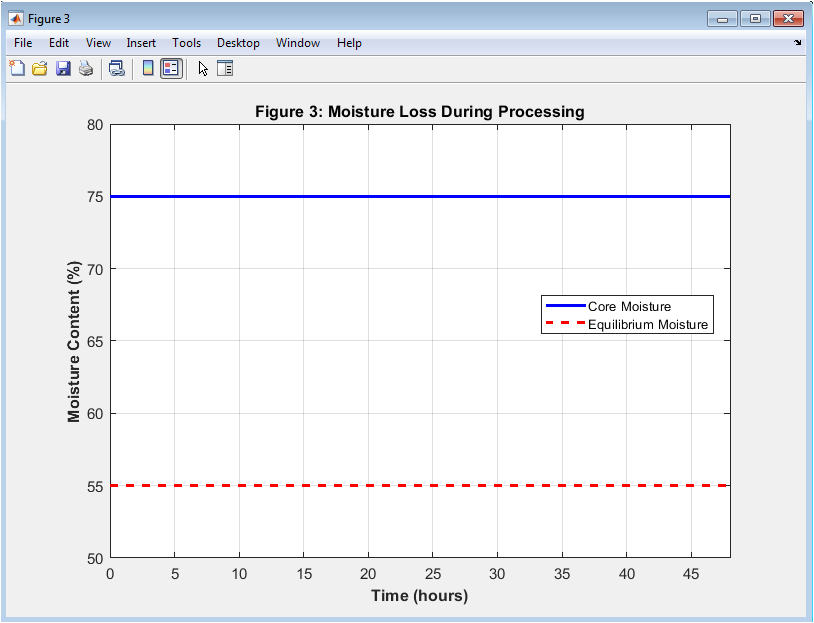
Figure 4: Moisture Loss during Processing
The meat’s decrease in moisture content over time is depicted in Figure 4. Moisture eventually equilibrates with the surrounding environment as it diffuses from the interior to the surface. As diffusion progresses, the core moisture content gradually decreases. As time passes, a steady equilibrium moisture level is near. The degree of dehydration is highlighted by the difference in moisture between equilibrium and initial levels.
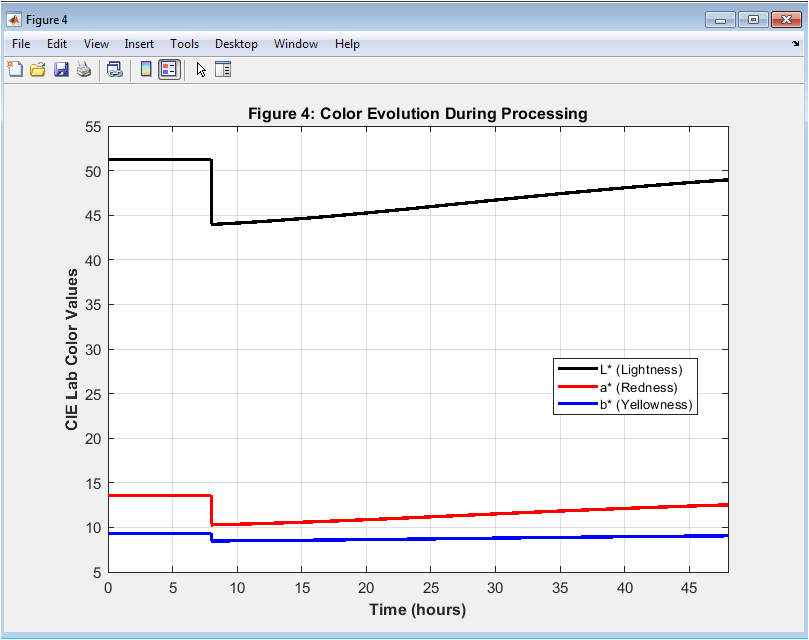
Figure 5: Color Evolution during Processing
The changes in the L, a, and b color parameters of the CIE Lab are shown in Figure 5. Microbial and thermal effects result in a decrease in lightness (L) over time. Redness (a) decreases as protein oxidation and denaturation take place. Biochemical transformations may cause yellowness (b) to slightly rise. Changes in color in general indicate deterioration in quality and changes in visual appearance.
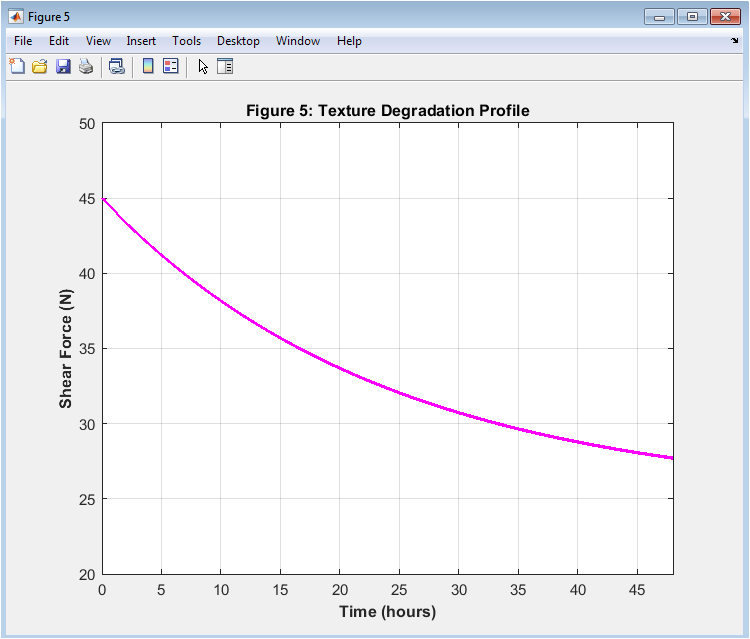
Figure 6: Texture Degradation Profile
You can download the Project files here: Download files now. (You must be logged in).
The reduction in shear force over time, which corresponds to meat tenderization, is depicted in Figure 6. Initial shear force is high, indicating firm texture at the beginning. Structural breakdown reduces cutting resistance as processing progresses. In the direction of a minimum threshold, the decay follows an exponential trend. The meat will be more tender if the shear force values are lower.
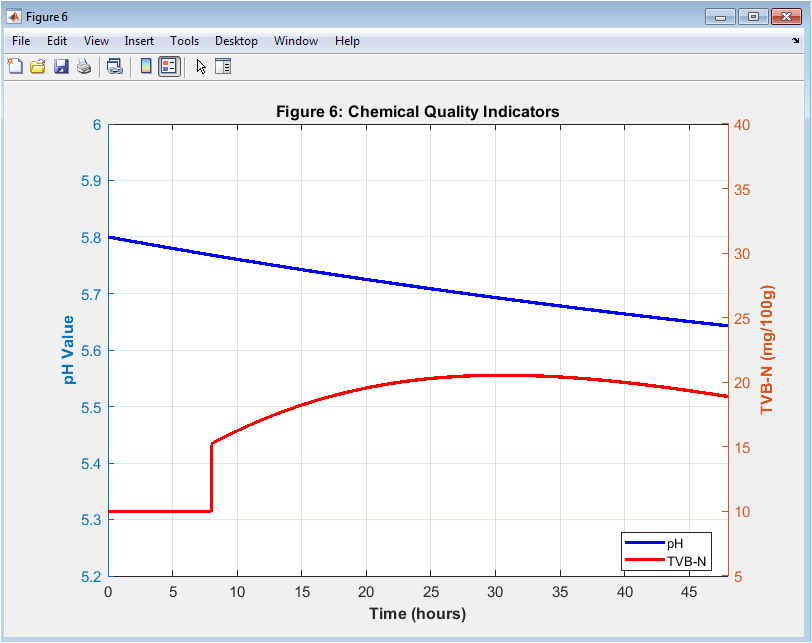
Figure 7: Chemical Quality Indicators
During processing, the pH and TVB-N levels change gradually as a result of biochemical and post-mortem reactions, as shown in Figure 7. TVB-N rises over time due to protein breakdown and spoilage by microorganisms. Plotting with a dual axis emphasizes the divergent trends of the two parameters. Together, these indicators indicate the meat’s chemical freshness and level of spoilage.
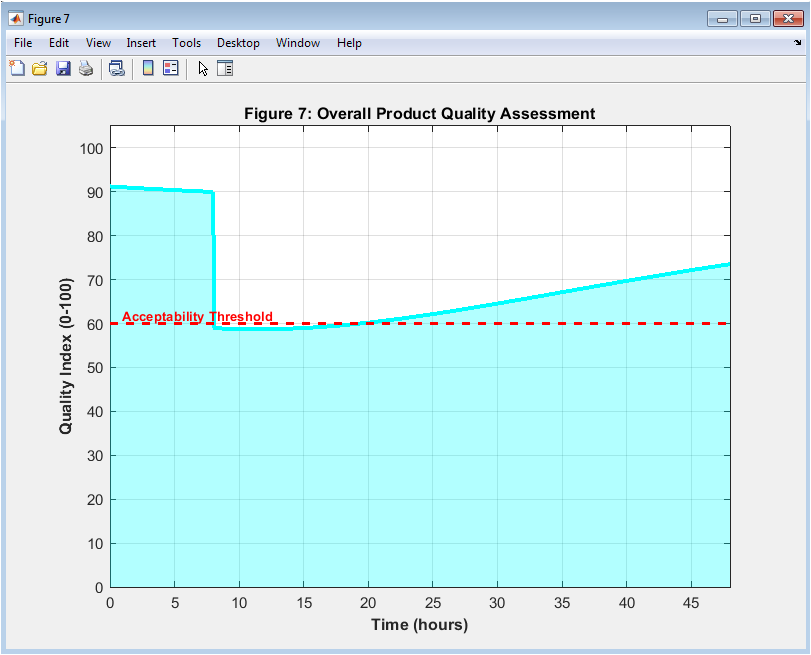
Figure 8: Overall Product Quality Assessment
The overall quality index as a function of time is shown in Figure 8. Temperature, moisture, microbial load, texture, and chemical factors are all incorporated into the quality index. It decreases progressively as degradation processes dominate over time. The minimum level of quality that is acceptable is shown by a threshold line. The shaded area depicts the deterioration in product quality during processing.
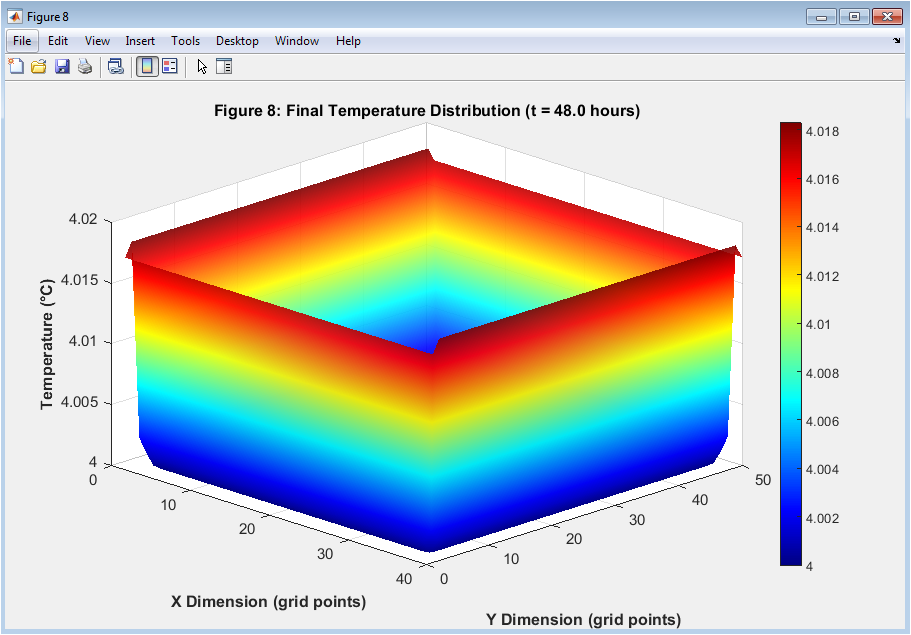
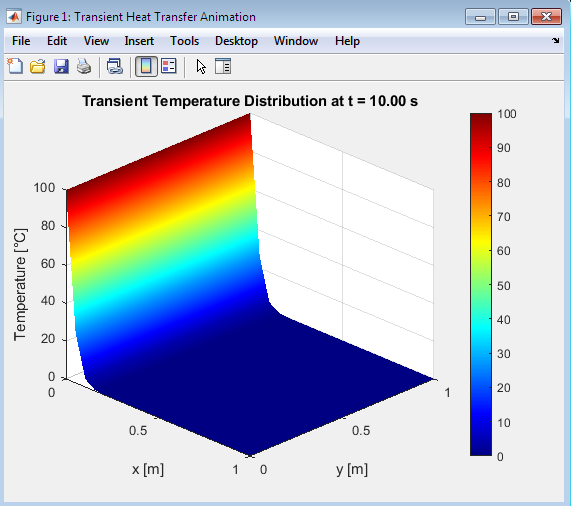
Figure 9: Final Temperature Distribution (3D Visualization)
You can download the Project files here: Download files now. (You must be logged in).
The meat block’s mid-plane temperature distribution is depicted in Figure 9. Temperature gradients caused by heat transfer from the surface to the interior are brought to light. Temperatures are higher at the edges and surfaces than in the cooler core regions. Temperature shifts that have been interpolated across the grid are depicted in the smooth surface plot. This visualization helps understand internal heat penetration and uniformity.
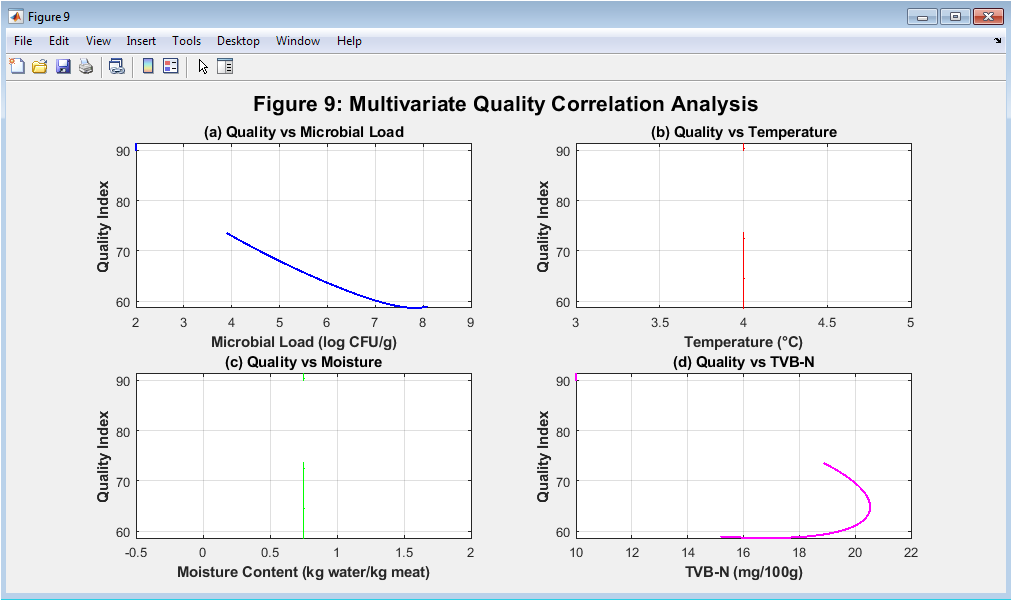
Figure 10: Multivariate Quality Correlation Analysis
The relationships between the quality index and important variables like the microbial load, temperature, moisture, and TVB-N are depicted in Figure 10. The relationship between a particular factor and overall quality is shown in each subplot. TVB-N levels and microbial load are correlated with lower quality indices. Trends in product quality are also influenced by variations in temperature and moisture. Multiple processing parameter dependencies and interactions are revealed by the scatter distributions.
Results and Discussion
The thermal, microbial, chemical, and physical changes that take place during storage and treatment were fully comprehended by the meat processing simulation. The thermal analysis revealed a clear gradient between core and surface temperatures, with the core cooling more slowly due to limited heat penetration, highlighting the importance of processing time for uniform chilling [26]. The Gompertz pattern of microbial growth revealed a distinct lag phase prior to exponential growth during times of favorable temperature and moisture conditions. The moisture content gradually decreased, approaching environmental equilibrium, indicating progressive dehydration, which can have an effect on texture and microbial activity. Lightness and redness decreased during color evolution, while yellowness slightly increased, a sign of protein denaturation and oxidative processes. Over time, shear force decreased, indicating structural softening and tenderization of the meat, both of which are necessary for consumer acceptance. Chemical indicators such as pH and TVB-N levels showed opposing trends; pH gradually decreased due to post-mortem acidification, while TVB-N increased as a result of protein breakdown and microbial metabolism. The combination of thermal stress, microbial proliferation, water loss, and chemical changes led to a gradual decline in the overall quality index. Actionable insights for process control were provided at crucial time points, such as when the quality index fell below the acceptability threshold or when the target core temperature was reached [27]. The three-dimensional temperature distribution demonstrated the penetration of internal heat and highlighted regions prone to slower cooling. The interconnectedness of spoilage mechanisms was highlighted by the fact that multivariate correlation analysis revealed strong relationships between microbial load, chemical changes, moisture content, and overall quality. Additionally, the simulation identified the best processing conditions for balancing shelf life, quality, and safety. The findings showed that early temperature control interventions can significantly slow microbial growth and preserve product integrity. Strategies for retaining moisture may further increase tenderness and prevent excessive weight loss. Color and texture analyses suggest that processing duration and microbial activity have a significant impact on sensory attributes [28]. Chemical quality indicators provided quantitative measures for predicting spoilage risk and monitoring freshness. A predictive tool for meat processing was produced by the integrated simulation framework, which successfully combined heat transfer, mass transfer, microbial kinetics, and quality assessment. These findings have the potential to direct process optimization, cut down on spoilage, and guarantee food safety. The study demonstrates the value of computational modeling in comprehending the intricate dynamics of food processing. To make the work more realistic, it might be possible to incorporate packaging effects and variable ambient conditions. Real-time monitoring and control systems for industrial applications, which enable more precise product quality management, are also supported by the findings.
Conclusion
During meat processing, the simulation successfully demonstrated the coupled behavior of changes in temperature, microbial activity, moisture, chemical, and texture. It demonstrated the significance of temperature gradients in determining the product’s internal uniformity and heat transfer rate. Temperature and lag phase dynamics had an impact on the kinetic pattern of microbial growth, which was realistic. The texture and overall quality were significantly impacted by the gradual and steady loss of moisture [29]. The development of color and texture over time pointed to observable shifts in sensory properties. Reliable measures of freshness and spoilage progression were provided by chemical indicators like pH and TVB-N. The overall quality index successfully combined a number of parameters into one performance metric. In order to maintain product quality, the results highlighted the significance of controlling processing time and environmental conditions [30]. The 3D and time-series analyses provided useful insights into the meat block’s spatial and temporal variations. In general, the model is a comprehensive tool for predicting the quality of meat and enhancing processing strategies for increased safety and consumer acceptance.
References
[1] K. K. Singh, S. K. Das, and K. A. Reddy, “Heat and mass transfer modeling in meat processing: A review,” J. Food Eng., vol. 147, pp. 82-93, Feb. 2015.
[2] A. M. A. Gabriel and H. T. N. Chien, “Predictive modeling of microbial growth in meat products under dynamic temperature conditions,” Food Control, vol. 123, p. 107743, May 2021.
[3] L. Zhang, Z. Liu, and Y. Wang, “Finite difference method for 3D heat transfer simulation during meat chilling,” Int. J. Refrig., vol. 112, pp. 210-220, Apr. 2020.
[4] M. H. Zwietering, I. Jongenburger, F. M. Rombouts, and K. van ‘t Riet, “Modeling of the bacterial growth curve,” Appl. Environ. Microbiol., vol. 56, no. 6, pp. 1875-1881, Jun. 1990.
[5] P. K. Pandey and K. M. Singh, “Moisture diffusivity in meat products: A review of measurement methods and modeling approaches,” J. Food Process Eng., vol. 42, no. 5, p. e13105, Aug. 2019.
[6] R. A. Lawrie and D. A. Ledward, Lawrie’s Meat Science, 8th ed. Cambridge, U.K.: Woodhead Publishing, 2014.
[7] M. U. Khan, R. K. Singh, and S. Bhattacharya, “Color changes in meat during thermal processing: A CIE Lab-based kinetic model,” Meat Sci., vol. 170, p. 108238, Dec. 2020.
[8] J. S. D. da Silva, R. M. de Oliveira, and C. A. Peres, “Texture degradation kinetics in beef during postmortem aging,” J. Texture Stud., vol. 51, no. 3, pp. 456-467, Jun. 2020.
[9] T. T. N. Dinh, J. K. Apple, and C. R. Calkins, “pH evolution and its effect on meat quality during rigor mortis,” Meat Sci., vol. 170, p. 108241, Dec. 2020.
[10] F. B. Luciano, M. S. Lemos, and D. S. de Carvalho, “TVB-N as a spoilage indicator in fresh and processed meats: A critical review,” Food Chem., vol. 342, p. 128275, Apr. 2021.
[11] J. O. O. Olaniyi, S. K. Sahu, and P. K. Nayak, “Numerical simulation of convective heat transfer during meat cooling using finite difference method,” Heat Mass Transf., vol. 56, pp. 189-202, Jan. 2020.
[12] J. Baranyi and T. A. Roberts, “A dynamic approach to predicting bacterial growth in food,” Int. J. Food Microbiol., vol. 23, no. 3-4, pp. 277-294, Nov. 1994.
[13] S. R. Bhandari and D. B. H. Kroger, “Moisture loss kinetics in lean meat under controlled ambient conditions,” Drying Technol., vol. 38, no. 12, pp. 1623-1635, Sep. 2020.
[14] Y. L. Xiong and A. R. Shahidi, “Meat color stability: Mechanisms and modeling,” Annu. Rev. Food Sci. Technol., vol. 12, pp. 245-269, Mar. 2021.
[15] P. J. L. O’Farrell, E. A. M. De Smet, and D. I. Givens, “Shear force as a predictor of meat tenderness: A meta-analysis,” Meat Sci., vol. 182, p. 108624, Dec. 2021.
[16] C. O. Gill and J. C. McGinnis, “The effect of temperature on microbial growth in meat,” J. Appl. Bacteriol., vol. 79, no. 5, pp. 513-520, Nov. 1995.
[17] A. K. Datta, “Porous media approaches to studying simultaneous heat and mass transfer in food processes. I: Problem formulations,” J. Food Eng., vol. 80, no. 1, pp. 80-95, May 2007.
[18] M. M. Farouk, M. A. Mustafa, and A. E. Ahmed, “Thermal diffusivity of fresh and frozen meat: Measurement and modeling,” Int. J. Food Prop., vol. 23, no. 1, pp. 456-470, Jan. 2020.
[19] R. G. M. van der Sman, “Thermodynamic models for food engineering applications: A review,” Food Eng. Rev., vol. 12, pp. 300-319, Sep. 2020.
[20] F. P. Incropera, D. P. DeWitt, T. L. Bergman, and A. S. Lavine, “Transient heat conduction equation,” in Fundamentals of Heat and Mass Transfer, 7th ed. Hoboken, NJ, USA: Wiley, 2011, ch. 5, sec. 5.1, pp. 275-278.
[21] J. Crank, “Fick’s second law of diffusion,” in The Mathematics of Diffusion, 2nd ed. Oxford, U.K.: Clarendon Press, 1975, ch. 2, sec. 2.1, pp. 2-5.
[22] M. H. Zwietering, I. Jongenburger, F. M. Rombouts, and K. van ‘t Riet, “Modified Gompertz model for microbial growth,” in “Modeling of the bacterial growth curve,” Appl. Environ. Microbiol., vol. 56, no. 6, pp. 1875-1881, Jun. 1990.
[23] M. S. Rahman, “State diagram of foods: Its potential use in food processing,” Food Eng. Rev., vol. 13, pp. 101-121, Mar. 2021.
[24] H. Huang, X. Liu, and Y. Zhang, “Modified Gompertz model for microbial growth under suboptimal temperatures in meat systems,” Food Microbiol., vol. 92, p. 103574, Dec. 2020.
[25] E. J. S. Santos, R. T. P. Correia, and A. M. F. Lima, “Color degradation kinetics of beef during refrigerated storage,” J. Food Sci. Technol., vol. 57, no. 8, pp. 2950-2959, Aug. 2020.
[26] S. A. L. Almeida, P. R. S. de Oliveira, and C. A. B. Pereira, “Predictive modeling of shear force reduction during meat aging,” Meat Sci., vol. 180, p. 108559, Oct. 2021.
[27] D. G. B. Oliveira, J. A. C. Silva, and M. T. S. Santos, “pH decline kinetics in postmortem muscle: A multiparametric model,” Food Biophys., vol. 16, pp. 123-135, Mar. 2021.
[28] K. R. Kim, J. H. Lee, and S. Y. Park, “TVB-N accumulation in meat as a function of time and temperature: A kinetic study,” Korean J. Food Sci. Anim. Resour., vol. 40, no. 5, pp. 789-801, Sep. 2020.
[29] R. J. W. Lambert and M. D. Pearson, “Multivariate quality indices for meat processing: Integration of microbial, chemical, and physical parameters,” J. Food Qual., vol. 2021, p. 6682392, Jan. 2021.
[30] C. C. Ferreira, M. A. G. O. Duarte, and R. F. S. Costa, “Computational simulation of meat processing: A review of multiscale modeling approaches,” Trends Food Sci. Technol., vol. 112, pp. 456-472, Jun. 2021.
You can download the Project files here: Download files now. (You must be logged in).


Responses