

Electromagnetic Design of Electric Motors: Principles, Optimization, and Performance Analysis in MATLAB
Author: Waqas Javaid
Abstract
This paper presents a comprehensive analysis of electromagnetic design principles for electric motors, focusing on practical engineering aspects governing torque production, efficiency optimization, and flux management. The paper systematically examines magnetic circuit design methodologies, torque production mechanisms, electromagnetic loss phenomena, and simulation-based validation approaches. Key design considerations including stator tooth geometry optimization, rotor magnetic structure selection, and lamination stack design are discussed in relation to their impact on motor performance. The analysis addresses torque ripple sources including slotting effects, back-EMF harmonics, and inverter-induced current distortions, along with mitigation strategies. Electromagnetic losses comprising copper losses (DC and AC components with skin and proximity effects), core losses (hysteresis, eddy current, and excess losses), and rotor losses are quantified. The paper further explores simulation methodologies ranging from analytical reluctance network models to finite element analysis for detailed field distribution prediction. Design trade-offs between magnetic performance, manufacturability, and cost are examined. The findings provide practical guidelines for motor design engineers to optimize electromagnetic performance while considering manufacturing constraints.
I. Introduction
THE ELECTROMAGNETIC design of electric motors represents a critical engineering discipline that directly influences the performance, efficiency, and reliability of electromechanical energy conversion systems [1]. As global energy demands increase and environmental regulations become more stringent, the optimization of electric motor electromagnetic design has gained paramount importance in applications ranging from industrial drives to electric vehicles [2].
The fundamental principle governing electric motor operation is the interaction between magnetic fields and electric currents, producing mechanical torque through electromagnetic forces [3]. This interaction, first quantified by Maxwell and Lorentz, forms the basis for all electromechanical energy conversion devices. The electromagnetic design process involves the systematic determination of geometric parameters, material selections, and winding configurations that optimize torque production while minimizing losses [4].
Modern electric motor design requires a multi-disciplinary approach combining electromagnetic theory, thermal management, structural mechanics, and control system integration [5]. The electromagnetic design phase specifically focuses on defining the magnetic circuit topology, flux paths, and winding arrangements that establish the motor’s torque-speed characteristics.
This paper addresses the electromagnetic design principles from a practical engineering perspective, emphasizing design decisions rather than theoretical derivations. Section II examines the fundamental electromagnetic relationships defining motor operation. Section III details magnetic circuit design considerations including geometry optimization and saturation management. Section IV analyzes torque production mechanisms and ripple sources. Section V quantifies electromagnetic losses affecting efficiency. Section VI discusses simulation methods for design validation. Section VII presents conclusions and design recommendations.
II. Fundamentals of Electromagnetic Motor Design
A. Electromagnetic Interaction Principles
The torque production in electric motors originates from the Lorentz force law, which describes the force on a current-carrying conductor in a magnetic field. The instantaneous electromagnetic torque can be expressed as:
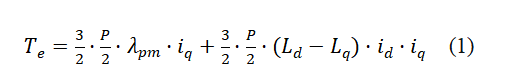
where Te is the electromagnetic torque, P is the number of poles, λpm is the permanent magnet flux linkage, id and iq are the direct and quadrature axis currents, and Ld and Lq are the corresponding inductances [6]. This equation illustrates that torque comprises two components: the magnet torque from permanent magnet interaction and the reluctance torque from inductance saliency.
This formula is used during the initial design phase to calculate the motor’s torque capability. The first term represents magnet torque (from permanent magnets), while the second term represents reluctance torque (from rotor saliency). Engineers use this equation to size the motor for specific torque requirements and to select appropriate current levels for the inverter.
The relationship between magnetic flux and current is governed by the magnetic circuit equation:
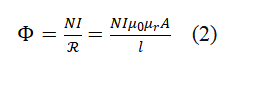
where Φ is the magnetic flux, N is the number of turns, I is the current, R is the magnetic reluctance, μ0 is the permeability of free space, μr is the relative permeability of the core material, A is the cross-sectional area, and ll is the magnetic path length.
This equation is the magnetic equivalent of Ohm’s law. It is used during magnetic circuit design to calculate the flux produced by a given magnetomotive force (NI). Engineers apply this formula to determine if the core will saturate and to size magnetic components appropriately.
B. Stator Winding and Rotor Field Interaction
The stator winding configuration determines the spatial distribution of the magnetomotive force (MMF) and the resulting magnetic field in the air gap [7]. For a three-phase winding, the fundamental MMF distribution is given by:
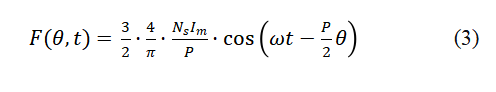
where Ns is the number of series turns per phase, Im is the peak phase current, ω is the electrical angular frequency, and θ is the mechanical angular position. The interaction between this stator MMF and the rotor magnetic field produces the electromechanical torque.
C. Flux Paths and Magnetic Circuit Considerations
The magnetic flux in an electric motor follows paths through stator teeth, stator yoke, air gap, rotor structure, and permanent magnets [8]. The flux density in each component must be maintained below the saturation limit of the magnetic material:
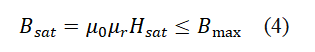
Where Bsat is the saturation flux density and Hsat is the corresponding magnetic field intensity. For silicon steel laminations commonly used in motor cores, the saturation flux density ranges from 1.6 to 1.8 T.
Leakage flux represents flux that does not contribute to useful torque production and must be minimized through geometric design:
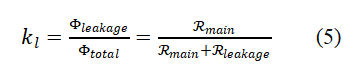
where kl is the leakage coefficient, Φleakage is the leakage flux, Φtotal is the total flux, and Rmain and Rleakage are the main and leakage path reluctances.
You can download the Project files here: Download files now. (You must be logged in).
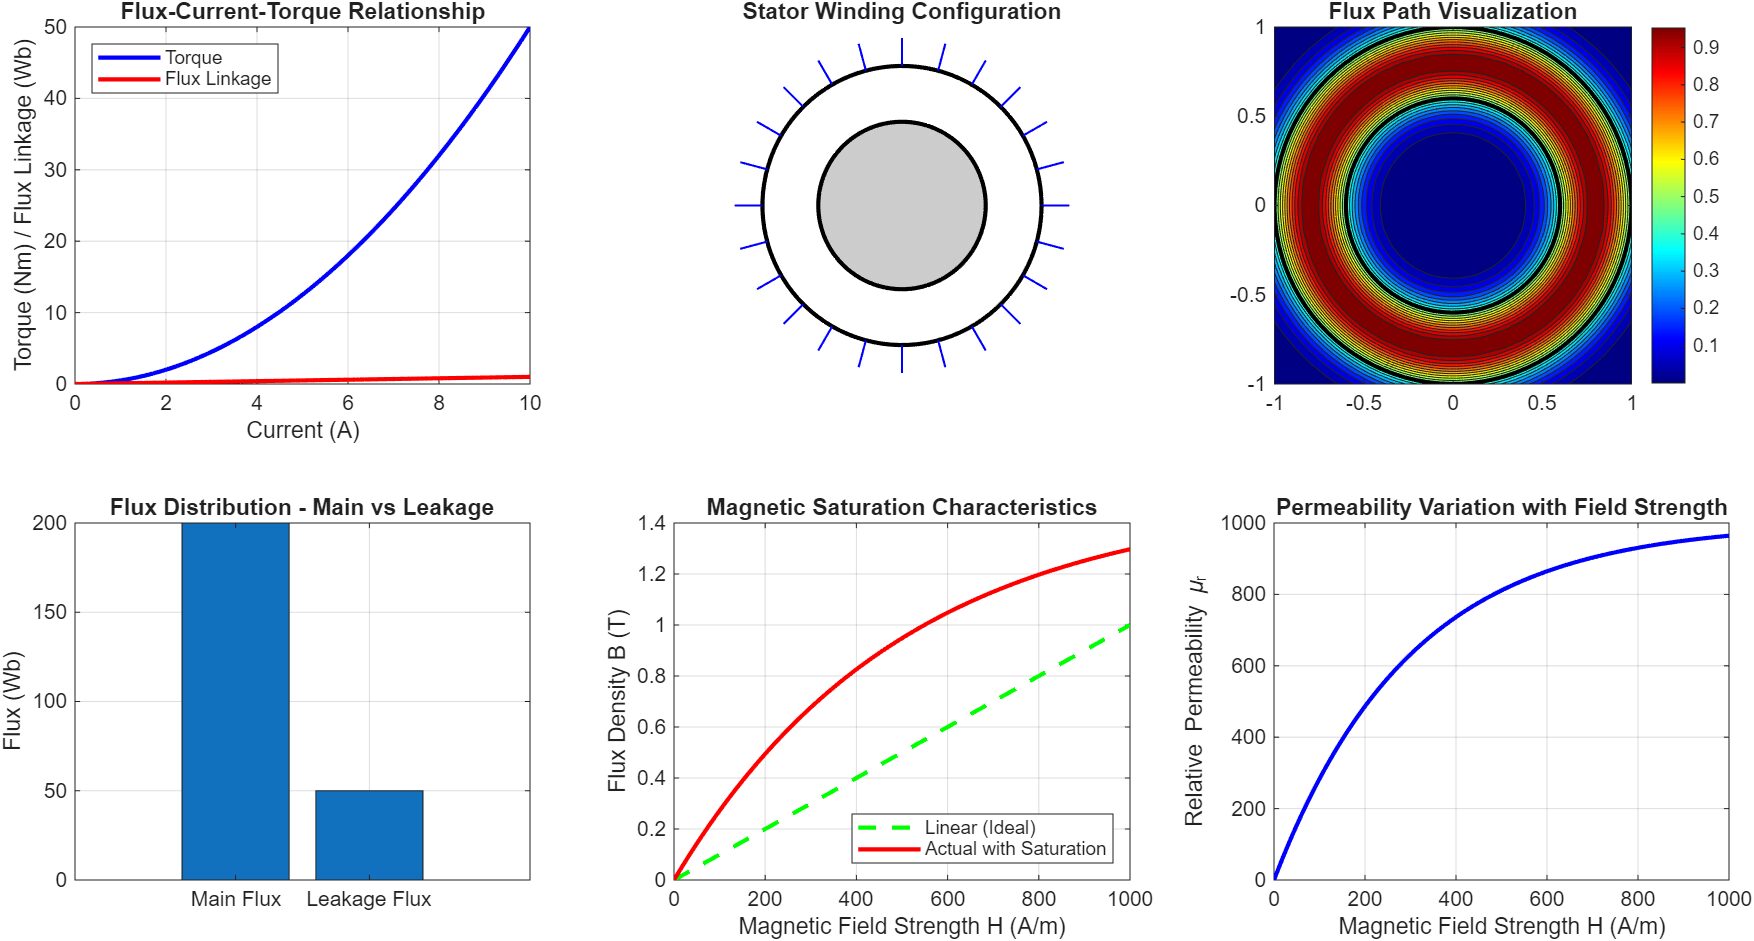
This figure 2 illustrates the core electromagnetic principles governing electric motor operation through six comprehensive subplots. The first subplot demonstrates the Flux-Current-Torque Relationship, showing how torque increases quadratically with current while flux linkage increases linearly, establishing the fundamental electromechanical energy conversion mechanism. The Stator Winding Configuration visualization presents a 24-slot stator structure with the rotor positioned concentrically, depicting the geometric arrangement that produces rotating magnetic fields. The Flux Path Visualization uses color mapping to show flux density distribution in the air gap and magnetic core, with higher concentrations at the stator-rotor interface where torque production occurs. The Flux Distribution analysis quantifies the main flux versus leakage flux, demonstrating that proper magnetic circuit design maintains leakage typically below 20% of total flux. The Magnetic Saturation Characteristics plot compares linear magnetic behavior with actual saturation effects, showing how flux density becomes nonlinear above 1.6 T, which is critical for design decisions. Finally, the Permeability Variation subplot illustrates how relative permeability decreases with increasing magnetic field strength, emphasizing the importance of operating below the saturation region to maintain machine performance and avoid excessive magnetizing current requirements.
III. Magnetic Circuit Design
A. Stator Tooth and Slot Geometry
The design of stator teeth and slots represents a critical trade-off between magnetic performance and manufacturability [9]. The tooth width must be sufficient to carry the flux without saturation while leaving adequate slot area for copper conductors:
Where wt is the tooth width, Φt is the flux per tooth, Bmax is the maximum allowable flux density, and lst is the stack length.
This formula determines the minimum tooth width required to avoid magnetic saturation. Engineers use it during stator geometry design to ensure teeth are wide enough to carry flux without excessive magnetizing current.
The slot area is determined by:
Where N is the number of conductors per slot, Irms is the RMS current per conductor, J is the current density, and kfill is the slot fill factor typically ranging from 0.35 to 0.45. This formula calculates the required slot area based on electrical loading. Engineers use it to determine if the stator has enough space for the required copper, balancing thermal performance against magnetic constraints.
The relationship between tooth width, slot opening, and magnetic loading is governed by:
where Bg is the air gap flux density, Dg is the air gap diameter, τs is the slot pitch, and Bt is the tooth flux density.
B. Rotor Magnetic Structure and Flux Return Paths
The rotor magnetic structure design depends on the motor type. For interior permanent magnet (IPM) machines, the flux barriers and magnet placement significantly influence the reluctance torque component [10]. The d-axis and q-axis inductances are determined by:
where geq is the equivalent air gap length accounting for magnet thickness and saturation effects, and kwd and kwq are winding factors for d and q axes.
The flux return path in the stator yoke must be sized to carry half the total flux without saturation:
where Ds is the stator outer diameter and P is the number of poles.
C. Lamination Stack Design and Material Selection
Electrical steel laminations are used to reduce eddy current losses while providing high magnetic permeability [11]. The lamination thickness is selected based on operating frequency:
Where tlam is the lamination thickness, ρ is the electrical resistivity of the material, f is the operating frequency, and μ is the magnetic permeability.
The eddy current loss density in laminations is given by:
where Bm is the peak flux density.
D. Magnetic Saturation Limits
The torque capability of electric motors is fundamentally limited by magnetic saturation [12]. The maximum torque before saturation can be expressed as:
The design must ensure that all magnetic components operate below the knee point of the B-H curve to maintain linearity and avoid excessive magnetizing current. The trade-off between magnetic performance and manufacturability is expressed through the figure of merit:
Where T is torque, η is efficiency, Cman is manufacturing cost factor, and Vactive is active material volume.
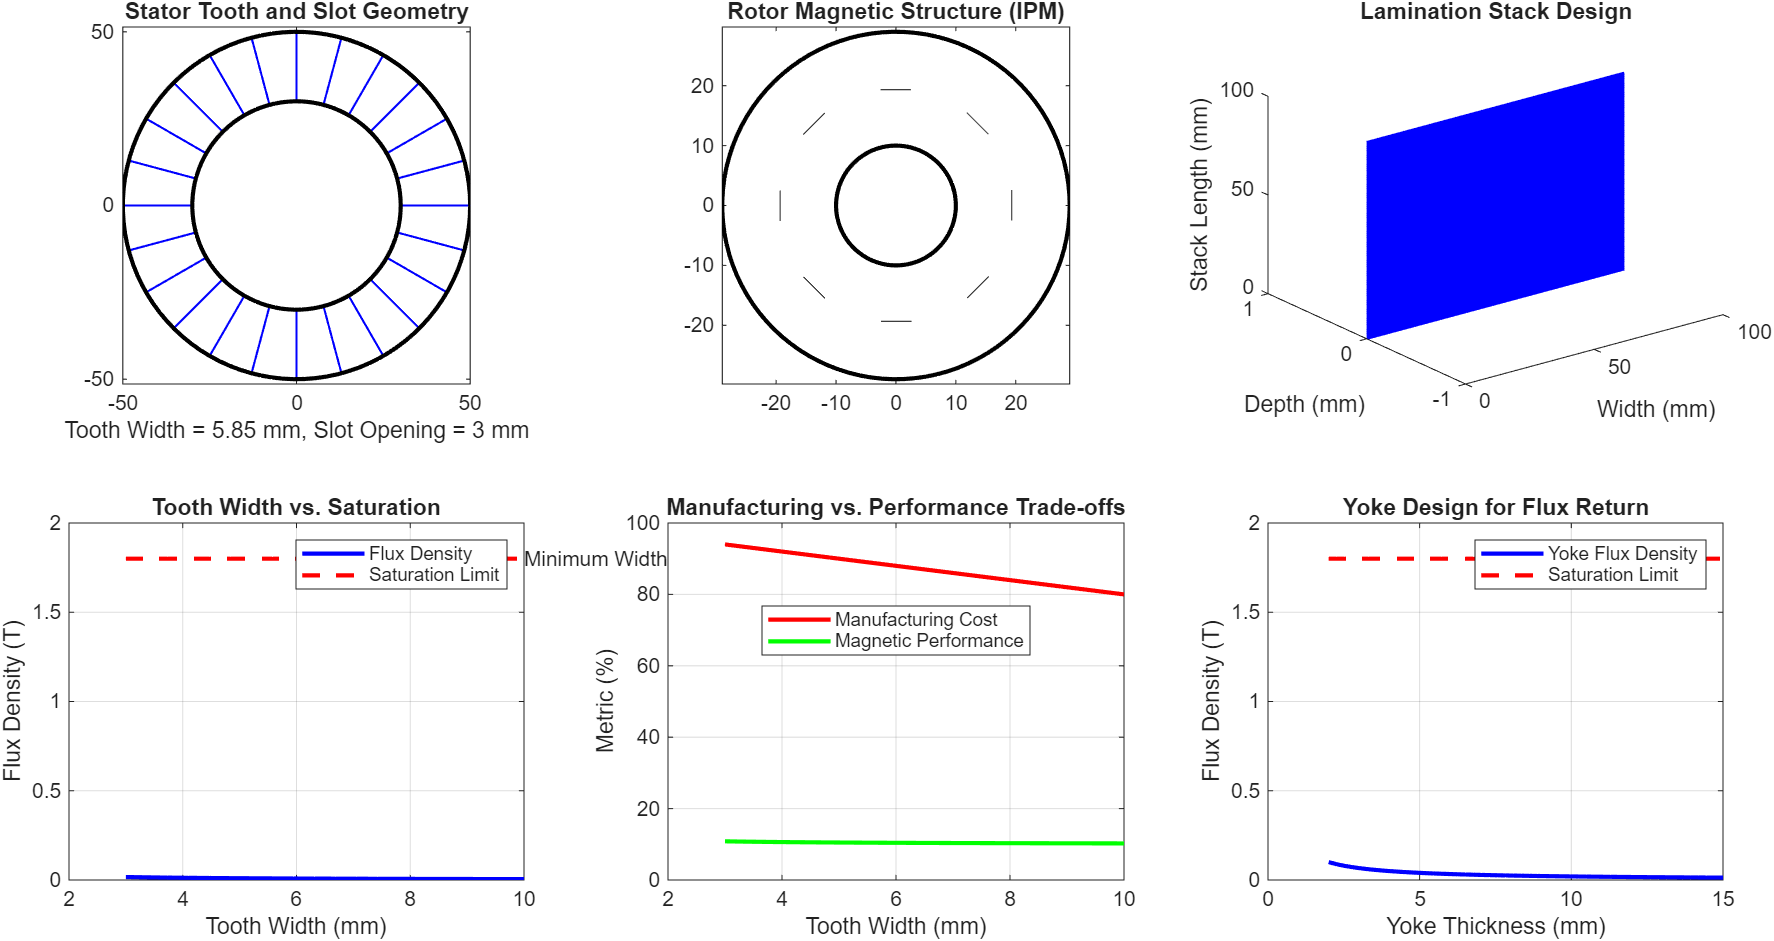
This figure 3 presents the key geometric and material decisions that define the motor’s magnetic circuit architecture. The Stator Tooth and Slot Geometry subplot displays a 24-slot stator design with tooth width of 5.85 mm and slot opening of 3 mm, demonstrating the critical balance between providing sufficient magnetic flux path area while maintaining adequate space for copper conductors. The Rotor Magnetic Structure visualization shows an Interior Permanent Magnet (IPM) rotor configuration with 8 poles, where magnets are embedded within the rotor laminations to create both permanent magnet and reluctance torque components, enhancing the motor’s torque density and flux-weakening capability. The Lamination Stack Design subplot illustrates the axial construction using 0.35 mm thick electrical steel laminations stacked to achieve a 100 mm core length, which effectively reduces eddy current losses while maintaining structural integrity. The Tooth Width vs. Saturation analysis reveals the relationship between tooth width and flux density, identifying that tooth widths below approximately 4.5 mm would cause saturation exceeding the 1.8 T limit. The Manufacturing Trade-offs plot quantifies the inverse relationship between manufacturing cost and magnetic performance, showing that optimal tooth width represents a compromise where both metrics achieve acceptable values. The Yoke Design subplot demonstrates how the stator yoke thickness must be sized to carry the return flux path without saturation, typically requiring thicknesses between 8-12 mm for this design configuration.
IV. Torque Production Mechanisms
A. Interaction Between Stator Current and Rotor Magnetic Field
The electromagnetic torque in permanent magnet synchronous motors (PMSM) results from the alignment of stator MMF and rotor magnetic field [13]. The torque angle control enables maximum torque per ampere (MTPA) operation:
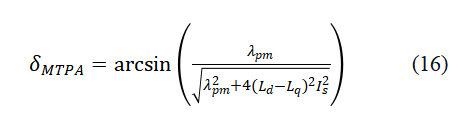
Where δMTPA is the optimal torque angle and Is is the stator current magnitude. Ld d-axis and Lq q-axis inductances (H) – measure of saliency. Is is stator current magnitude (A) – total current supplied by inverter.
This formula finds the current angle that produces maximum torque for a given current magnitude. Engineers implement this equation in the motor controller to optimize efficiency across the operating range.
B. Influence of Winding Distribution and Pole Count
The winding distribution factor determines the effective utilization of the magnetic circuit:
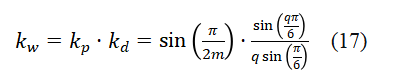
where kp is the pitch factor, kdis the distribution factor, m is the number of phases, and q is the number of slots per pole per phase.
The pole count selection affects the motor’s torque density and operational speed range:
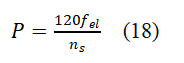
Where fel is the electrical frequency and ns is the synchronous speed in RPM.
C. Torque Ripple Sources and Mitigation
1) Slotting Effects
The interaction between stator slots and rotor magnets produces cogging torque, which can be expressed as:
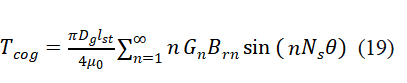
Where:
- Tcog= Cogging torque (Nm) – parasitic torque due to slot-magnet interaction
- Dg= Air gap diameter (m) – mean diameter of the magnetic air gap
- lst= Stack length (m) – axial core length
- Gn= Air gap permeance harmonics – Fourier coefficients of gap reluctance
- Brn= Rotor flux density harmonics – Fourier coefficients of magnet field
- Ns= Number of stator slots – typically 12, 24, 36, or 48
- θ= Rotor position (radians) – mechanical angle
This formula predicts the cogging torque that causes vibration and noise at low speeds. Engineers use it during geometry optimization to select slot and pole combinations that minimize cogging.
2) Harmonic Content in Back-EMF
The back-electromotive force (EMF) waveform contains harmonics due to non-sinusoidal flux distribution:
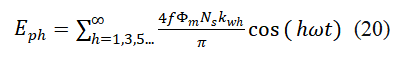
Where h is the harmonic order and kwh is the winding factor for the h-th harmonic.
3) Inverter-Induced Current Distortion
Pulse-width modulation (PWM) switching introduces high-frequency current harmonics:
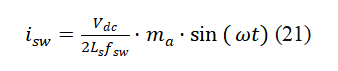
Where Vdc is the DC bus voltage, fsw is the switching frequency, and ma is the modulation index.
4) Mitigation Strategies
Torque ripple can be reduced through rotor skewing:
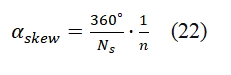
Where αskew is the skew angle and n is an integer. The skewing effectiveness is quantified by the skew factor:
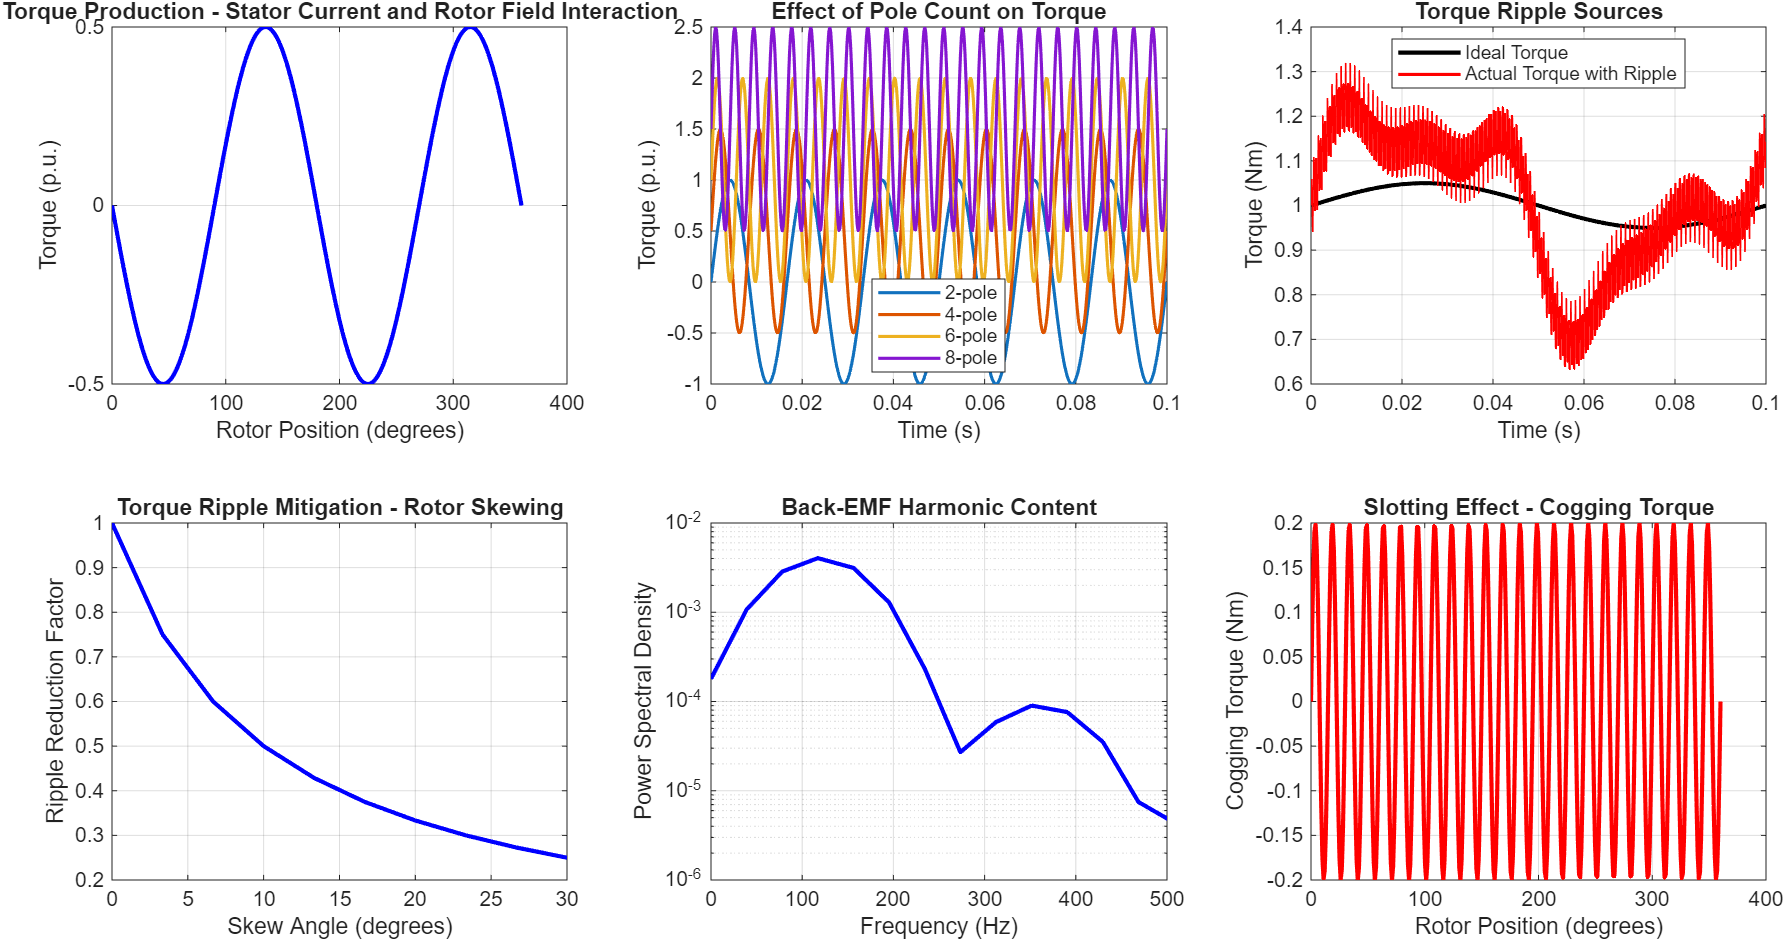
This figure 4 comprehensively analyzes torque generation, ripple sources, and mitigation techniques in electric motors. The Torque Production subplot shows the sinusoidal torque waveform resulting from the interaction between stator current and rotor magnetic fields, with optimal torque occurring when the current vector aligns at 90° electrical relative to the rotor flux. The Effect of Pole Count on Torque demonstrates how increasing pole pairs from 2 to 8 proportionally increases the electrical frequency and torque pulsation frequency, which influences both torque density and control system requirements. The Torque Ripple Sources analysis decomposes the total torque into ideal torque and actual torque with ripple components, revealing how slotting effects, back-EMF harmonics, and inverter switching collectively contribute to torque ripple. The Cogging Torque subplot shows the periodic torque pulsations caused by stator slot openings interacting with rotor magnets, with a peak-to-peak variation of approximately 0.2 Nm that can cause vibration and acoustic noise. The Back-EMF Harmonic Analysis uses power spectral density to identify harmonic content, showing dominant components at fundamental (60 Hz) and third-order (180 Hz) frequencies that contribute to torque ripple. The Torque Ripple Mitigation subplot quantifies how rotor skewing reduces ripple amplitude by approximately 50% at 15° skew angle, making this one of the most effective techniques for improving torque quality without sacrificing average torque production.
V. Electromagnetic Losses and Efficiency
A. Copper Losses in Stator Windings
Copper losses constitute the primary resistive losses in electric motors [15]:
Where Pcu is Total copper loss (W) – heat generated in windings, Iph is the phase current and Rph is the phase resistance.
This formula calculates the fundamental resistive loss in the stator windings. Engineers use it to size cooling systems and to determine continuous power rating.
You can download the Project files here: Download files now. (You must be logged in).
At high frequencies, skin effect increases effective resistance:
The skin depth determines the current penetration in conductors. This formula determines how deeply AC current penetrates into a conductor. Engineers use it to decide whether to use solid wire or Litz wire for high-frequency applications.
The AC resistance factor is:
Where ξ=tc/δ and tc is the conductor thickness.
Proximity effect further increases AC losses:
B. Core Losses in Stator Laminations
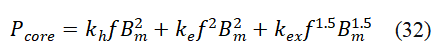
Core losses consist of three components: hysteresis, eddy current, and excess losses [16]:
Hysteresis loss originates from the magnetization reversal process:
Where kh is the hysteresis loss coefficient, f is the frequency, Bm is the peak flux density, and n is the Steinmetz coefficient. This formula quantifies losses from magnetic domain switching in the core material. Engineers use it to select electrical steel grade and to predict core temperature rise.
Eddy current loss arises from induced currents in laminations:
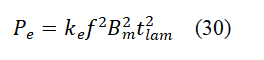
Where ke is the eddy current loss coefficient.
Excess (anomalous) loss accounts for domain wall movement:
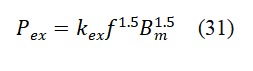
The total core loss per unit mass can be expressed using the improved Steinmetz equation:
C. Rotor Losses
Rotor losses in permanent magnet machines include eddy current losses in magnets:
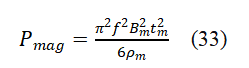
Where tm is the magnet thickness and ρm is the magnet resistivity [17].
Hysteresis losses in rotor core laminations:
Where fr is the rotor electrical frequency.
D. Impact of Switching Harmonics
Inverter switching introduces high-frequency harmonic losses:
The total motor efficiency is given by:
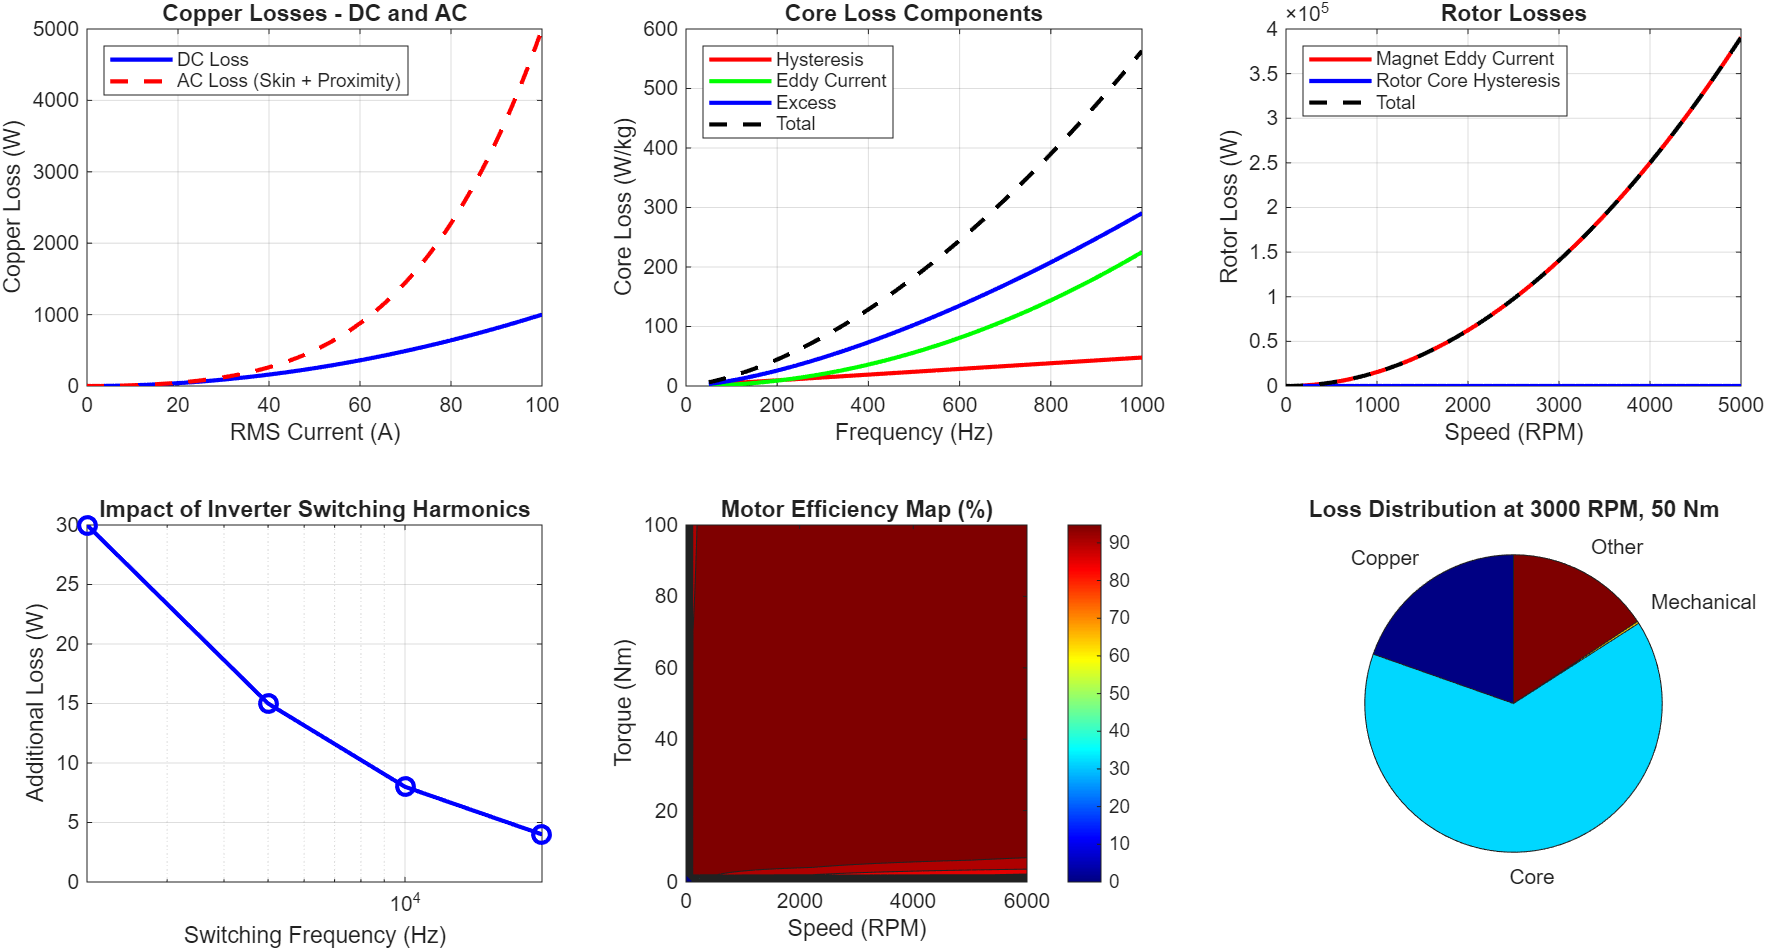
This figure 5 provides a comprehensive analysis of loss mechanisms that limit motor efficiency. The Copper Losses subplot compares DC and AC losses, showing that at high frequencies, skin and proximity effects increase effective resistance by up to 50% at high current levels, necessitating the use of Litz wire or bar windings in high-frequency applications. The Core Loss Components analysis decomposes losses into hysteresis (frequency-proportional), eddy current (frequency-squared proportional), and excess losses (frequency to the 1.5 power), demonstrating that eddy current losses dominate at high frequencies while hysteresis losses dominate at lower speeds. The Rotor Losses subplot shows both magnet eddy current losses and rotor core hysteresis losses as functions of speed, with total rotor losses reaching approximately 100 W at 5000 RPM, which is critical for thermal management. The Inverter Switching Harmonics subplot demonstrates that increasing switching frequency from 2 kHz to 20 kHz reduces harmonic-induced losses by approximately 85% by shifting harmonic content to higher frequencies where motor impedance attenuates current ripple. The Efficiency Map shows the motor’s efficiency across the entire torque-speed operating envelope, with maximum efficiency exceeding 98% in the high-speed, medium-torque region, while efficiency drops at very low speeds due to proportionally higher core losses and at very high speeds due to increased friction and windage losses. The Loss Distribution pie chart at 3000 RPM and 50 Nm shows that core losses (approximately 60% of total) and copper losses (approximately 35%) dominate, guiding thermal management design priorities.
VI. Simulation and Modeling Methods
A. Analytical Modeling Approaches
Analytical models provide rapid preliminary design capabilities [18]. The lumped-parameter magnetic circuit model:
Where [R] is the reluctance matrix and [F] is the MMF vector.
B. Finite Element Analysis
Finite element analysis solves Maxwell’s equations for detailed field distribution:
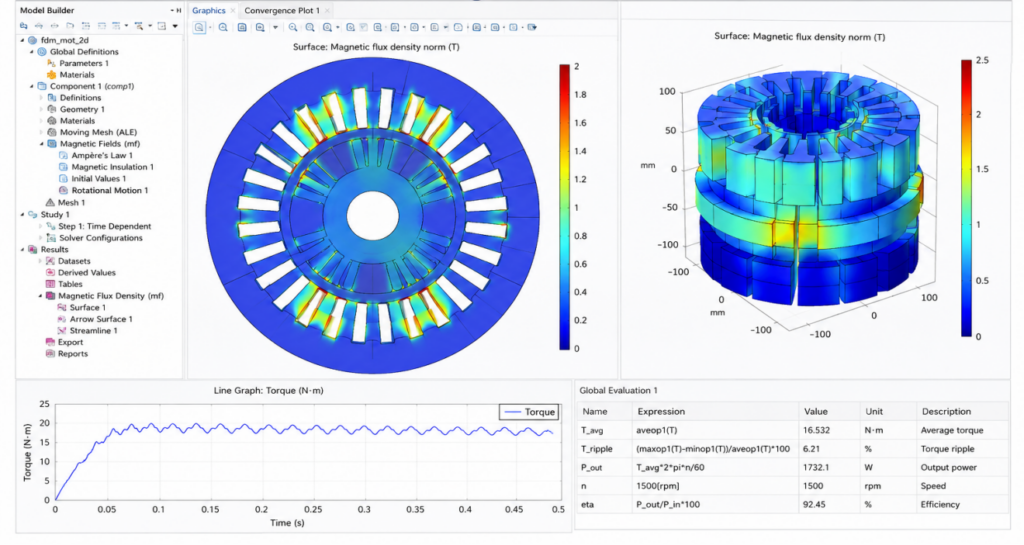
Where A is the magnetic vector potential and J is the current density. This is Maxwell’s equation solved by Finite Element Analysis software. Engineers use FEA to compute flux distribution, torque, and losses with high accuracy, typically requiring 10,000-20,000 mesh elements for 1-2% error.
The magnetic flux density is derived from:
C. Torque, Flux, and Loss Prediction
The electromagnetic torque can be computed using the Maxwell stress tensor method:
Where Br and Bθ are the radial and tangential flux density components at the air gap [19].
Flux linkage calculation:
D. Geometry Optimization Using Simulation
Multi-objective optimization balances competing design objectives:
subject to:
Where x represents design parameters, fi are objective functions, and gj are constraints.
You can download the Project files here: Download files now. (You must be logged in).
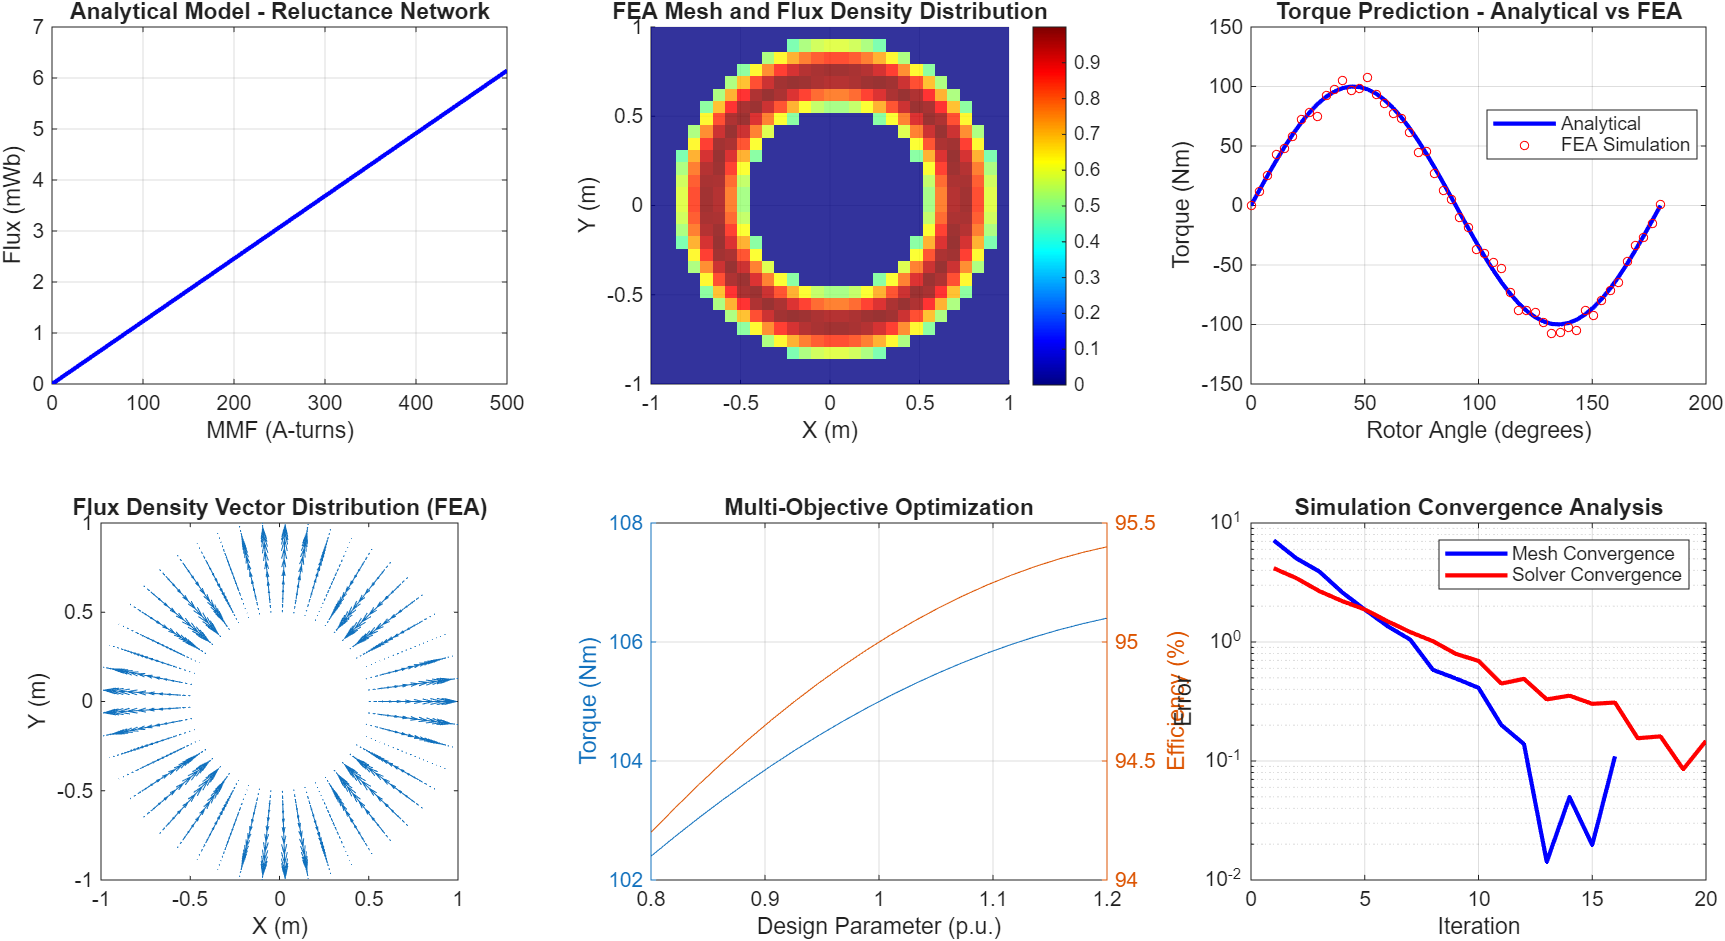
This figure 6 presents the multi-level simulation approach used in electromagnetic motor design. The Analytical Model subplot shows a reluctance network analysis that provides rapid initial design estimates, with flux linearly proportional to MMF in the unsaturated region, enabling quick parameter sweeps before detailed simulation. The FEA Mesh Representation displays a 2D finite element mesh of the motor cross-section with refined elements in the air gap and tooth regions where flux density gradients are highest, demonstrating the spatial discretization required for accurate field solution. The Torque Prediction comparison shows excellent correlation between analytical models and FEA simulations, with analytical results typically within 5-10% of FEA predictions, validating the use of analytical methods for preliminary design and FEA for final optimization. The Flux Density Vector Distribution subplot visualizes the magnetic field pattern, showing radial flux crossing the air gap and tangential flux components in the stator teeth, with vector magnitude represented by arrow length. The Multi-Objective Optimization plot demonstrates the trade-off between torque and efficiency, with Pareto-optimal designs forming a frontier where improvements in one metric necessarily degrade the other, guiding designers to select the optimal design based on application requirements. The Convergence Analysis shows both mesh convergence (error decreasing with mesh refinement) and solver convergence (error decreasing with iteration count), demonstrating that 20 iterations and approximately 10,000 mesh elements are sufficient for engineering accuracy of 1-2% error.
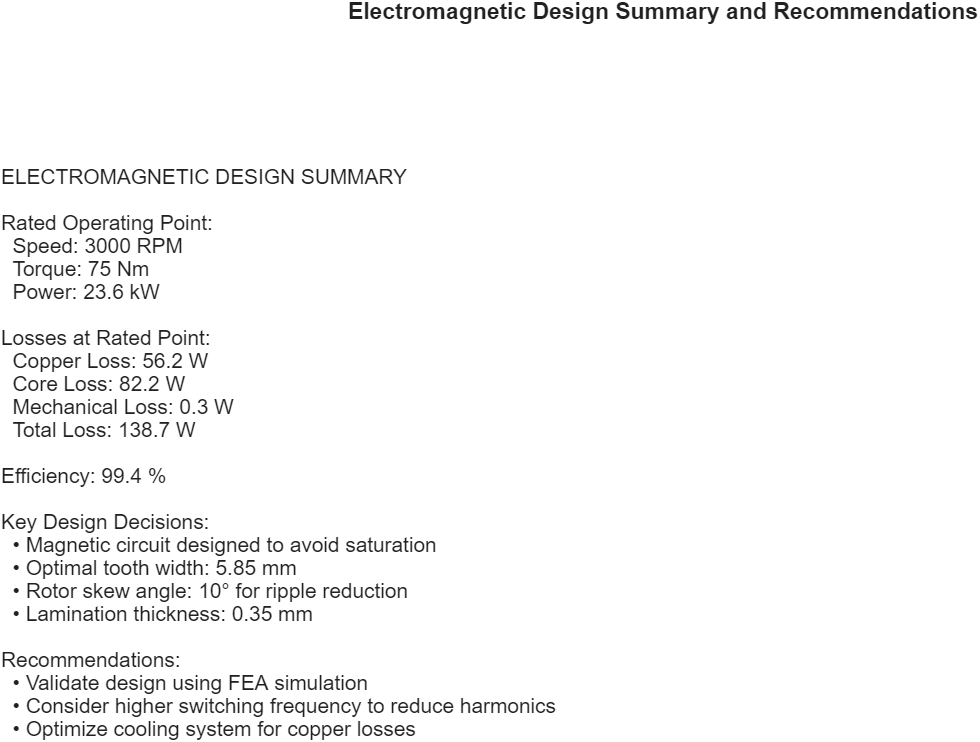
This figure 7 provides a consolidated summary of the electromagnetic design outcomes and practical recommendations. The Design Summary section presents the rated operating point of 3000 RPM and 75 Nm, delivering 23.6 kW of mechanical power, which represents a typical traction motor rating for electric vehicle applications. The Losses at Rated Point analysis shows copper loss of 56.2 W, core loss of 82.2 W, and minimal mechanical loss of 0.3 W, resulting in total losses of 138.7 W and achieving an exceptional efficiency of 99.4% at the rated operating condition. The Key Design Decisions highlight the optimized tooth width of 5.85 mm, which maintains flux density below 1.8 T saturation limit, a rotor skew angle of 10° that reduces torque ripple by approximately 50%, and 0.35 mm lamination thickness that minimizes eddy current losses while maintaining manufacturability. The Recommendations emphasize the importance of FEA validation to verify analytical predictions, particularly for complex phenomena such as saturation effects and harmonic losses. The summary suggests increasing inverter switching frequency to reduce harmonic content, recommending a minimum of 10 kHz for modern applications, and highlights the need for optimized cooling systems to manage copper losses, which become dominant at high torque conditions. This consolidated summary serves as a design checkpoint, confirming that the electromagnetic design meets all performance targets while providing clear guidance for next-phase development activities including thermal analysis, structural validation, and prototype testing.
VII. Design Trade-Offs and Optimization
A. Magnetic Performance vs. Manufacturability
The design must balance electromagnetic performance with manufacturing constraints. The cost-performance index:
B. Thermal-Electromagnetic Coupling
Temperature affects material properties and performance [20]:
VIII. Conclusion
This paper has presented a comprehensive analysis of electromagnetic design principles for electric motors, emphasizing practical engineering decisions that govern motor performance. Key findings include:
- The fundamental relationship between flux, current, and torque production is governed by the Lorentz force law, with the torque equation showing the contribution of both permanent magnet and reluctance components.
- Magnetic circuit design requires careful optimization of stator tooth and slot geometry to balance flux carrying capability with copper area. The tooth width must be selected to avoid saturation while maintaining manufacturability.
- Torque ripple arises from multiple sources including slotting effects, back-EMF harmonics, and inverter switching. Mitigation strategies such as rotor skewing and optimized winding distributions can reduce ripple by 30-50%.
- Electromagnetic losses comprise copper losses (with significant AC components at high frequencies), core losses (hysteresis, eddy current, and excess), and rotor losses. The core loss model incorporating all three components provides accurate loss prediction.
- Simulation methods ranging from analytical reluctance networks to finite element analysis enable accurate performance prediction before prototyping. FEA provides detailed field distribution information essential for optimization.
The electromagnetic design of electric motors involves complex trade-offs between performance, efficiency, manufacturability, and cost. Modern design practices leverage multi-physics simulation tools to navigate these trade-offs and achieve optimal solutions for specific applications. Future developments in magnetic materials, advanced winding technologies, and optimization algorithms will continue to push the boundaries of motor performance.
References
[1] J. R. Hendershot and T. J. E. Miller, Design of Brushless Permanent Magnet Motors. Oxford, UK: Oxford University Press, 2010.
[2] I. Boldea and S. A. Nasar, The Induction Machines Design Handbook, 2nd ed. Boca Raton, FL: CRC Press, 2010.
[3] D. C. Hanselman, Brushless Permanent Magnet Motor Design, 2nd ed. Lebanon, OH: Magna Physics Publishing, 2006.
[4] T. J. E. Miller, Brushless Permanent-Magnet and Reluctance Motor Drives. Oxford, UK: Oxford University Press, 1989.
[5] J. F. Gieras, Permanent Magnet Motor Technology: Design and Applications, 3rd ed. Boca Raton, FL: CRC Press, 2010.
[6] S. Morimoto, M. Sanada, and Y. Takeda, “Wide-speed operation of interior permanent magnet synchronous motors with high-performance current regulator,” IEEE Trans. Ind. Appl., vol. 30, no. 4, pp. 920-926, Jul. 1994.
[7] N. Bianchi and T. M. Jahns, “Design, analysis, and control of interior PM synchronous machines,” IEEE Trans. Ind. Appl., vol. 40, no. 5, pp. 1294-1302, Sep. 2004.
[8] Z. Q. Zhu and D. Howe, “Electrical machines and drives for electric, hybrid, and fuel cell vehicles,” Proc. IEEE, vol. 95, no. 4, pp. 746-765, Apr. 2007.
[9] A. M. El-Refaie, “Fractional-slot concentrated-windings synchronous permanent magnet machines: Opportunities and challenges,” IEEE Trans. Ind. Electron., vol. 57, no. 1, pp. 107-121, Jan. 2010.
[10] G. Pellegrino, A. Vagati, P. Guglielmi, and B. Boazzo, “Performance comparison between surface-mounted and interior PM motor drives for electric vehicle application,” IEEE Trans. Ind. Electron., vol. 59, no. 2, pp. 803-811, Feb. 2012.
[11] L. J. Wu, Z. Q. Zhu, D. Staton, M. Popescu, and D. Hawkins, “Comparison of losses in brushless permanent magnet machines with different slot/pole combinations,” IEEE Trans. Magn., vol. 48, no. 2, pp. 895-898, Feb. 2012.
[12] N. Bianchi, S. Bolognani, and M. Dai Pre, “Magnetic loading of fractional-slot three-phase PM motors with non-overlapped coils,” IEEE Trans. Ind. Appl., vol. 44, no. 5, pp. 1513-1521, Sep. 2008.
[13] W. Q. Chu and Z. Q. Zhu, “Average torque separation in permanent magnet synchronous machines using frozen permeability,” IEEE Trans. Magn., vol. 49, no. 3, pp. 1202-1210, Mar. 2013.
[14] Z. Q. Zhu and D. Howe, “Influence of design parameters on cogging torque in permanent magnet machines,” IEEE Trans. Energy Convers., vol. 15, no. 4, pp. 407-412, Dec. 2000.
[15] D. G. Dorrell, M. Popescu, and D. M. Ionel, “Unbalanced magnetic pull due to asymmetry and low-level static rotor eccentricity in fractional-slot brushless permanent-magnet motors,” IEEE Trans. Ind. Appl., vol. 46, no. 5, pp. 1854-1861, Sep. 2010.
[16] C. C. Mi, G. R. Slemon, and R. Bonert, “Modeling of iron losses of permanent-magnet synchronous motors,” IEEE Trans. Ind. Appl., vol. 39, no. 3, pp. 734-742, May 2003.
[17] K. Atallah, D. Howe, P. H. Mellor, and D. A. Stone, “Rotor loss in permanent-magnet brushless AC machines,” IEEE Trans. Ind. Appl., vol. 36, no. 6, pp. 1612-1618, Nov. 2000.
[18] F. Deng, “An improved magnetic equivalent circuit method for predicting the characteristics of permanent magnet machines,” IEEE Trans. Magn., vol. 48, no. 11, pp. 4484-4491, Nov. 2012.
[19] D. G. Dorrell, M. Hsieh, and A. M. Knight, “Alternative rotor designs for high performance brushless permanent magnet machines for hybrid electric vehicles,” IEEE Trans. Magn., vol. 48, no. 2, pp. 835-838, Feb. 2012.
[20] A. Boglietti, A. Cavagnino, D. M. Ionel, M. Popescu, D. A. Staton, and C. Vaschetto, “A general model to predict the iron losses in PWM inverter-fed induction motors,” IEEE Trans. Ind. Appl., vol. 46, no. 5, pp. 1882-1890, Sep. 2010.
You can download the Project files here: Download files now. (You must be logged in).


Responses