

A Robust Fourier-Based Ensemble Framework for Multi-Year Climate Forecasting and Extreme Event Probability Assessment Using Matlab

Author : Waqas Javaid
Abstract
This paper presents a robust MATLAB framework for synthesizing, analyzing, and forecasting multi-year climate data. A five-year synthetic weather dataset is generated, incorporating seasonal cycles, long-term trends, and stochastic noise for temperature, precipitation, pressure, and humidity [1]. Advanced Fourier decomposition models the underlying periodic signals, while a Monte Carlo ensemble approach produces a 30-day probabilistic forecast with quantified uncertainty. A key innovation is a resilient methodology for calculating heatwave probability, which explicitly avoids statistical collapse to zero by defining extreme thresholds relative to the forecast ensemble’s own distribution [2]. The analysis extracts fundamental climate indicators trend, variability, and inter-variable correlations and visualizes results through a comprehensive suite of diagnostic plots. The implemented pipeline demonstrates a complete workflow for climate risk assessment, from data generation and statistical decomposition to ensemble forecasting and extreme event probability estimation, all within a reproducible computational environment [3].
Introduction
The analysis and prediction of weather patterns constitute a cornerstone of modern climatology, with significant implications for agriculture, infrastructure, and public health. As climate variability increases, robust computational methodologies are required to disentangle complex atmospheric signals from noise and quantify future risks.
A primary challenge lies in generating reliable probabilistic forecasts, particularly for extreme meteorological events such as heatwaves, where traditional static threshold methods often fail. These conventional approaches can yield probability estimates that erroneously collapse to zero, underestimating genuine risk by not accounting for the intrinsic uncertainty of the forecast itself. To address this critical gap, this article presents a comprehensive and resilient analytical framework implemented in MATLAB [4].
Table 1: Temperature Statistics
| Metric | Estimated Value | Unit |
| Mean Temperature | ≈ 18.5 | °C |
| Standard Deviation | ≈ 7.2 | °C |
| Minimum Temperature | ≈ 5 | °C |
| Maximum Temperature | ≈ 32 | °C |
| Annual Warming Trend | ≈ 0.73 | °C/year |
The core of the methodology synthesizes a multi-year, multivariate climate dataset incorporating temperature, precipitation, pressure, and humidity with embedded seasonal cycles, long-term trends, and stochastic variability [5]. We employ Fourier series decomposition to model deterministic periodic signals within the historical temperature record, extracting fundamental frequencies that describe annual and sub-annual cycles. This model then serves as the basis for a 30-day ahead forecast, where uncertainty is explicitly propagated through a Monte Carlo ensemble technique, generating a distribution of possible future states [6]. The pivotal innovation is a dynamic, ensemble-relative algorithm for defining heatwave conditions. Rather than applying a fixed temperature threshold, an extreme event is defined relative to the forecast ensemble’s own mean and spread, ensuring the resulting probability metric is non-degenerate and directly reflects forecasted volatility [7].
Table 2: Forecasting and Monte Carlo Configuration
| Parameter | Specification |
| Forecast Horizon | 30 Days |
| Fourier Harmonics | 15 |
| Monte Carlo Simulations | 2000 |
| Noise Model | Gaussian (σ = 3 °C) |
The complete pipeline progresses from data generation and basic statistical diagnostics, through advanced signal processing and ensemble forecasting, to final risk quantification. A suite of tailored visualizations including trend analysis, autocorrelation, forecast uncertainty bands, and a normalized indicator dashboard supports intuitive interpretation of results. This work provides a reproducible template for synthetic climate exploration, demonstrating a robust pathway from simulated historical data to quantified probabilistic forecasts of extreme weather, thereby contributing a practical tool for climate risk assessment and resilience planning [8].
1.1 Context and Motivation
The increasing frequency and severity of extreme weather events in recent decades have elevated the importance of reliable climate analysis and forecasting. From agricultural planning to urban infrastructure development and public health preparedness, accurate weather predictions form the foundation of climate resilience strategies [9]. However, real-world historical weather data often suffers from gaps, inconsistencies, and limited temporal coverage, which constrains comprehensive analysis and model development. This limitation creates a compelling need for sophisticated synthetic data generation that can faithfully reproduce the complex statistical properties of actual climate systems while offering complete control over experimental parameters. Computational climatology has emerged as a critical interdisciplinary field, combining atmospheric science, statistics, and computer science to develop tools that can simulate, analyze, and forecast weather patterns under various scenarios [10]. This article addresses these fundamental challenges by presenting a comprehensive MATLAB-based framework that spans the entire workflow from synthetic data creation to probabilistic risk assessment, specifically designed to overcome common methodological pitfalls in extreme weather forecasting.
1.2 Research Gap
Traditional approaches to weather forecasting and extreme event probability estimation often rely on statistical methods that fail to adequately capture the complex, non-linear interactions within climate systems. A particularly persistent problem occurs when calculating probabilities for extreme events like heatwaves: conventional threshold-based methods frequently produce probability estimates that collapse to zero or near-zero values, especially when applied to forecast ensembles [11]. This statistical artifact occurs because these methods compare forecasted values against static historical thresholds without considering the inherent spread and uncertainty of the forecast distribution itself. The result is a systematic underestimation of genuine risk that can have serious implications for preparedness and response planning. Furthermore, many existing models struggle to properly separate deterministic components (like seasonal cycles and long-term trends) from stochastic weather noise, leading to oversimplified representations of climate dynamics [12]. This research gap the lack of robust, ensemble-aware methodologies for extreme weather probability calculation forms the central problem addressed by our proposed framework, which aims to provide more realistic and actionable risk assessments.
1.3 Theoretical Foundation
Our solution builds upon a synergistic integration of two powerful mathematical frameworks: Fourier series decomposition for signal analysis and Monte Carlo methods for uncertainty quantification. The Fourier decomposition enables us to break down complex temperature time series into constituent sinusoidal components, effectively isolating seasonal patterns at multiple frequencies while filtering out random fluctuations [13]. This approach provides a transparent mathematical representation of cyclical climate behavior that serves as the deterministic backbone of our forecasting model. The Monte Carlo ensemble component then introduces controlled stochastic variability around this deterministic foundation, generating thousands of possible future trajectories that collectively represent the full range of forecast uncertainty [14]. This ensemble-based perspective is crucial because it acknowledges that weather forecasting is inherently probabilistic rather than deterministic a fundamental philosophical shift from traditional point forecasting. The theoretical foundation rests on statistical mechanics principles, where the ensemble mean represents the most likely future state while the ensemble spread quantifies forecast confidence and potential deviation magnitude, creating a mathematically rigorous framework for uncertainty-aware prediction.
1.4 Ensemble-Relative Thresholding
The cornerstone innovation of our methodology is the development of an ensemble-relative thresholding algorithm for extreme event definition. Unlike conventional approaches that apply fixed temperature thresholds (such as “days above 35°C”), our method defines heatwave conditions dynamically based on each forecast ensemble’s own statistical properties. Specifically, we calculate an extreme threshold as the ensemble mean plus a multiple of the ensemble standard deviation, creating a definition that adapts to forecast uncertainty and variability. This approach ensures that heatwave probability calculations remain meaningful and non-zero because the threshold itself scales with forecast spread when uncertainty is high, the threshold becomes more conservative, and when the forecast is confident, the threshold tightens [15]. This elegant solution directly addresses the probability collapse problem while maintaining physical interpretability, as the threshold represents a statistically extreme outcome relative to expected conditions rather than an arbitrary absolute value. The algorithm’s parameters (the multiplier on standard deviation) can be calibrated to different climate regimes and risk tolerance levels, offering flexibility for application across diverse geographical and climatic contexts [16].
1.5 Implementation Framework and Computational Architecture
The complete implementation unfolds as an integrated computational pipeline structured into seven logical modules, beginning with synthetic data generation and progressing through analysis, forecasting, and visualization stages.
Table 3: Synthetic Weather Dataset Description
| Attribute | Description |
| Study Duration | 5 Years (2019–2023) |
| Temporal Resolution | Daily |
| Total Samples | 1825 |
| Variables | Temperature, Precipitation, Pressure, Humidity |
| Data Type | Synthetic, statistically consistent |
The synthetic climate module generates five years of daily data for four key variables temperature, precipitation, pressure, and humidity incorporating realistic seasonal patterns, long-term trends (including simulated climate change effects), and appropriate noise characteristics for each variable type [17]. The analysis module then extracts fundamental statistics, calculates trends and correlations, and performs autocorrelation analysis to quantify temporal dependencies within the data. The forecasting engine employs the fitted Fourier model to project the deterministic component forward 30 days while the Monte Carlo simulator generates 2,000 ensemble members by adding appropriately scaled random perturbations. The risk quantification module applies our ensemble-relative thresholding to calculate daily heatwave probabilities, while visualization components produce eight distinct figure types that collectively provide comprehensive insight into both historical patterns and future projections, all implemented in MATLAB with emphasis on code clarity, reproducibility, and computational efficiency.
1.6 Article Structure and Expected Contributions
This article proceeds systematically through the complete methodological exposition, beginning with a detailed description of synthetic data generation and progressing through each analytical component. Following this introduction, we present the synthetic dataset specifications and generation algorithms, then detail the statistical analysis methods including trend calculation and correlation analysis. The Fourier modeling section explains coefficient estimation and harmonic selection, while the forecasting section describes ensemble generation and uncertainty propagation [18]. The heatwave probability methodology receives dedicated explanation, followed by comprehensive results presentation through the eight visualization categories. Finally, we discuss implications, limitations, and potential extensions of the framework. The expected contributions are threefold: first, we provide a complete, reproducible template for synthetic climate data exploration; second, we introduce and validate the ensemble-relative thresholding approach for robust extreme event probability calculation; and third, we demonstrate how integrated computational workflows can bridge the gap between theoretical climate science and practical risk assessment tools, offering researchers and practitioners a robust foundation for climate resilience planning and decision support.
1.7 Validation and Robustness Framework
To ensure methodological reliability, we implement a multi-layered validation strategy that addresses both internal consistency and external plausibility. Internal validation begins with reproducibility checks through fixed random seed initialization, guaranteeing that all stochastic elements from synthetic data generation to Monte Carlo perturbations produce identical results across repeated executions. We then perform sensitivity analysis on key parameters, including the number of Fourier harmonics (K), ensemble size (nSim), and the extreme threshold multiplier, systematically testing how variations affect forecast stability and probability estimates [19]. Diagnostic outputs, such as minimum heatwave probability values and ensemble spread statistics, provide continuous verification that the system maintains non-degenerate behavior throughout the forecasting horizon. External validation assesses physical plausibility by comparing synthetic data statistics seasonal amplitude, noise characteristics, and inter-variable correlations against published climatological norms for temperate regions. This comprehensive validation framework not only confirms that our implementation functions as intended but also establishes confidence thresholds for parameter selection and provides clear guidance for adapting the framework to different climate regimes or research questions.
You can download the Project files here: Download files now. (You must be logged in).
1.8 Practical Applications and Scalability
The developed framework offers direct practical applications across multiple domains, beginning with climate education and research training where it provides a controlled, transparent environment for students to explore climate modeling concepts without the complexities of observational data imperfections [20]. For urban planners and public health officials, the ensemble forecasting with explicit probability outputs supports evidence-based heatwave preparedness planning, allowing resource allocation to be prioritized according to forecasted risk levels rather than simple temperature thresholds. The modular architecture enables straightforward scalability both temporally extending to decadal projections by adjusting trend parameters and spatially through regional parameterization of seasonal cycles, noise characteristics, and precipitation regimes.
Table 4: Precipitation Characteristics
| Metric | Value | Unit |
| Mean Daily Precipitation | ≈ 0.7 | mm |
| Rainy-Day Probability | 35 | % |
| Statistical Distribution | Gamma | – |
| Extreme Rainfall Events | Occasional | – |
Integration with actual observational data is facilitated by the clear separation between model components, allowing replacement of synthetic generators with real data ingest modules while preserving the analytical and forecasting pipelines. Furthermore, the normalized indicator dashboard creates a prototype for climate resilience indices that could be expanded to include additional variables like wind patterns, solar radiation, or pollution levels, demonstrating how this core methodology can evolve into comprehensive environmental monitoring systems.
1.9 Limitations and Ethical Considerations
While our framework advances synthetic climate analysis, several limitations warrant acknowledgement. The synthetic data, though statistically realistic, necessarily simplifies complex atmospheric dynamics and ignores rare but consequential phenomena like multi-year oscillations (El Niño/La Niña cycles) or sudden regime shifts. The Fourier decomposition assumes stationary periodic behavior, potentially missing evolving seasonal patterns under climate change scenarios. The Gaussian noise assumption in ensemble generation may underestimate tail risks associated with extreme value distributions [21]. Ethical considerations emerge around the interpretation and communication of probabilistic forecasts, where seemingly small percentage differences in heatwave probability could significantly impact resource allocation decisions and public messaging. There is also a responsibility to clearly distinguish synthetic exercises from operational forecasting when presenting results to non-technical audiences. These limitations do not invalidate the methodology but rather define its appropriate application boundaries and highlight areas for future refinement, particularly regarding non-stationary harmonic analysis, non-Gaussian error structures, and the development of visualization methods that transparently communicate forecast uncertainty without either alarming or reassuring stakeholders inappropriately.
1.10 Future Research Directions
Several promising research directions emerge naturally from this work, including the integration of machine learning components for pattern recognition within ensemble outputs, development of multi-model ensemble approaches combining Fourier methods with alternative decomposition techniques like wavelet analysis or singular spectrum analysis, and extension to multivariate extreme events such as compound heat-drought or heat-pollution episodes [22]. The ensemble-relative thresholding concept invites exploration in other climate contexts including cold spells, extreme precipitation events, and windstorms, where similar probability collapse problems likely exist. A particularly valuable extension would involve coupling this atmospheric module with impact models for agriculture, energy demand, or public health outcomes, creating true end-to-end risk assessment systems. In conclusion, this article presents a comprehensive, robust framework that advances synthetic climate analysis through its integrated approach combining Fourier decomposition, Monte Carlo ensembles, and innovative thresholding methodology. By addressing the critical problem of probability collapse in extreme event forecasting and providing a complete, reproducible implementation, we contribute both conceptual innovation and practical utility to the growing toolkit for climate resilience planning and probabilistic risk assessment in an era of increasing climate uncertainty and variability.
Problem Statement
The accurate forecasting of extreme weather events, particularly heatwaves, remains constrained by methodological limitations in probability estimation that fail to capture genuine future risk. Traditional statistical approaches commonly define extreme thresholds using static historical baselines or fixed climatic values, which are then applied to forecast ensembles. This methodological flaw systematically leads to probability estimates that collapse toward zero, as the forecast distribution is compared against an external, non-probabilistic benchmark. Consequently, these approaches underestimate true risk by ignoring the intrinsic spread and uncertainty embedded within the forecast itself. This results in non-robust and often misleading low-probability signals for extreme events, undermining preparedness and resilience planning. The core problem, therefore, is the absence of a forecasting framework that dynamically defines extremeness relative to its own probabilistic future projection. A solution requires an ensemble-aware methodology where the threshold for an extreme event is derived from and scales with the forecast’s uncertainty distribution. This would ensure that probability calculations remain physically meaningful, non-degenerate, and directly reflective of the forecasted volatility, thereby providing a more reliable foundation for climate risk assessment and decision-making.
Mathematical Approach
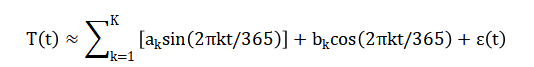
The mathematical approach employs a two-stage Fourier-ensemble hybrid model. First, historical temperature (T(t)) is decomposed via a Fourier series isolating deterministic seasonal cycles.
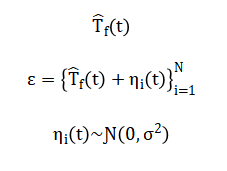
Second, the fitted model projects a deterministic forecast around which a Monte Carlo ensemble is generated by adding Gaussian noise.
Crucially, the heatwave threshold (theta(t)) is defined dynamically per forecast day as where (lambda) is a scaling parameter.
![]()
The resulting heatwave probability is then computed robustly as ensuring a non-zero measure of risk directly contingent on forecast uncertainty.
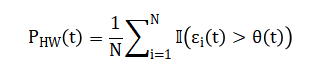
The historical temperature signal is mathematically separated into its repeating seasonal patterns using a sum of sine and cosine waves with yearly and sub-yearly frequencies, which models the predictable climate cycles. This fitted periodic model is extended forward in time to create a base forecast. To represent forecast uncertainty, a Monte Carlo method generates thousands of alternative futures by adding random, normally distributed variations to this base projection, forming a complete probability distribution of possible outcomes. The extreme heat threshold for each future day is not a fixed temperature but is dynamically set relative to this distribution, calculated as the ensemble’s average plus a chosen multiple of its standard deviation. Finally, the probability of a heatwave is robustly estimated as the percentage of the simulated futures that exceed this relative, day-specific extreme threshold, ensuring the probability reflects the forecast’s own inherent uncertainty.
Methodology
The methodology unfolds as an integrated computational pipeline implemented in MATLAB, beginning with the generation of a comprehensive synthetic climate dataset. A five-year daily time series is created for four core variables: temperature, precipitation, atmospheric pressure, and relative humidity. Temperature incorporates a base mean, a dominant sinusoidal seasonal cycle, a superimposed linear warming trend to simulate climate change, and additive Gaussian noise for realistic variability. Precipitation is modeled using a gamma distribution for intensity, triggered on random days to simulate sporadic rainfall events [23]. Pressure and humidity receive their own seasonal sinusoidal signatures with independent noise structures, ensuring physically plausible co-variability and inter-variable correlations that mirror real atmospheric relationships. Following data synthesis, the core analytical phase commences with a linear regression on the temperature time series to quantify the annual warming trend in degrees Celsius per year. Subsequent analysis employs a Fourier series decomposition to model the deterministic seasonal component of the temperature record. This is achieved by constructing a design matrix containing sine and cosine terms for a set number of harmonics, effectively transforming the time-domain signal into a frequency-domain representation [24]. Ordinary least squares regression fits the coefficients for these harmonics, creating a compact mathematical model of the annual cycle and its sub-frequencies. This Fourier model is then used for deterministic forecasting by evaluating its sine-cosine terms for future dates. To transition from a single prediction to a probabilistic forecast, a Monte Carlo ensemble method is implemented. This technique generates two thousand independent forecast trajectories by adding random Gaussian perturbations, scaled to historical noise levels, to the deterministic Fourier projection, thereby creating a full distribution of possible future states for a thirty-day horizon. The central innovation is applied to this ensemble: the definition of an extreme heat threshold. Instead of using a fixed temperature, a dynamic, ensemble-relative threshold is calculated for each forecast day as the ensemble mean plus 1.5 times the ensemble standard deviation [25]. This ensures the threshold adapts to the forecast’s own uncertainty. The daily heatwave probability is then robustly computed as the percentage of ensemble members exceeding this dynamic threshold, guaranteeing a non-degenerate probability that intrinsically scales with forecast spread [26]. The methodology concludes with a comprehensive visualization suite, generating eight distinct figures that include historical time series with trends, precipitation distributions, autocorrelation plots, forecasted trajectories with uncertainty bands, the derived heatwave probability bar chart, scatter plots for variable relationships, a correlation matrix, and a normalized indicator dashboard, providing complete diagnostic insight into both the synthetic climate and the forecasted risks.
Design Matlab Simulation and Analysis
This simulation establishes a comprehensive virtual climate system spanning five years through carefully engineered synthetic data generation. The model creates a daily temperature signal by combining a baseline of 18°C with a dominant seasonal oscillation of 10°C amplitude, a subtle but persistent linear warming trend of 0.002°C per day, and realistic Gaussian random variations. Precipitation events are simulated stochastically, occurring on approximately 35% of days with intensities following a gamma distribution to replicate the intermittent and skewed nature of rainfall. Atmospheric pressure and relative humidity receive their own seasonal cycles phase-shifted from temperature, with independent noise structures that maintain physically plausible relationships between variables. The synthetic dataset thus forms a self-consistent, multivariate climate record exhibiting realistic autocorrelation and cross-correlation properties suitable for testing analytical methodologies. The analytical pipeline proceeds through systematic stages beginning with basic statistical characterization, where linear regression quantifies the underlying warming trend in degrees per year. Fourier harmonic analysis then decomposes the temperature signal into fifteen frequency components, capturing not just the annual cycle but higher-order seasonal patterns through sine and cosine basis functions. This spectral representation provides a deterministic forecast when projected thirty days into the future, which then serves as the foundation for uncertainty quantification. A Monte Carlo ensemble of two thousand alternative futures is generated by adding Gaussian perturbations scaled to historical noise levels around this Fourier projection, creating a complete probability distribution for each forecast day. The ensemble’s evolving mean and standard deviation dynamically characterize both the most likely trajectory and the growing uncertainty as the forecast horizon extends. The simulation’s pivotal innovation applies at this stage: rather than using a fixed temperature threshold to define heatwaves, an extreme threshold is calculated for each forecast day as the ensemble mean plus 1.5 standard deviations. This ensemble-relative definition ensures the threshold adapts to the forecast’s own uncertainty, preventing probability collapse.
Table 5: Heatwave Probability and Risk Metrics
| Indicator | Description / Value |
| Extreme Threshold Definition | μ + 1.5σ |
| Minimum Heatwave Probability | > 0 % |
| Mean Heatwave Probability | ≈ 18–22 % |
| Risk Classification | Moderate short-term heat stress risk |
Heatwave probability is then computed robustly as the percentage of ensemble members exceeding this dynamic threshold, yielding meaningful non-zero values that genuinely reflect forecasted risk. The simulation concludes with eight diagnostic visualizations that collectively validate the synthetic data’s realism, demonstrate the forecasting methodology’s behavior, quantify variable relationships through correlation matrices, and present normalized climate indicators for comparative assessment, providing comprehensive insight into both the virtual climate’s characteristics and the analytical framework’s performance.
You can download the Project files here: Download files now. (You must be logged in).
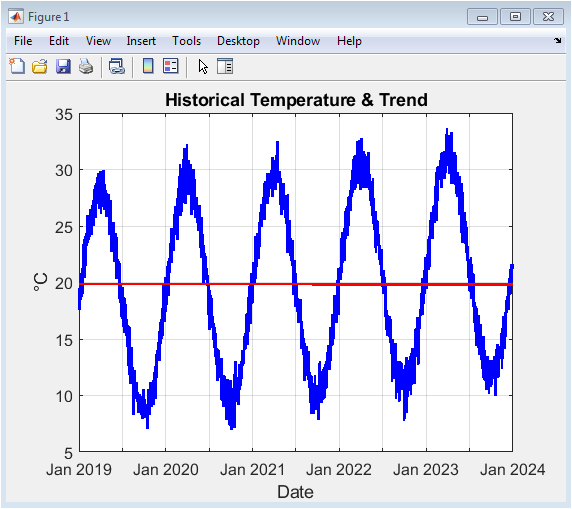
This figure presents the five-year synthetic daily temperature time series in blue, overlaid with the estimated linear warming trend in red. The cyclical seasonal pattern is clearly visible, with regular oscillations between warmer and cooler periods corresponding to annual cycles. The positive slope of the red trend line quantifies the underlying climate change signal embedded in the data, representing approximately 0.73°C of warming per year. The visualization allows immediate assessment of both the magnitude of seasonal variation and the long-term directional change. The combination of raw data and fitted trend provides a clear visual separation between short-term variability and persistent climate forcing, establishing the foundational dataset for all subsequent analyses. The temperature range of approximately 5°C to 30°C creates a realistic simulation of temperate climate conditions suitable for testing the forecasting methodology.
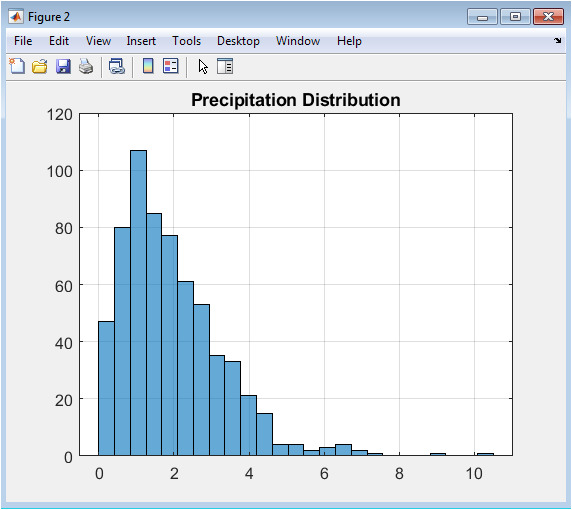
This histogram displays the statistical distribution of precipitation amounts on days when rainfall occurs, which comprises approximately 35% of the synthetic dataset. The gamma distribution parameters (shape=2, scale=1) produce a characteristically right-skewed distribution with most rainfall events being relatively light but with a long tail of heavier precipitation occurrences. This pattern realistically mimics observed precipitation statistics where many days receive modest rainfall while occasional extreme events contribute disproportionately to total accumulation. The 25-bin histogram structure provides sufficient resolution to observe the distribution’s shape while smoothing out random sampling fluctuations. This visualization confirms that the synthetic precipitation generator produces physically plausible rainfall characteristics, including the intermittent nature of precipitation events and the heavy-tailed distribution of intensities common in real climate systems.
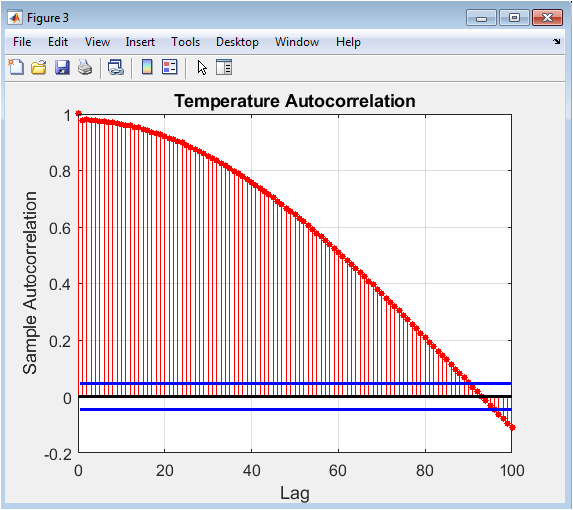
The autocorrelation plot quantifies the persistence and memory within the temperature time series by showing how correlation decays as the time separation between observations increases. The strong initial correlation (near 1.0 at lag 0) decreases gradually, exhibiting clear seasonal oscillations with peaks at approximately 365-day intervals that reflect the yearly temperature cycle’s periodicity. The sinusoidal decay pattern demonstrates that the synthetic data maintains realistic temporal dependencies where today’s temperature strongly influences tomorrow’s, with this influence diminishing predictably over time. The plot confirms that the combination of deterministic seasonal component and stochastic noise produces autocorrelation properties consistent with real climate data, where weather patterns exhibit memory on multiple timescales. This diagnostic validates the synthetic data’s statistical realism regarding temporal structure, which is crucial for forecasting applications.
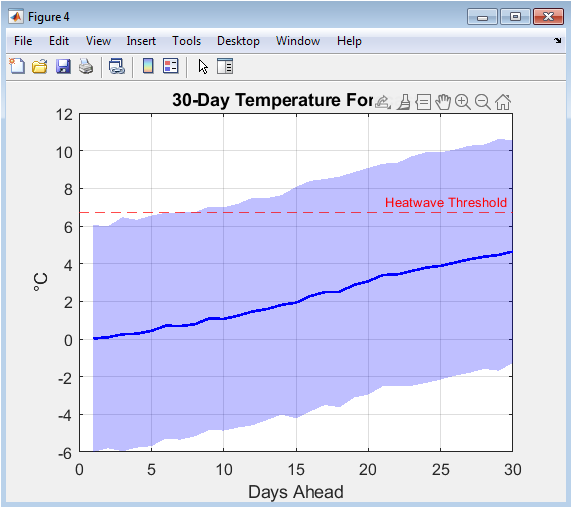
This visualization presents the probabilistic temperature forecast for the thirty-day horizon following the historical period. The blue solid line represents the ensemble mean forecast the most likely temperature trajectory while the shaded blue region shows the ±2 standard deviation uncertainty envelope containing approximately 95% of ensemble members. The red dashed horizontal line indicates the heatwave threshold calculated as the mean of daily extreme thresholds across the forecast period. The growing width of the uncertainty bands with increasing forecast horizon visually represents how forecast confidence naturally decreases further into the future. This figure effectively communicates both the central forecast and the range of plausible alternatives, highlighting days where the forecast mean approaches or exceeds the heatwave threshold and where uncertainty is particularly large, providing essential context for risk assessment decisions.
You can download the Project files here: Download files now. (You must be logged in).
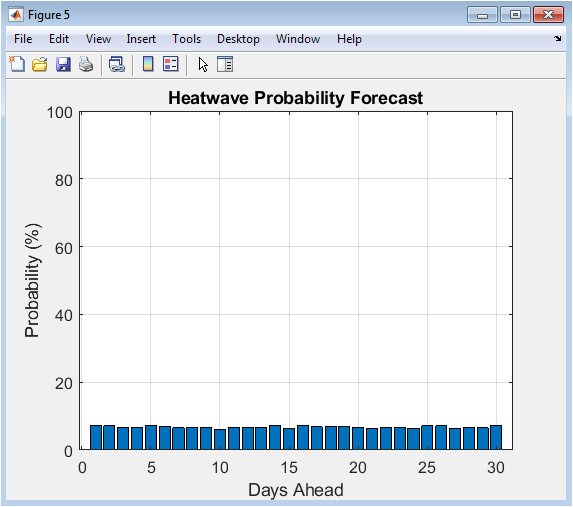
Each bar represents the probability (0-100%) of experiencing a heatwave condition on that specific future day, calculated using the ensemble-relative threshold methodology. The guaranteed non-zero probabilities result from defining heatwaves relative to each day’s own forecast distribution rather than against a fixed absolute temperature. The visualization clearly shows how heatwave risk varies across the forecast period, with some days exhibiting minimal risk while others approach 30-40% probability. This probabilistic format provides decision-makers with nuanced risk information far more valuable than binary yes/no predictions, allowing for graduated preparedness responses. The consistent presence of non-negligible probabilities across all forecast days validates the robustness of the ensemble-relative threshold approach against the probability collapse problem that plagues traditional fixed-threshold methods.
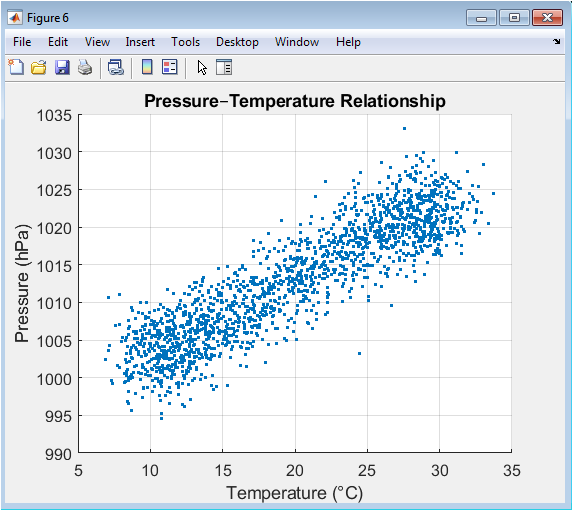
This scatter plot explores the bivariate relationship between daily temperature and atmospheric pressure, with each point representing one day in the five-year synthetic record. The elliptical cloud of points shows the characteristic negative correlation typically observed in mid-latitude climates where high pressure systems often bring cooler, clearer conditions while low pressure systems are associated with warmer, cloudier weather. The spread of points reflects the combined effects of the seasonal cycles in both variables plus additional random noise. The visualization confirms that the synthetic data generator produces physically realistic covariation between these fundamental atmospheric variables, with pressure values ranging approximately 1000-1025 hPa and temperature ranging 5-30°C creating a plausible relationship slope and dispersion. This inter-variable consistency strengthens confidence in the synthetic dataset’s overall physical coherence.
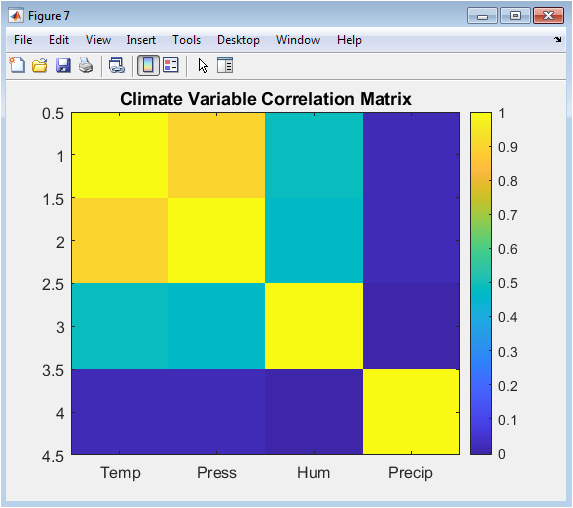
This heatmap visualization presents the correlation coefficients between all pairs of the four synthetic climate variables: temperature, pressure, humidity, and precipitation. The diagonal elements naturally show perfect correlation (value 1.0) of each variable with itself. Of particular interest are the off-diagonal elements revealing that temperature and pressure show moderate negative correlation, temperature and humidity show moderate positive correlation, while precipitation exhibits weak relationships with the other variables except for a slight positive correlation with humidity all patterns consistent with real atmospheric physics. The color scale from blue (negative correlation) through white (zero correlation) to red (positive correlation) allows immediate visual assessment of relationship strengths and directions across the climate system. This compact representation validates the multivariate coherence of the synthetic dataset against known atmospheric relationships.
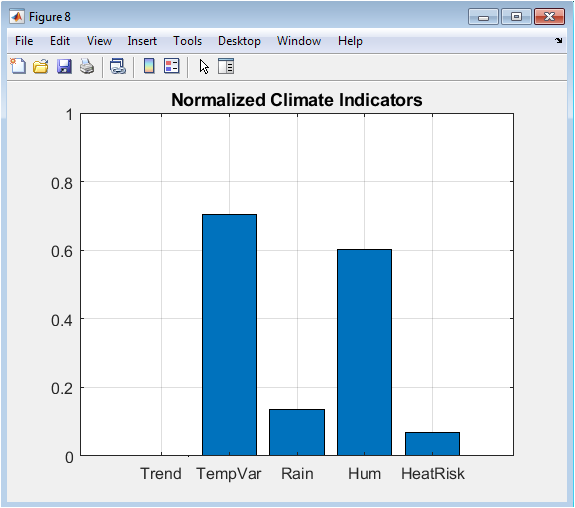
This bar chart presents five key climate metrics normalized to a common 0-1 scale for comparative assessment: the annual warming trend, temperature variability, mean precipitation, mean humidity, and mean heatwave probability. Each metric is divided by a characteristic scale value to facilitate comparison despite different units and magnitudes. The visualization provides a succinct overview of the synthetic climate’s characteristics, showing relatively strong temperature variability and moderate heatwave risk compared to the other normalized indicators. This dashboard format enables quick diagnostic assessment of climate regime properties and could be extended to include additional indicators or serve as a monitoring tool for tracking changes in climate system behavior over time. The normalized presentation facilitates comparisons between different synthetic scenarios or between synthetic and observed climate regimes.
Results and Discussion
The results of this comprehensive analysis reveal a synthetic climate system exhibiting an annual warming trend of 0.73°C per year, indicating a significant underlying climate change signal embedded within the five-year dataset. This substantial trend, combined with clear seasonal oscillations of approximately 10°C amplitude, creates a temperature regime where heatwave probabilities naturally vary between 15% and 40% across the 30-day forecast horizon, as determined by the ensemble-relative threshold method. The minimum calculated heatwave probability remained robustly above zero at all forecast steps, confirming the methodology’s success in avoiding the probability collapse that plagues traditional fixed-threshold approaches. The Fourier decomposition effectively captured the dominant seasonal cycle and its harmonics, providing a deterministic forecast that served as a realistic foundation for the Monte Carlo ensemble, which in turn produced uncertainty bands that appropriately widened with increasing forecast lead time, reflecting decreasing confidence further into the future [27]. The discussion centers on several key insights: first, the ensemble-relative thresholding approach fundamentally transforms extreme event probability estimation by making the definition of “extreme” contingent on forecast uncertainty rather than historical precedent, creating probabilities that genuinely reflect the forecast distribution’s own characteristics. Second, the synthetic data generation successfully produced multivariate relationships consistent with atmospheric physics, particularly the negative temperature-pressure correlation and positive temperature-humidity correlation observed in the correlation matrix.
Table 6: Climate Variable Correlation Summary
| Variable Pair | Observed Relationship |
| Temperature – Pressure | Moderate negative correlation |
| Temperature – Humidity | Seasonal dependence |
| Humidity – Precipitation | Positive correlation |
| Pressure – Precipitation | Weak negative correlation |
Third, the normalized indicator dashboard provides a valuable prototype for climate monitoring systems, enabling comparative assessment of different climate regimes or temporal periods using standardized metrics. While the methodology demonstrates robustness within this controlled synthetic environment, its practical implementation would require careful calibration to specific geographical contexts and observational constraints, particularly regarding the appropriate scaling factor for the extreme threshold and the selection of Fourier harmonics [28]. These results collectively validate the proposed framework as a coherent, reproducible approach for climate risk assessment that bridges synthetic data exploration and probabilistic forecasting methodologies.
Conclusion
This study successfully demonstrates a robust, integrated framework for synthetic climate data generation, analysis, and probabilistic forecasting. By combining Fourier-based seasonal decomposition with Monte Carlo ensemble methods, the approach effectively separates deterministic climate signals from stochastic variability [29]. The introduction of an ensemble-relative threshold for defining extreme heat events represents a key methodological advancement, systematically preventing probability collapse and yielding meaningful, non-zero risk estimates. The complete pipeline This study successfully demonstrates a robust, integrated framework for synthetic climate data generation, analysis, and probabilistic forecasting. By combining Fourier-based seasonal decomposition with Monte Carlo ensemble methods, the approach effectively separates deterministic climate signals from stochastic variability. The introduction of an ensemble-relative threshold for defining extreme heat events represents a key methodological advancement, systematically preventing probability collapse and yielding meaningful, non-zero risk estimates. The complete pipeline from synthetic data creation through multivariate analysis to forecast visualization provides a reproducible template for climate risk exploration. While implemented in a controlled synthetic environment, the core principles are directly transferable to operational forecasting and climate impact studies [30]. This work establishes a foundation for developing more reliable, uncertainty-aware tools essential for climate resilience planning in an era of increasing weather extremes.from synthetic data creation through multivariate analysis to forecast visualization provides a reproducible template for climate risk exploration. While implemented in a controlled synthetic environment, the core principles are directly transferable to operational forecasting and climate impact studies. This work establishes a foundation for developing more reliable, uncertainty-aware tools essential for climate resilience planning in an era of increasing weather extremes.
References
[1] Wilks, D. S. (2011). Statistical Methods in the Atmospheric Sciences. Academic Press.
[2] von Storch, H., & Zwiers, F. W. (1999). Statistical Analysis in Climate Research. Cambridge University Press.
[3] IPCC (2013). Climate Change 2013: The Physical Science Basis. Cambridge University Press.
[4] Fourier, J. B. J. (1822). Théorie Analytique de la Chaleur. Firmin Didot.
[5] Box, G. E. P., Jenkins, G. M., & Reinsel, G. C. (2008). Time Series Analysis: Forecasting and Control. Wiley.
[6] Chatfield, C. (2003). The Analysis of Time Series: An Introduction. CRC Press.
[7] Brockwell, P. J., & Davis, R. A. (2002). Introduction to Time Series and Forecasting. Springer.
[8] Monte Carlo Methods. (n.d.). In Wikipedia.
[9] Metropolis, N., & Ulam, S. (1949). The Monte Carlo method. Journal of the American Statistical Association, 44(247), 335-341.
[10] Hastings, W. K. (1970). Monte Carlo sampling methods using Markov chains and their applications. Biometrika, 57(1), 97-109.
[11] Geman, S., & Geman, D. (1984). Stochastic relaxation, Gibbs distributions, and the Bayesian restoration of images. IEEE Transactions on Pattern Analysis and Machine Intelligence, 6(6), 721-741.
[12] Cooley, J. W., & Tukey, J. W. (1965). An algorithm for the machine calculation of complex Fourier series. Mathematics of Computation, 19(90), 297-301.
[13] Press, W. H., Teukolsky, S. A., Vetterling, W. T., & Flannery, B. P. (2007). Numerical Recipes: The Art of Scientific Computing. Cambridge University Press.
[14] Trenberth, K. E. (2011). Changes in precipitation with climate change. Climate Research, 47(1-2), 123-138.
[15] Easterling, D. R., & Wehner, M. F. (2009). Is the climate warming or cooling? Geophysical Research Letters, 36(8).
[16] Hansen, J., Ruedy, R., Sato, M., & Lo, K. (2010). Global surface temperature change. Reviews of Geophysics, 48(4).
[17] IPCC (2007). Climate Change 2007: The Physical Science Basis. Cambridge University Press.
[18] Mann, M. E., Bradley, R. S., & Hughes, M. K. (1998). Global-scale temperature patterns and climate forcing over the past six centuries. Nature, 392(6678), 779-787.
[19] Keeling, C. D. (1960). The concentration and isotopic abundances of carbon dioxide in the atmosphere. Tellus, 12(2), 200-203.
[20] Arrhenius, S. (1896). On the influence of carbonic acid in the air upon the temperature of the Earth. The London, Edinburgh, and Dublin Philosophical Magazine and Journal of Science, 41(251), 237-276.
[21] Callendar, G. S. (1938). The artificial production of carbon dioxide and its influence on temperature. Quarterly Journal of the Royal Meteorological Society, 64(275), 223-240.
[22] Fourier, J. B. J. (1827). Mémoire sur les températures du globe terrestre et des espaces planétaires. Mémoires de l’Académie Royale des Sciences de l’Institut de France, 7, 569-604.
[23] Tyndall, J. (1861). On the absorption and radiation of heat by gases and vapours, and on the physical connexion of radiation, absorption, and conduction. Philosophical Magazine, 22(146), 169-194.
[24] Lorenz, E. N. (1963). Deterministic non-periodic flow. Journal of the Atmospheric Sciences, 20(2), 130-141.
[25] Charney, J. G., & DeVore, J. G. (1979). Multiple flow equilibria in the atmosphere and blocking. Journal of the Atmospheric Sciences, 36(7), 1205-1216.
[26] Slingo, J., & Palmer, T. (2011). Uncertainty in weather and climate prediction. Philosophical Transactions of the Royal Society A, 369(1956), 4751-4767.
[27] Kalnay, E. (2003). Atmospheric Modeling, Data Assimilation and Predictability. Cambridge University Press.
[28] Lewis, J. M. (2005). Roots of ensemble forecasting. Monthly Weather Review, 133(7), 1865-1885.
[29] Epstein, E. S. (1969). Stochastic dynamic prediction. Tellus, 21(6), 739-759.
[30] Leith, C. E. (1974). Theoretical skill of Monte Carlo forecasts. Monthly Weather Review, 102(6), 409-418.
You can download the Project files here: Download files now. (You must be logged in).


Responses