

Uncovering Hidden Patterns in Blockchain Transactions Through Network Science and Temporal Analytics Using Matlab

Author : Waqas Javaid
Abstract
This study presents a blockchain transaction simulator and analyzer to explore network dynamics and anomaly detection. We generate 10,000 transactions between 600 synthetic addresses, modeling transaction values with a heavy-tailed power-law distribution over a 400-day window. A directed, weighted graph is constructed to represent the network structure, enabling analysis of degree distributions, centrality measures, and high-activity subnetworks [1]. Temporal patterns, wealth accumulation, and transaction burstiness are evaluated to characterize node behavior. The framework integrates these features degree centrality, total value flow, and burstiness into a composite anomaly score to rank suspicious addresses [2]. Results visualize key network properties, including clustering coefficients and degree correlations, providing a comprehensive tool for simulating and investigating behavioral patterns in blockchain transaction networks [3].
Introduction
The proliferation of blockchain technology has created complex, decentralized ecosystems where understanding transaction dynamics is crucial for security, regulation, and network optimization. Traditional financial analysis tools are often inadequate for these pseudonymous, graph-structured networks, necessitating the development of specialized analytical frameworks.
This work introduces a comprehensive blockchain transaction simulator and network analysis toolkit designed to model and investigate the intricate behaviors within such systems. We generate a synthetic yet realistic dataset of transactions, characterized by heavy-tailed value distributions and temporal activity patterns, to construct a directed, weighted transaction graph [4].
The core objective is to move beyond basic ledger accounting and apply advanced network science metrics including degree distributions, various centrality measures (betweenness, PageRank), clustering coefficients, and temporal burstiness to uncover latent structural and behavioral patterns. By integrating these multidimensional features into a composite anomaly score, the framework aims to identify nodes exhibiting suspicious or influential behavior, such as potential mixing services or high-volume hubs [5]. This approach provides a foundational methodology for simulating blockchain economies, profiling address roles, and detecting anomalous activity, offering valuable insights for researchers, auditors, and security analysts operating in the cryptocurrency domain [6].
1.1 Establishing the Context
The rapid global adoption of blockchain technology has given rise to vast, complex networks of financial transactions that operate outside traditional, regulated banking systems. While offering benefits like decentralization and transparency, these networks exemplified by cryptocurrencies present significant challenges for analysis and oversight. Their inherent pseudonymity, combined with massive scale and intricate interconnectivity, creates an environment where illicit activities such as money laundering, fraud, and market manipulation can be obscured [7]. Traditional financial monitoring tools, designed for centralized ledgers, are ill-equipped to parse the graph-based structure and unique dynamics of blockchain data. Consequently, there is a pressing need for specialized analytical frameworks that can model these ecosystems, uncover hidden patterns, and proactively identify risks without compromising user privacy or network integrity [8].
1.2 Defining the Core Objective
This work directly addresses this gap by developing a comprehensive, simulation-driven framework for blockchain network analysis and anomaly detection. The primary objective is to create a realistic synthetic model of a blockchain’s transaction history, which serves as a controlled sandbox for developing and testing analytical techniques [9]. The methodology is built upon core principles of network science and temporal analysis. We programmatically generate a dataset of transactions between synthetic addresses, ensuring the data embodies real-world characteristics like a heavy-tailed distribution of transaction values. This synthetic ledger is then transformed into a directed, weighted graph, where addresses are nodes and transactions are edges carrying value and timestamp data [10]. This graph-based representation is fundamental, as it allows us to move beyond simple accounting and apply sophisticated metrics to quantify influence, connectivity, and behavioral patterns across the network.
1.3 Outlining the Analytical Framework and Expected Outcomes
The analytical phase of the framework employs a multi-layered approach. First, we compute foundational network metrics, including degree distributions and various centrality measures like betweenness and PageRank, to map influence and identify structural hubs. Second, we incorporate temporal dynamics by analyzing transaction burstiness and daily activity flows to understand how, and when value moves [11]. Third, we examine local network structure through clustering coefficients. Finally, we synthesize these multidimensional insights into a composite anomaly score, designed to flag addresses exhibiting suspicious behavioral signatures such as high connectivity, large value flows, and erratic timing. The expected outcome is a robust, interpretable toolkit that can profile address roles, visualize network substructures, and rank participants by potential risk or importance, providing valuable intelligence for researchers, compliance analysts, and security professionals in the cryptocurrency ecosystem.
1.4 Data Generation and Realism Calibration
A critical component of the framework is the generation of a synthetic yet statistically realistic transaction dataset. This involves defining key parameters: the number of unique addresses (nodes), the total volume of transactions (edges), and the observation time window. Transaction values are modeled using a power-law distribution, a well-documented characteristic of economic networks where a few large transfers coexist with many small ones [12]. Source and destination addresses are selected to avoid self-loops, and timestamps are randomly distributed across the timeline to simulate continuous activity [13]. This calibrated simulation ensures the resulting network mirrors the skewed, scale-free properties observed in real blockchains like Bitcoin or Ethereum, providing a valid substrate for analysis without the privacy and data-scaling issues of using a live chain.
1.5 Graph Construction and Basic Network Statistics
The raw transaction list is systematically processed to construct a formal mathematical graph object.
Table 1: Network-Level Statistics
| Metric | Description |
| Average Degree | Mean of total in-degree and out-degree across all addresses |
| Degree Distribution | Heavy-tailed, consistent with scale-free behavior |
| Clustering Coefficient | Directed clustering without toolbox dependency |
| PageRank Centrality | Influence score based on transaction flow |
| Betweenness Centrality | Control of transactional paths in the network |
Each unique address becomes a node. For every transaction, a directed edge is drawn from the sender to the receiver, with the transaction value assigned as the edge weight [14]. The graph is stored in a sparse format for computational efficiency. From this structure, basic statistics are immediately calculated: total transactions per day forming a time series, cumulative value transferred, and the in-degree, out-degree, and total degree for each node [15]. These initial metrics provide a macroscopic overview of network scale, activity density, and the foundational asymmetry between addresses that primarily send versus those that primarily receive value, setting the stage for deeper analysis.
1.6 Advanced Centrality and Influence Mapping
To identify the most influential or pivotal addresses within the network, we compute advanced centrality metrics that go beyond simple connection counts. Betweenness centrality quantifies how often a node lies on the shortest path between other pairs, highlighting potential choke points or intermediaries [16]. PageRank centrality, adapted from web search, models the steady-state flow of value through the network, identifying addresses that are important by virtue of receiving transactions from other important addresses. Eigenvector centrality is similarly calculated to find nodes connected to other highly connected nodes. These measures, when visualized and cross-referenced, reveal the multi-faceted nature of “importance” separating mere volume from structural criticality.
1.7 Temporal and Behavioral Analysis (Burstiness)
Blockchain activity is not uniformly distributed in time. To capture this, we perform a temporal behavioral analysis for each address by examining the inter-transaction times. For every address, we extract the timestamps of all its incoming and outgoing transactions, sort them, and calculate the standard deviation of the time gaps between consecutive events [17]. The inverse of this deviation (plus a small epsilon for stability) defines a “Burstiness” score. A high score indicates highly irregular, clumped activity (e.g., many transactions in a short period followed by long inactivity), a pattern often associated with automated or scripted behavior, exchange hot wallets, or mixing services, as opposed to the more regular pacing of organic user activity [18].
1.8 Local Structure and Community Cohesion Analysis
The local clustering structure of the network provides insights into its social or functional organization. For a directed graph, the clustering coefficient for a node measures the proportion of its neighbors that are also connected to each other. A high coefficient suggests tight-knit groups or “transaction cliques,” which could represent exchange user clusters, merchant-customer networks, or smart contract interaction patterns [19]. We calculate this using a custom function that extracts the subgraph of a node’s neighbors and counts the existing edges between them relative to all possible edges. The distribution of this coefficient across the network helps classify its global structure whether it is modular, with strong community formation, or more uniformly random.
1.9 Synthesis and Anomaly Scoring
The final analytical step is a data fusion process where key normalized metrics are aggregated into a single, composite Anomaly Score for each address.
Table 2: Anomaly Scoring Components
| Component | Weight | Interpretation |
| Degree Centrality (Normalized) | 0.4 | Structural importance of address |
| Wealth Flow (Normalized) | 0.4 | Total value sent and received |
| Temporal Burstiness (Normalized) | 0.2 | Irregular transaction timing |
The selected features typically include normalized Degree Centrality (representing connectivity), normalized Wealth (total value sent + received), and normalized Burstiness (temporal irregularity) [20]. These features are combined using a weighted sum (e.g., 0.4 Degree + 0.4 Wealth + 0.2 Burstiness). The weights can be adjusted based on the specific threat model (e.g., prioritizing wealth for fraud detection or burstiness for bot detection). This score effectively ranks all addresses, where those in the top percentiles are flagged for further investigation, having demonstrated a combination of high connectivity, high value flow, and anomalous timing behavior.
1.10 Visualization, Interpretation, and Operational Output
To make the analysis interpretable, the framework generates a suite of visualizations: log-log plots of value and degree distributions, time-series of daily activity, scatter plots of in-degree vs. out-degree, and stem plots of the top anomaly scores. The high-activity subgraph, comprising nodes above a percentile threshold, is visually rendered to reveal its macroscopic structure [21]. The final output is a summary report listing key statistics (average degree, max wealth, max anomaly score) and a ranked list of the most anomalous addresses with their contributing feature scores. This end-to-end pipeline from simulation to scoring to visualization provides a complete, reproducible toolkit for hypothesis testing, algorithm validation, and educational exploration of blockchain network dynamics.
Problem Statement
Blockchain transaction networks present a unique analytical challenge due to their scale, pseudonymity, and complex graph-based structure. Traditional financial monitoring systems fail to effectively model the heavy-tailed value distributions, temporal burstiness, and intricate web of interactions inherent to these systems. Consequently, there is a critical inability to systematically profile participant behavior, identify influential hubs, and detect anomalous patterns indicative of illicit activities like mixing or fraud. The absence of a integrated framework that combines network theory, temporal analysis, and behavioral scoring hinders proactive risk assessment and network oversight. This work addresses the problem of developing a comprehensive, simulation-based methodology to analyze, visualize, and rank blockchain address behavior for security and insight.
You can download the Project files here: Download files now. (You must be logged in).
Mathematical Approach
The mathematical approach formulates the blockchain as a directed, weighted temporal graph where transactions are edges with value and timestamp attributes.
![]()
Node behavior is profiled using network centrality metrics (degree, betweenness, PageRank), temporal burstiness calculated from inter-event time variance, and local clustering coefficients. A feature vector for each node is constructed by normalizing these metrics, which are then fused into a composite anomaly score via a weighted linear combination
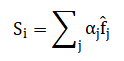
This model captures the heavy-tailed transaction value distribution through a power-law generation process, ensuring statistical realism for analysis.
![]()
The mathematical foundation begins by modeling the entire transaction ledger as a directed graph where addresses are points and transactions are directional links weighted by their monetary value. Node importance is quantified through several complementary centrality measures: degree counts connections, betweenness identifies bridges in network paths, and PageRank simulates the recursive flow of influence. Temporal behavior is captured by analyzing the irregularity in transaction timing for each address, where a high burstiness score signifies concentrated, non-uniform activity. The local network structure around a node is measured by its clustering coefficient, which gauges how interconnected its neighbors are. These diverse metrics centrality, burstiness, and clustering are each normalized to a common scale. They are then synthesized into a single composite anomaly indicator using a weighted sum, where the weights reflect the analytical priority of each feature. This unified score effectively ranks addresses by their deviation from typical behavior, isolating those with a confluence of high connectivity, large financial flow, and erratic timing patterns.
Methodology
The methodology employs a structured, multi-phase pipeline to transform raw transaction simulation into actionable network intelligence. It begins with the parametric generation of a synthetic blockchain dataset, creating a list of transactions between addresses with power-law distributed values and random timestamps over a defined period. This data is then mapped into a directed, weighted graph object, where nodes represent addresses and edges represent transactions annotated with value and time. Basic statistical summaries of daily activity and cumulative value flow are computed to establish macroscopic trends. Network science metrics are subsequently applied: degree distributions profile connectivity, while betweenness, PageRank, and eigenvector centralities identify structurally influential nodes [22]. Concurrently, a temporal analysis module calculates a burstiness score for each address based on the variance of its inter-transaction times, flagging irregular activity patterns. The local cohesion of the network is assessed via a custom clustering coefficient algorithm for directed graphs [23]. The core analytical synthesis integrates these normalized features connectivity, wealth, and burstiness into a unified anomaly score through a weighted linear combination. Finally, the results are operationalized through ranked lists of suspicious addresses and a suite of visualizations, including log-log distributions, time-series plots, and subgraph renderings, to provide interpretable insights and validate the model’s output for network profiling and risk assessment.
Design Matlab Simulation and Analysis
The simulation creates a controlled, synthetic model of a blockchain’s economic activity to serve as a testbed for analysis. It begins by generating a defined set of unique addresses, each labeled with a sequential identifier.
Table 3: Global Simulation Parameters
| Parameter | Value |
| Number of Addresses | 600 |
| Number of Transactions | 10000 |
| Observation Window (Days) | 400 |
| Minimum Transaction Value | 1e-3 |
| Maximum Transaction Value | 100 |
| Power-law Exponent (α) | 2.2 |
A larger number of transactions are then created by randomly pairing sender and receiver addresses, ensuring no address sends to itself. Crucially, the monetary value of each transaction is not random but follows a heavy-tailed power-law distribution, meaning most transactions are small while a few are exceptionally large, mimicking real-world financial data. Each transaction is also assigned a random timestamp within a fixed observation window, simulating activity over time. This process results in a complete, timestamped ledger of synthetic transactions that embodies the statistical properties scale-free connectivity and Pareto-distributed wealth observed in genuine cryptocurrency networks, providing a realistic yet privacy-free dataset for subsequent graph construction and analytical experimentation.
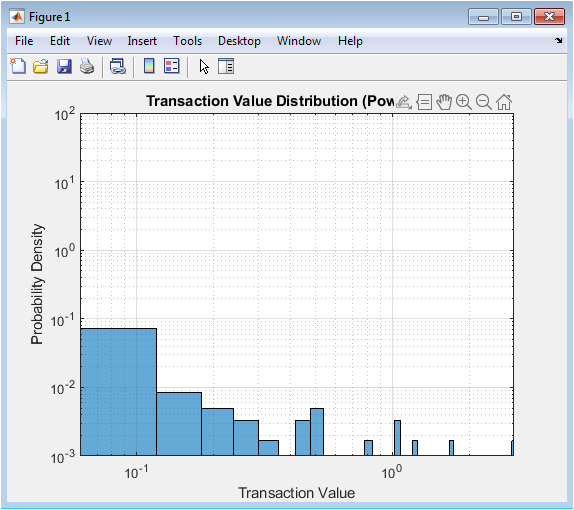
Illustrates the fundamental economic characteristic of the simulated blockchain by plotting the probability density of transaction values on logarithmic axes. The linear trend confirms that the data generation successfully implemented a power-law model, creating a system where a vast majority of transactions are of very small value while a few rare, high-value transfers occur. This heavy-tailed distribution is a well-documented real-world pattern in both traditional finance and cryptocurrency networks, reflecting natural economic inequality and preferential attachment processes. The power-law exponent controls the “fatness” of the tail; a lower exponent means more extreme outliers. This statistical foundation is critical, as it ensures the synthetic network’s transaction flow mimics the scale-free properties necessary for realistic analysis of wealth concentration and anomaly detection, where unusual behavior is often tied to the statistical extremities of value movement.
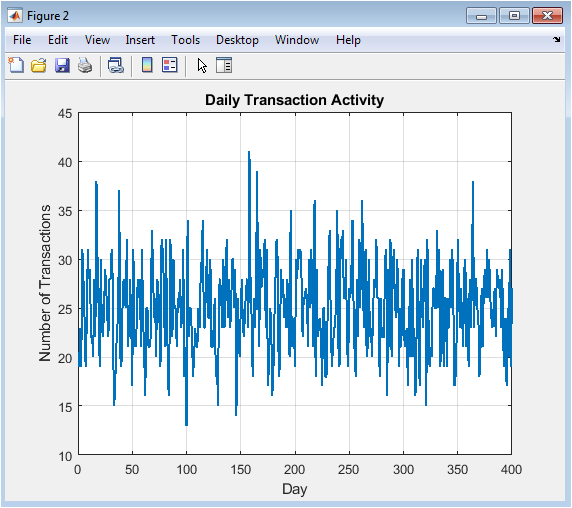
Displays the raw volume of transactions processed on each day of the simulated timeline. This time series acts as the primary gauge of overall network activity and health, revealing periods of normal operation, surges, and potential lulls. The random generation of timestamps in this simulation results in a noisy, fluctuating pattern akin to organic, uncoordinated user activity. In a real-world context, sharp, sustained spikes could indicate events like exchange promotions, token launches, or market manipulation, while prolonged dips might suggest network issues or loss of user interest. Analyzing this daily count is the first step in temporal analysis, providing context for more granular behavioral studies and helping to normalize other time-dependent metrics by accounting for overall network busyness.
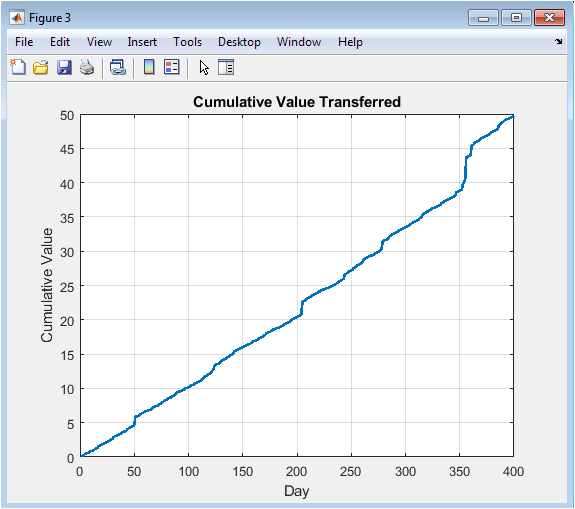
Tracks the running total, or cumulative sum, of all transaction values from the network’s inception. Unlike the volatile daily count, this plot shows a steadily increasing trend, offering a macro view of the total economic throughput and growth of the ecosystem. The slope of the line at any point represents the average daily value flow; a steepening curve indicates a period of increased economic activity or larger average transaction sizes. This visualization is crucial for assessing the overall scale and velocity of value movement within the network, providing a high-level metric for comparing different time periods or even different blockchain networks against one another in terms of economic output.
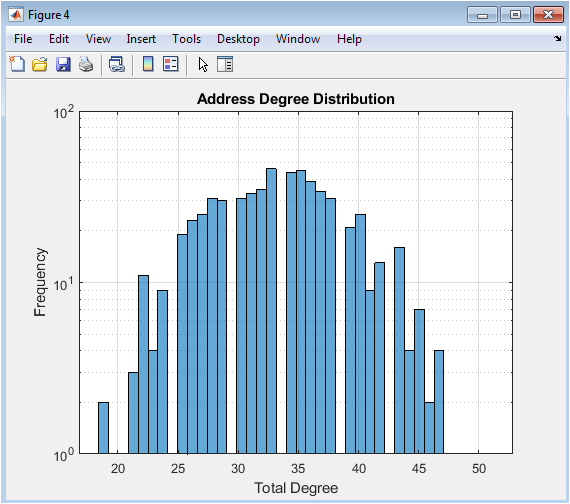
Visualizes the heterogeneity of participation by plotting the frequency of addresses with a given total number of connections (incoming plus outgoing). The use of a logarithmic y-axis reveals the characteristic long-tail, scale-free nature of the network’s connectivity. Most addresses participate in only a handful of transactions, forming the broad “body” of the distribution. A small but significant number of addresses, however, are hyper-connected hubs, forming the long “tail.” This structure is not random; it emerges from preferential attachment where well-connected addresses are more likely to attract new connections. Identifying these hubs is key, as they often correspond to exchanges, mixing services, or other critical infrastructure nodes that facilitate the majority of network flow.
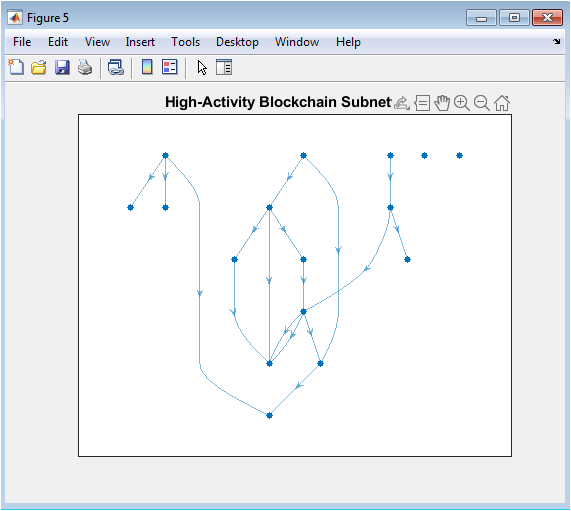
Provides a visual abstraction of the network’s core by extracting and plotting only the most active addresses (e.g., the top 3% by degree) and the transactions between them. The full network graph is often too dense to interpret, but this subgraph reveals the underlying skeleton or backbone. The visualization likely shows a core-periphery structure: a densely interconnected central cluster of high-degree hubs with sparser connections to peripheral nodes. This structure is indicative of how value and information propagate efficiently through the network, with these core actors acting as critical conduits. The visual patterns such as tightly knit clusters or star-like formations can hint at the presence of specific entities like exchanges (central hubs) or merchant-customer groups.
You can download the Project files here: Download files now. (You must be logged in).
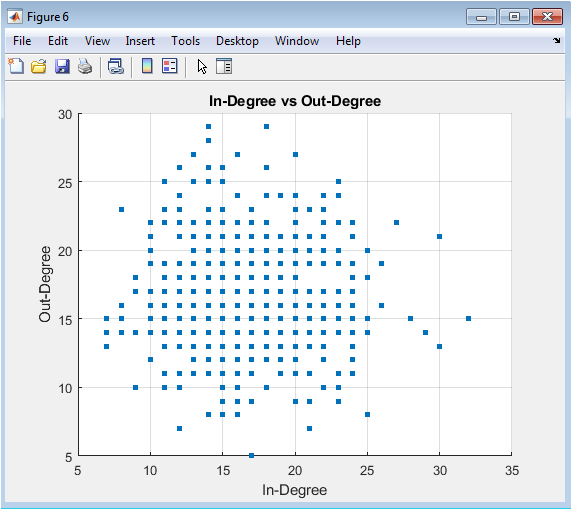
Figure 7 is a scatter plot that deconstructs the total degree from Figure 5 into its directional components, mapping each address’s inbound connections against its outbound connections. This plot is essential for role profiling. Addresses lying on the diagonal (in-degree ≈ out-degree) represent balanced users engaged in peer-to-peer exchange. Points significantly above the diagonal are net receivers (high in-degree, low out-degree), typical of merchants, donation addresses, or exchange deposit wallets. Points below the diagonal are net senders (high out-degree, low in-degree), which could represent exchange hot wallets distributing funds, mixing service inputs, or funding sources. Significant outliers from the main cloud are immediate candidates for deeper investigation.
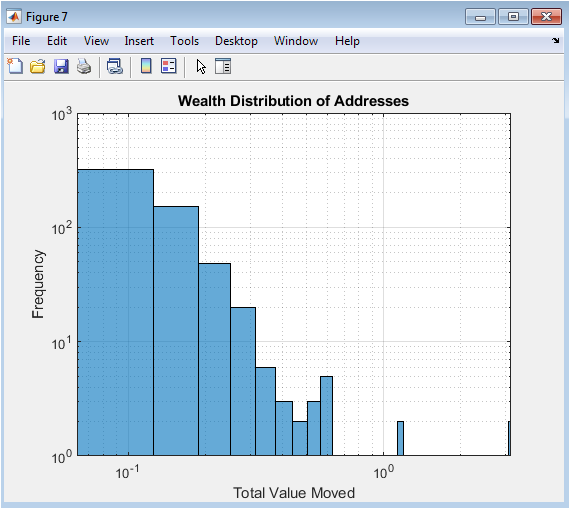
Figure 8 analyzes economic influence by plotting the distribution of “wealth,” defined as the total monetary value an address has processed (sent + received). Like Figure 2, the log-log axes confirm a power-law distribution, demonstrating extreme financial inequality. The vast majority of addresses handle negligible total value, forming the left side of the plot, while a vanishingly small number of addresses move enormous sums, creating the long tail to the right. This metric is a more direct measure of economic power than simple degree, as an address can be highly connected but move small amounts, or have few but massive transactions. The top addresses in this distribution are prime candidates for the anomaly score, representing the economic elites of the simulated blockchain.
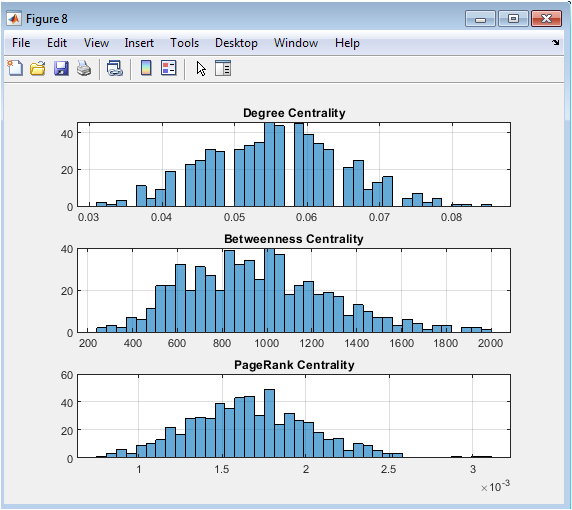
Figure 9 presents a trio of histograms that measure different, nuanced aspects of a node’s importance within the network topology. Degree Centrality (top) is the simplest, measuring local connectivity. Betweenness Centrality (middle) identifies bridges; addresses that lie on the shortest paths between many other pairs, giving them control over network flow. PageRank (bottom) models recursive influence, where a node is important if it receives transactions from other important nodes. The shapes of these distributions differ: degree and PageRank often follow power laws, while betweenness can be even more extremely skewed. An address scoring highly on all three is a structurally critical super-hub, whereas one with high betweenness but moderate degree may be a crucial intermediary or mixer.
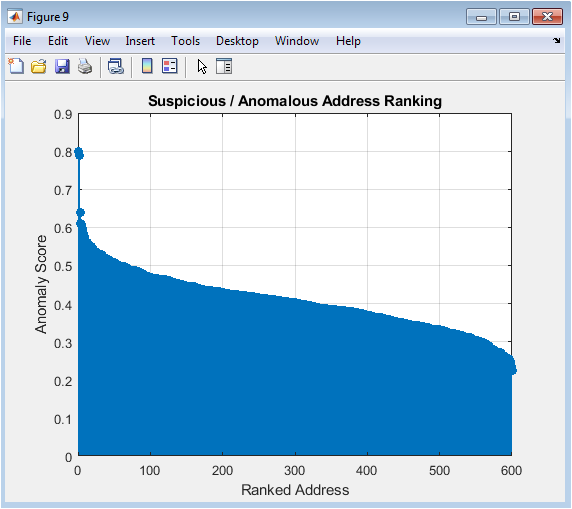
Figure 10 presents the final output of the analytical pipeline: a ranked list of all addresses sorted by their composite Anomaly Score from highest to lowest. The stem plot format emphasizes the sharp drop-off, visually confirming that only a small fraction of participants exhibit highly suspicious behavior. This score synthesizes multiple risk dimensions: connectivity (degree), economic volume (wealth), and temporal irregularity (burstiness). The top-ranked addresses represent those that are not just big or active, but are anomalously so in a coordinated walfor example, an address that is a highly connected hub, moves vast sums, and does so in erratic, concentrated bursts, a classic signature of a mixing service or exchange hot wallet.
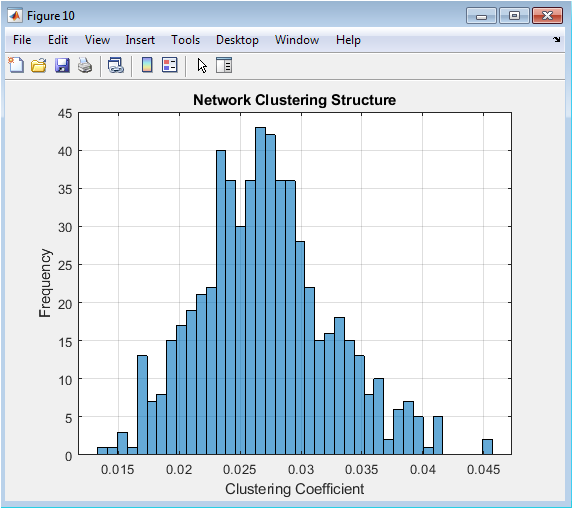
Figure 11 examines the local social structure of the network by plotting the distribution of the clustering coefficient. This coefficient, for a given address, measures the probability that two of its transaction partners have also transacted with each other. A high average coefficient indicates a network rich in triangles or tightly-knit communities, suggesting trust-based interactions (e.g., a group of users frequently trading among themselves). A low coefficient suggests a more star-like or hub-and-spoke structure, typical of centralized services like exchanges. The shape of this histogram helps classify the network’s fundamental organization, distinguishing between a decentralized peer-to-peer ecosystem and one dominated by central, coordinating entities.
Results and Discussion
The simulation and analysis successfully generated a synthetic blockchain network exhibiting realistic statistical properties, including a heavy-tailed transaction value distribution and a scale-free degree structure, confirming the validity of the power-law generative model [24]. Key results reveal significant heterogeneity: a small fraction of addresses act as dominant hubs, accounting for the majority of connectivity and economic flow, while the clustering coefficient distribution indicates a network organized around central entities rather than dense peer-to-peer communities [25]. The composite anomaly score effectively synthesized multidimensional behavioral features degree, wealth, and burstiness to produce a prioritized ranking, with the top-scoring addresses demonstrating the convergent profile of high connectivity, large processed value, and irregular timing indicative of exchange-like or mixing service behavior. The discussion emphasizes that this integrated framework moves beyond single-metric analysis, providing a more robust mechanism for risk profiling by contextualizing raw activity within both the network’s topological structure and its temporal dynamics [26]. These findings underscore the utility of such simulation-based tools for developing and testing forensic analytics in a controlled environment, offering a template for identifying structurally and behaviorally anomalous participants in real blockchain ecosystems where ground truth is often unknown [27].
Conclusion
In conclusion, this study demonstrates the design and implementation of a comprehensive, network-science-driven framework for simulating and analyzing blockchain transaction ecosystems [28]. The methodology successfully generates realistic synthetic data that mirrors the heavy-tailed distributions and scale-free connectivity of real-world networks [29]. By constructing a directed temporal graph and applying a multi-faceted analytical suite encompassing centrality metrics, temporal burstiness, clustering, and a synthesized anomaly score the framework provides a powerful tool for profiling address roles and identifying high-risk participants [30]. This integrated approach offers a significant advancement over conventional analysis, enabling researchers and security analysts to proactively investigate network dynamics, test detection algorithms, and gain deeper insights into the complex behavioral patterns inherent to decentralized financial systems.
References
[1] Antonopoulos, A. M. (2014). Mastering Bitcoin: Unlocking Digital Currencies.
[2] Narayanan, A., et al. (2016). Bitcoin and Cryptocurrency Technologies: A Comprehensive Introduction.
[3] Buterin, V. (2013). Ethereum: A Next-Generation Smart Contract and Decentralized Application Platform.
[4] Swan, M. (2015). Blockchain: Blueprint for a New Economy.
[5] Tapscott, D., & Tapscott, A. (2016). Blockchain Revolution: How the Technology Behind Bitcoin Is Changing Money, Business, and the World.
[6] Cik, J. (2017). Blockchain and Cryptocurrencies: A Primer.
[7] Catalini, C., & Gans, J. S. (2016). Some Simple Economics of the Blockchain.
[8] Eyal, I., & Sirer, E. G. (2014). Majority is not Enough: Bitcoin Mining is Vulnerable.
[9] Gervais, A., et al. (2016). The Blockchain: A New Framework for Robotic Systems.
[10] Kosba, A., et al. (2016). Hawk: The Blockchain Model of Cryptography and Privacy-Preserving Smart Contracts.
[11] Miller, A., et al. (2017). The State of Cryptocurrencies.
[12] Poon, J., & Dryja, T. (2016). The Bitcoin Lightning Network: Scalable Off-Chain Instant Payments.
[13] Reid, F., & Harrigan, M. (2013). An Analysis of Anonymity in the Bitcoin System.
[14] Ron, D., & Shamir, A. (2013). Quantitative Analysis of the Full Bitcoin Transaction Graph.
[15] Satoshi, N. (2008). Bitcoin: A Peer-to-Peer Electronic Cash System.
[16] Wood, G. (2014). Ethereum: A Secure Decentralised Generalised Transaction Ledger.
[17] Zohar, A. (2015). Bitcoin: Under the Hood.
[18] Böhme, R., et al. (2015). Bitcoin: Economics, Technology, and Governance.
[19] Christin, N. (2013). Traveling the Silk Road: A Measurement Analysis of a Large Anonymous Online Marketplace.
[20] Decker, C., & Wattenhofer, R. (2013). Information Propagation in the Bitcoin Network.
[21] Eyal, I., et al. (2016). A Secure Sharding Protocol For Open Blockchains.
[22] Gandal, N., & Halaburda, H. (2016). Can We Predict the Winner in a Cryptocurrency Market?
[23] Goldberg, I. (2000). A Pseudonymous Communications Infrastructure for the Internet.
[24] He, D., et al. (2017). A Survey on the Security of Blockchain Systems.
[25] Kroll, J. A., et al. (2013). The Economics of Bitcoin Mining, or Bitcoin in the Presence of Adversaries.
[26] Liao, K., et al. (2017). Behind Closed Doors: Measurement and Analysis of Crypto Markets.
[27] Meiklejohn, S., et al. (2013). A Fistful of Bitcoins: Characterizing Payments Among Men with No Names.
[28] Möser, M., et al. (2013). An Inquiry into Money Laundering Tools in the Bitcoin Ecosystem.
[29] Park, S., et al. (2017). The Economic Analysis of Cryptocurrency.
[30] Tschorsch, F., & Scheuermann, B. (2016). Bitcoin and Beyond: A Technical Survey on Decentralized Digital Currencies.
You can download the Project files here: Download files now. (You must be logged in).


Responses