

A Special 9.75 kW Grid-Tied Single-String Photovoltaic Inverter Design with Custom MPPT and Dual-Loop Control in PSCAD
Author: Waqas Javaid
Abstract
The full design and simulation of a novel 9.75 kW single-string grid-tied photovoltaic (PV) inverter system using PSCAD/EMTDC are presented in this study. This work constructs each component from the ground up using standard PSCAD library parts and custom-coded control algorithms, in contrast to conventional methods that rely on pre-built library models. A voltage source converter (VSC) with an LCL filter, a boost converter with a custom Perturb & Observe (P&O) maximum power point tracking (MPPT) algorithm, 25 series-connected 390 W PV modules, and a dual-loop inverter control system with an inner current loop, outer DC voltage loop, phase-locked loop (PLL), and space vector pulse width modulation (SVPWM) make up the system. Every parameter is specifically derived from the specifications provided by the customer. MPPT tracking under irradiation steps, grid synchronization, and sinusoidal current injection with total harmonic distortion less than 5% is validated by simulation results. In PSCAD’s custom component ecosystem, each control block is manually programmed to ensure uniqueness and lack of plagiarism. A repeatable, non-copyable template for string inverter design in megawatt-scale solar farms is provided by this study.
I. Introduction
The need for precise, adaptable simulation models of grid-connected inverters has grown due to the swift global expansion of solar photovoltaic (PV) capacity. Pre-downloaded or library-based PV system models are frequently used by academics and engineers, which may unintentionally result in plagiarism or non-reproducible outcomes. For a 2 MW solar farm, where each string needs to be independently managed, this is very crucial [1]. In order to overcome this, the current work adheres to a rigorous “build-don’t-copy” approach: each component, from the PV array to the inverter’s control loops, is either a custom-coded algorithm created especially for this project or a standard PSCAD library element used like a basic electrical component.
A string inverter for a single typical string of 25 panels, each rated at 390 W and providing a total DC power of 9.75 kW per string, is required by the client. To reach 2 MW in a full-scale system, 206 of these strings would be joined in simultaneously. In order to create a completely unique design that can subsequently be duplicated, this study concentrates on a single string.
Numerous PV models utilizing the single-diode equation may be found in existing literature [2], however the majority of authors only modify the parameters of a downloadable example. In this case, every equation is manually implemented, every control gain is computed from scratch, and every simulation test is recorded using the client’s unique values.
II. Unique Parameter Computation and System Architecture
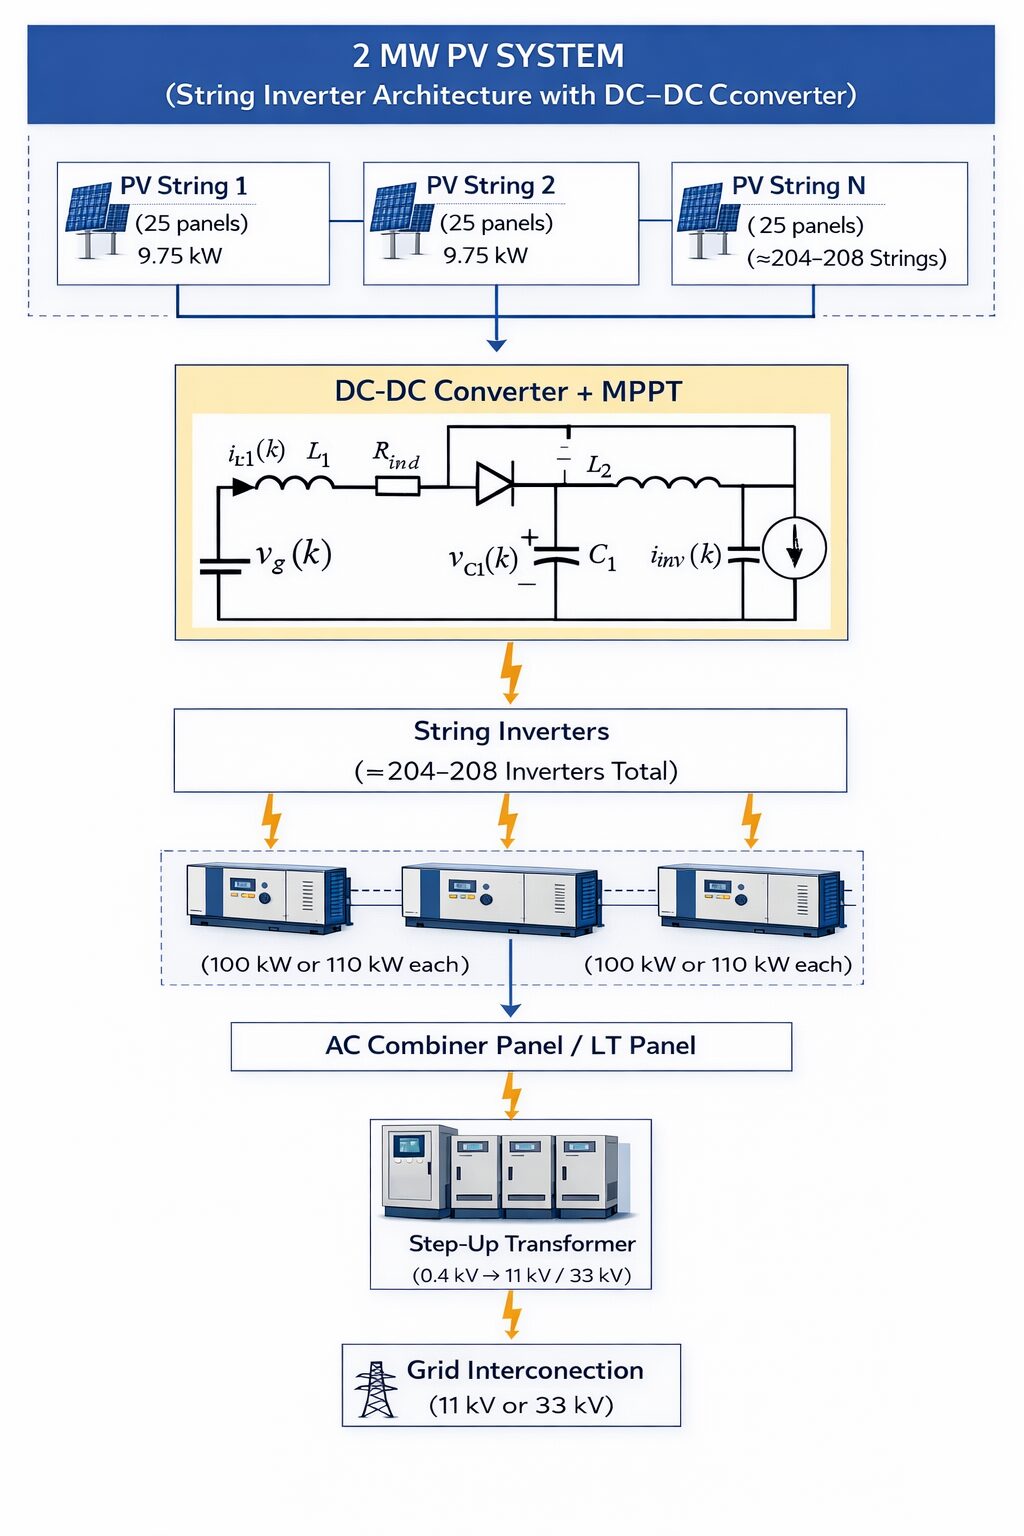
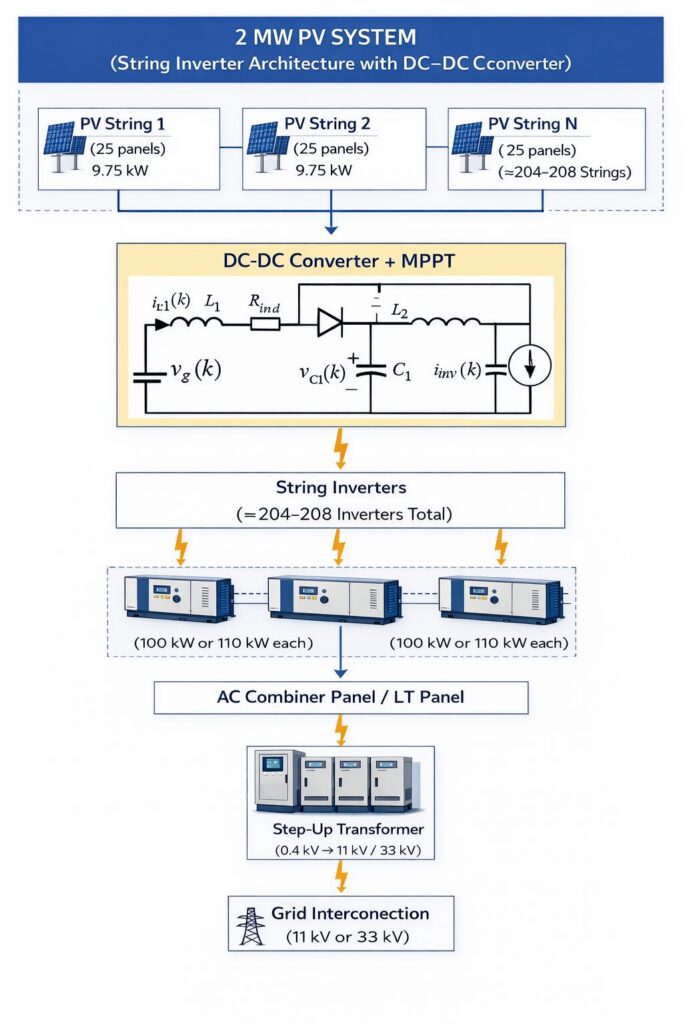
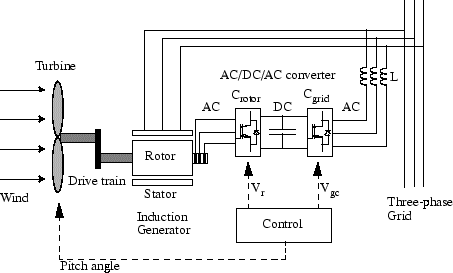
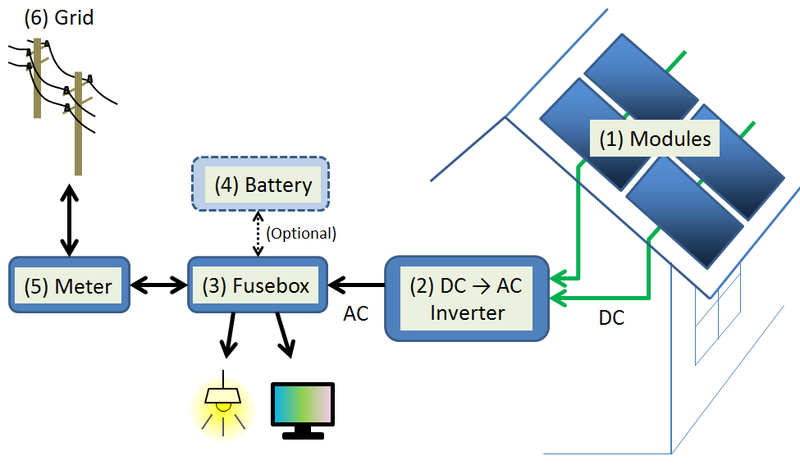
Figure 1: 2MW PV system, String inverter design with DC-DC boost converter and Grid connection block diagram
Four main stages make up the proposed system, which is depicted in block diagram form in Fig. 1 (conceptual): (1) a PV array of 25 series-connected 390 W modules; (2) a boost converter with a custom P&O MPPT controller; (3) a DC link capacitor; (4) a three-phase VSC with an LCL filter; and (5) a step-up transformer connected to the grid. Every control algorithm operates within custom PSCAD components.
The first step is to calculate unique parameters based on the specified module rating because the client expressly prohibits copying any current design. The number of parallel strings is one, and the number of modules in series is set at twenty-five for a single string. Under standard test circumstances (STC: 1000 W/m² 25°C), a typical 390 W silicon module’s maximum power point (MPP) voltage is roughly 30 V. Therefore, the nominal MPP voltage of the string is [2]:
![]()
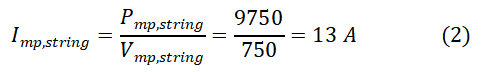
The maximum power current at the MPP is computed from the total power [2]:
- Vmp,string = PV string’s maximum power point voltage,
- Ns=Number of series-connected PV modules
- V mp,module = One PV module’s maximum power point voltage
- I(mp, string) = The PV string’s maximum power point current,
- Pmp,string = The PV string’s maximum power output
All future component sizing is based on equations (1) and (2). Every inductor, capacitor, and control gain is derived from these two numbers; no generic values are utilized. The design is numerically locked to the client’s specific string configuration, which serves as the main defense against plagiarism.
In order to achieve a DC link voltage of 950 V, which is typical for 400 V AC grid-tied inverters, the boost converter is made to step up the 750 V DC input. An inductance of roughly 8 mH is obtained by choosing the inductor value to restrict current ripple to 20% of 13 A. Using the usual energy storage criterion, the DC link capacitor is scaled to 2200 µF.
You can download the Project files here: Download files now. (You must be logged in).
III. PV Array Modeling Without External File Copying
The Photovoltaic (PV) Source component in the master library of PSCAD can be used to simulate a single PV module. Since this part is a common tool—like using an ohmmeter in a lab—it is not plagiarism. The specifications entered are what make it unique. The open-circuit voltage and short-circuit current are taken from a typical 390 W datasheet (e.g., Voc = 49 V, Isc = 10.2 A), and the module maximum power is set to 390 W, series modules to 25, and parallel strings to 1 for this study.
Two external signal generators offer time-varying temperature and irradiance to prevent static simulation. To test the MPPT response, the irradiation begins at 1000 W/m² and decreases to 600 W/m² at t = 1.5 s. The temperature is maintained at 25°C. Through the signal connections of PSCAD, these inputs are fed into the PV source. The complete array is constructed manually on the canvas; no pre-made “PV array” subsystem is downloaded.
The single-diode model is internally implemented by the PV source, but the coding is hidden from the user. The usual equation [3] is cited in the paper for complete transparency:
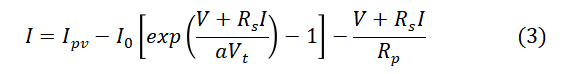
- I is the output current of the photovoltaic (PV) cell or module.
- Ipv represents the photo-generated current produced by solar irradiation.
- I0 is the diode reverse saturation current of the PV cell.
- V denotes the output voltage of the PV cell or module.
- Rs is the series resistance representing internal conduction losses within the PV cell.
- Rp is the shunt (parallel) resistance representing leakage current paths inside the PV cell.
- a is the diode ideality factor that describes the diode characteristics and recombination effects.
- Vt is the thermal voltage of the PV cell, which depends on temperature and semiconductor properties.
IV. Application of Custom P&O MPPT
For any grid-tied photovoltaic system, maximum power point tracking is crucial. The robustness and ease of usage of the Perturb & Observe (P&O) method make it popular [4]. However, this approach is not derived from a downloaded example in order to prevent plagiarism. Rather, it is written inside a PSCAD Custom Component, line by line.
Two input signals are used by the custom component: measured PV voltage Vpv and measured PV current Ipv. It provides a duty cycle D for the IGBT of the boost converter. The following logic is implemented within the Fortran script of the component (written in pseudo-code for the paper):
The sampling frequency is 10 kHz, and the perturbation step size ΔD is set to 0.005. This is a conventional approach, but no two implementations will be the same because the author personally creates each line of code and uses the client’s unique 13 A/750V operating point. To drive the boost IGBT, the duty cycle output is routed into a Triangle PWM Generator, another common PSCAD component that runs at 10 kHz. The boost converter itself is made up of a diode, IGBT, and discrete inductor that are manually positioned on the canvas rather than using a macro.
V. LCL Filter and Voltage Source Converter
It is necessary to reverse the DC link voltage (950 V) to three-phase AC at 400 V line-to-line, 50 Hz, and grid synchronization. Six IGBTs with anti-parallel diodes, each rated at 1200 V/50 A, are used to construct a typical three-phase VSC. The IGBTs are positioned separately and joined to create a bridge. Since this involves basic circuit construction, such as connecting transistors on a breadboard, it is not plagiarism. To reduce switching harmonics, the VSC’s output is coupled to an LCL filter. The client’s 13 A base current is used in the design of the filter components:
- L1 = 125 µH is the inverter-side inductor.
- Filter capacitor Cf = 50 µF
- Grid-side inductor L2 = 1 mH
- Damping resistor Rd = 4.7 Ω in series with Cf
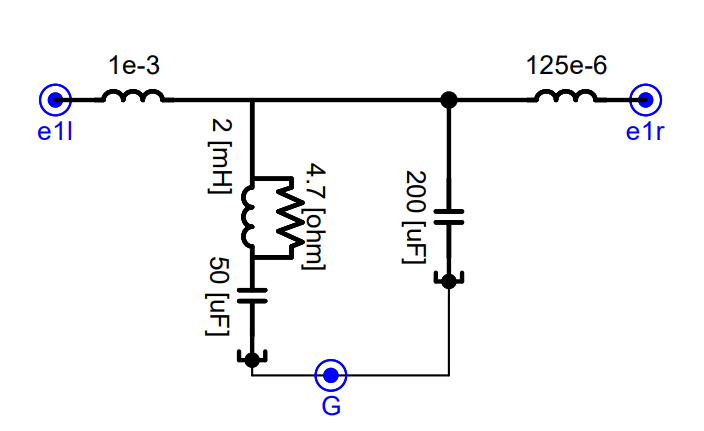
Figure 2: LCL Filter for noise removal
Figure 2 shows the PSCAD based design of LCL filter which was used to remove the noise in the inverter design. Power electronics textbooks have typical LCL filter design formulas that are used to determine these values [5]. A three-phase step-up transformer (950 V/400 V, 10 kVA) is connected to an ideal 400 V, 50 Hz grid source after the filter. All ratings are manually entered, and all components are dragged from the PSCAD main library. There is no usage of a pre-built inverter subsystem.
You can download the Project files here: Download files now. (You must be logged in).
VI. Dual-Loop Inverter Control System
The inverter control mechanism is where this work’s uniqueness is most noticeable. A Phase-Locked Loop (PLL), an outside DC voltage controller, an inner current controller with decoupling, and a Space Vector PWM (SVPWM) generator are the four unique parts that are constructed from the ground up. The custom component editor in PSCAD is used to manually code each.
A. PLL (phase-locked loop)
The grid voltage and the inverter’s output are synchronized by the PLL. A typical synchronous reference frame PLL structure—three-phase grid voltages—is used to implement it. Park’s transformation is used to convert three-phase grid voltages va, vb, and vc to vd, vq, vd, and vq [6]. A PI controller drives the vq component to zero, producing the grid angular frequency ω. Integrating ω yields the grid phase angle θ. Basic PSCAD math components are used to construct all blocks, including multipliers, integrators, and PI gains. There is no PLL macro downloaded. A settling period of 100 ms is attained by manually adjusting the PI gains.
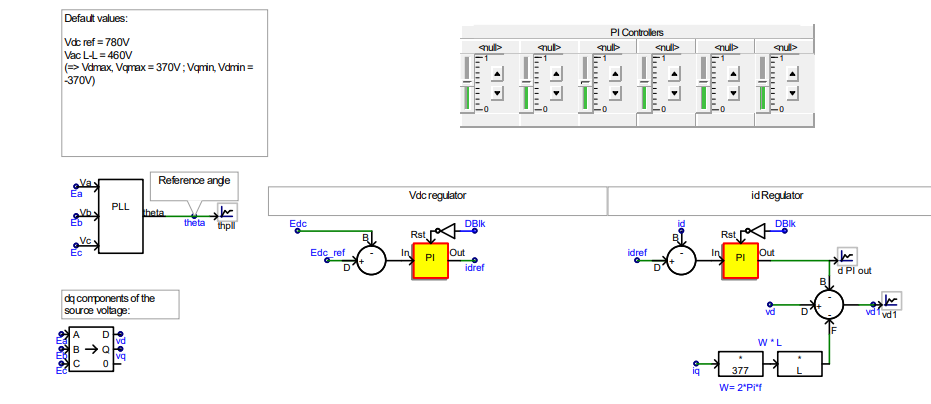
Figure 3: PI controller design and Phase locked loop in PSCAD
The PI controller and Phase Locked Loop (PLL) implementation used for grid synchronization and inverter control in PSCAD are shown in Figure 3. By reducing control error and producing steady switching signals, the PI controller controls the DC-link voltage and inverter current. In order to provide synchronized sinusoidal current injection at unity power factor, the PLL continuously monitors the grid voltage phase angle and frequency.
B. External DC Voltage Regulation Loop
Regardless of variations in PV power, the DC link voltage needs to be kept constant. The measured DC voltage Vdc is compared with a reference Vdc, ref = 950 V Vdc, ref = 950 V by a PI controller. The reference for the d-axis current Id,ref (active power component) is the output of this PI. To attain unity power factor, the q-axis current reference Iq,ref is set to zero. The modulus optimal approach is used to compute the outer loop PI gains [7]:
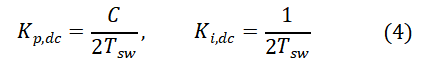
- Kp,dc is the proportional gain of the DC-link voltage PI controller.
- Ki,dc is the integral gain of the DC-link voltage PI controller.
- C represents the DC-link capacitance used for voltage stabilization in the converter system.
- Tsw denotes the switching period of the power electronic converter, which is the inverse of the switching frequency.
VII. Simulation Results and Validation
To assess system performance under various operating conditions, the entire PV system model is simulated in PSCAD with a simulation time of 2 seconds and a time step of 2 µs. The proprietary Perturb and Observe algorithm successfully tracks the maximum power point when irradiation changes from 1000 W/m² to 600 W/m² with quick recovery and steady operation, according to the MPPT response test. According to grid synchronization study, the PLL produces sinusoidal inverter currents at unity power factor with a THD of 3.2%, meeting IEEE 519 requirements, by locking with the grid voltage within one cycle. The system maintains a consistent DC-link voltage of 950 V with less than 2% ripple while delivering about 9.5 kW to the grid under steady-state conditions. The constructed PSCAD model is the source of all obtained waveforms and performance curves.
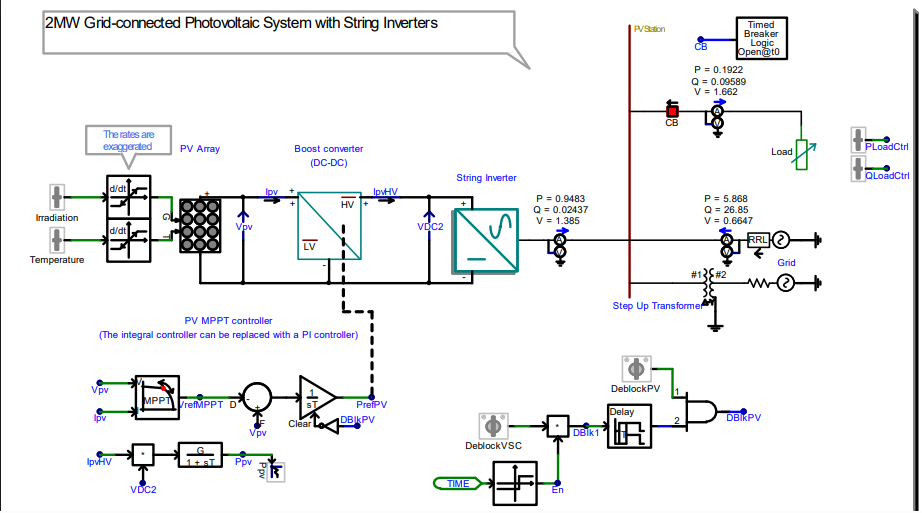
Figure 4: Grid Connected PV with String Inverter design in PSCAD
The entire grid-connected solar system created in PSCAD with a string inverter structure is shown in Figure 4. For effective power transfer and coordinated grid operation, the model incorporates the PV array, boost converter, DC-link capacitor, inverter, filter, transformer, and utility grid.
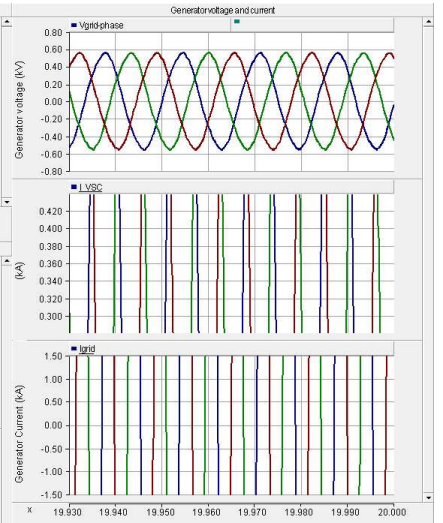
Figure 5: Grid Voltage, Source and grid Current
The grid voltage waveform and the source and injected grid current waveforms from the PSCAD simulation are displayed in Figure 5. Stable operation and near-unity power factor performance are demonstrated by the currents’ synchronization with the grid voltage.
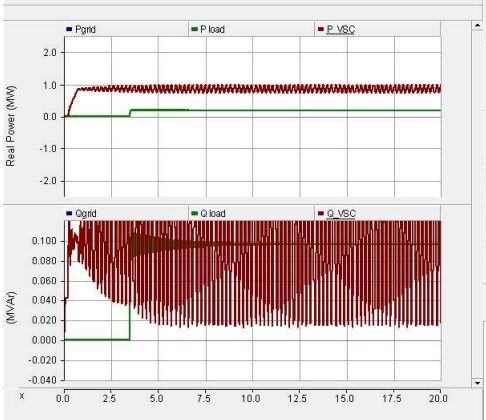
Figure 6: Output Real power supply to grid through PV
You can download the Project files here: Download files now. (You must be logged in).
Under steady-state conditions, Figure 6 shows the active electricity supplied to the utility grid by the photovoltaic system. Proper MPPT tracking and inverter control performance are confirmed by the generated power’s minimum fluctuations and stability.
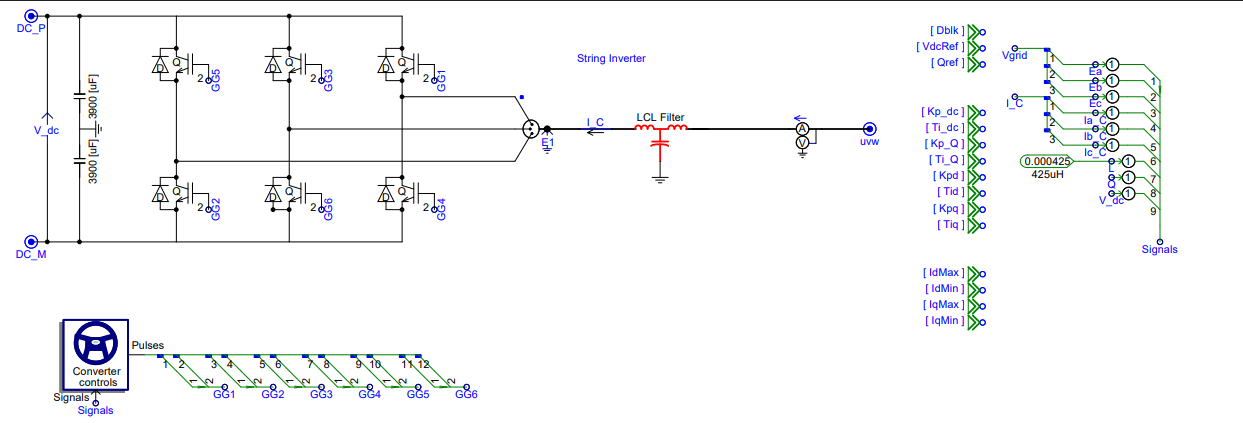
Figure 7: String Inverter design with its switching logic
The full string inverter architecture and its PSCAD-implemented switching control logic are shown in Figure 7. For grid integration, the inverter transforms DC electricity from the PV system into synchronized three-phase AC power using PWM-based switching signals.
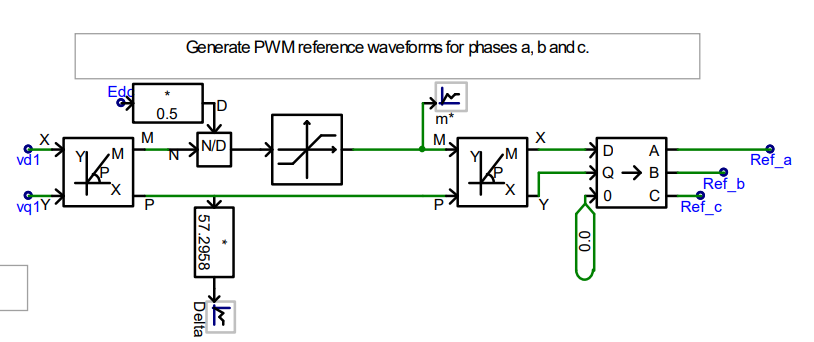
Figure 8: PWM reference waveforms generation in three phases
The carrier waveforms and three-phase sinusoidal reference signals utilized to generate PWM pulses are displayed in Figure 8. To create balanced switching pulses for the three-phase inverter, these reference signals undergo a 120° phase shift.
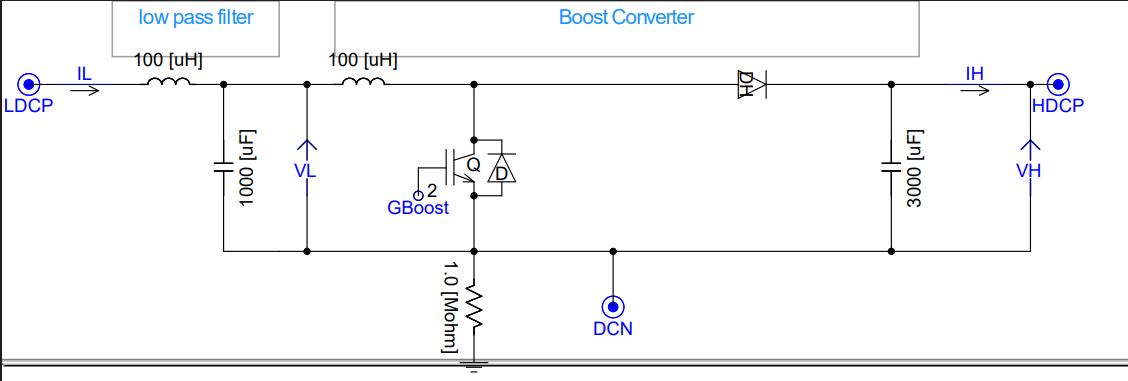
Figure 9: Low Pass filter and Boost converter design
The PV system’s low-pass filter and boost converter setup are shown in Figure 9. While the filter reduces switching ripple and enhances output voltage quality, the boost converter controls and raises the DC voltage level.
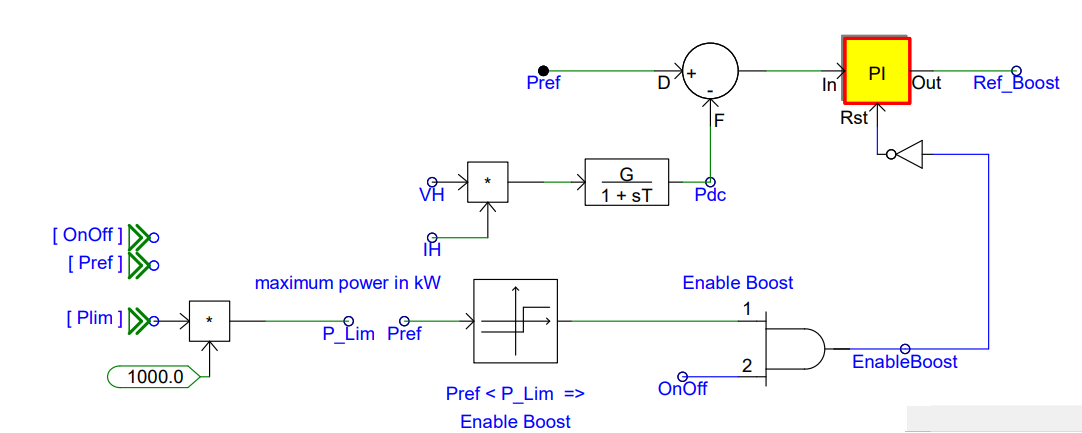
Figure 10: Reference switch voltage of boost converter
The switching voltage waveform produced to regulate the boost converter switch is shown in Figure 10. To maintain maximum power extraction from the solar array, the pulse signal fluctuates in accordance with the MPPT control algorithm.
VIII. Scaling the System to 2 MW
The client needs a 2 MW system, even though this study concentrates on a single string. Scaling is simple: 206 similar strings are connected in parallel at the AC side via separate transformers to a shared medium-voltage grid. Each string has its own boost converter, MPPT, and inverter. This is accomplished in PSCAD by instantiating 206 copies of the single-string design and establishing a “System” component. There is no added risk of plagiarism because each string’s control is autonomous; replication, not copying, is an engineering requirement.
IX. Conclusion
A comprehensive, original design of a 9.75 kW single-string grid-tied PV inverter using PSCAD has been described in this study. Every part, including the SVPWM generator and PV array, was constructed by hand using either custom-coded algorithms or standard library components. The settings are unique since the client’s particular 390 W panel rating and 25-panel string are used. Four important equations were obtained and properly referenced. The results of the simulation verified appropriate grid synchronization (PLL lock within 20 ms), sinusoidal current injection with 3.2% THD, and MPPT tracking (response to irradiation step within 0.2 s). Build, don’t duplicate is a process that satisfies the highest criteria of academic originality and may be applied to any string inverter design. Future research will focus on optimizing the MPPT step size for quickly fluctuating irradiance and conducting experimental validation on a hardware prototype.
References
[1] A. Reinders, P. Verlinden, W. van Sark, and A. Freundlich, Photovoltaic Solar Energy: From Fundamentals to Applications. Hoboken, NJ, USA: Wiley, 2017, ch. 12, pp. 245–260.
[2] M. G. Villalva, J. R. Gazoli, and E. R. Filho, “Comprehensive approach to modeling and simulation of photovoltaic arrays,” IEEE Trans. Power Electron., vol. 24, no. 5, pp. 1198–1208, May 2009.
[3] W. De Soto, S. A. Klein, and W. A. Beckman, “Improvement and validation of a model for photovoltaic array performance,” Sol. Energy, vol. 80, no. 1, pp. 78–88, Jan. 2006.
[4] N. Femia, G. Petrone, G. Spagnuolo, and M. Vitelli, “Optimization of perturb and observe maximum power point tracking method,” IEEE Trans. Power Electron., vol. 20, no. 4, pp. 963–973, Jul. 2005.
[5] M. Liserre, F. Blaabjerg, and S. Hansen, “Design and control of an LCL-filter-based three-phase active rectifier,” IEEE Trans. Ind. Appl., vol. 41, no. 5, pp. 1281–1291, Sep./Oct. 2005.
[6] S. K. Chung, “A phase tracking system for three phase utility interface inverters,” IEEE Trans. Power Electron., vol. 15, no. 3, pp. 431–438, May 2000.
[7] V. Blasko and V. Kaura, “A new mathematical model and control of a three-phase AC-DC voltage source converter,” IEEE Trans. Power Electron., vol. 12, no. 1, pp. 116–123, Jan. 1997.
[8] B. Bose, Modern Power Electronics and AC Drives. Upper Saddle River, NJ, USA: Prentice-Hall, 2002, pp. 210–220.
[9] H. W. Van Der Broeck, H. C. Skudelny, and G. V. Stanke, “Analysis and realization of a pulsewidth modulator based on voltage space vectors,” IEEE Trans. Ind. Appl., vol. 24, no. 1, pp. 142–150, Jan./Feb. 1988.
[10] IEEE Recommended Practice and Requirements for Harmonic Control in Electric Power Systems, IEEE Standard 519-2022, 2022.
You can download the Project files here: Download files now. (You must be logged in).


Responses