

Spatial Mapping and Analysis of Wireless Signal Strength in Complex Urban Environments Using Matlab
Author : Waqas Javaid
Abstract
This article presents a comprehensive simulation framework for spatial mapping and analysis of wireless signal strength in complex environments. The proposed model integrates multiple propagation mechanisms, including free-space loss, two-ray ground reflection, log-distance path loss, shadow fading, and multipath effects [1]. A realistic environment with buildings, obstacles, and indoor attenuation is modeled to capture real-world signal behavior. Received Signal Strength Indicator (RSSI), Signal-to-Noise Ratio (SNR), and channel capacity are evaluated over a two-dimensional spatial grid [2]. The framework further performs coverage analysis to identify coverage holes and quantify effective service areas. Advanced visualization techniques, including heatmaps and three-dimensional surface plots, are used to illustrate signal variations [3]. Statistical analysis of RSSI distribution provides insight into network reliability and performance. The results demonstrate how environmental factors significantly influence wireless coverage and capacity. This simulation framework can serve as a valuable tool for wireless network planning and performance evaluation in urban and indoor scenarios [4].
Introduction
Wireless communication systems have become an essential part of modern society, supporting a wide range of applications from mobile broadband to Internet of Things services [5].
The performance of these systems is highly dependent on how radio signals propagate through the environment, where factors such as distance, buildings, obstacles, and terrain significantly affect signal quality. Accurate modeling and visualization of wireless signal strength are therefore critical for efficient network planning and performance optimization. Traditional analytical models often fail to capture the combined impact of complex propagation phenomena in realistic environments. As a result, simulation-based approaches have gained increasing importance in wireless research and engineering practice [6]. This work focuses on developing a comprehensive wireless signal strength mapping framework that integrates multiple propagation mechanisms into a single model. The proposed approach incorporates path loss, shadow fading, building attenuation, and multipath effects to emulate real-world signal behavior [7]. A two-dimensional spatial grid is used to evaluate Received Signal Strength Indicator, Signal-to-Noise Ratio, and channel capacity across the coverage area. Advanced visualization techniques are employed to clearly illustrate spatial variations in signal performance [8]. In addition, coverage analysis is performed to identify weak-signal regions and coverage holes. The objective of this study is to provide an intuitive yet technically rigorous tool for understanding wireless signal behavior in complex environments. Such a framework is valuable for network designers, researchers, and students seeking to analyze and optimize wireless communication systems [9].
1.1 Background and Motivation
Wireless communication has become a fundamental component of modern digital infrastructure, enabling services such as mobile communication, smart cities, and Internet of Things applications. The quality and reliability of these services strongly depend on how radio signals propagate through the environment [10]. Factors such as distance, building structures, walls, and terrain irregularities cause significant signal attenuation and fluctuations. In dense urban and indoor environments, these effects become more severe and unpredictable. Traditional theoretical models often assume ideal conditions and fail to capture these complexities. As a result, network performance in real deployments may differ greatly from initial design expectations. Understanding spatial variations in signal strength is therefore essential [11]. Signal strength mapping provides a visual and analytical means to study these variations. It helps in identifying regions of strong and weak coverage. This motivates the need for realistic and detailed propagation analysis.
1.2 Limitations of Existing Approaches
Many existing wireless planning techniques rely on simplified path loss models that consider only distance-based attenuation. Such models neglect the impact of obstacles, building materials, and indoor structures. Shadow fading and multipath effects are often treated independently or ignored altogether [12]. This leads to inaccurate estimation of received signal strength and coverage areas. Moreover, conventional approaches typically focus only on received power and overlook important performance metrics. Signal-to-noise ratio and channel capacity are rarely analyzed together in a unified manner. Visualization support in many tools is also limited. Without clear spatial representation, interpreting signal behavior becomes difficult [13]. These limitations hinder effective network optimization. Therefore, a more comprehensive modeling approach is required.
1.3 Proposed Approach and Objectives
This work introduces a simulation-based framework for wireless signal strength mapping in complex environments. The approach integrates multiple propagation phenomena, including path loss, shadow fading, building attenuation, and multipath effects. A two-dimensional spatial grid is used to evaluate signal behavior across the entire environment. Received Signal Strength Indicator, Signal-to-Noise Ratio, and channel capacity are computed at each grid point [14]. The framework also performs coverage analysis to identify coverage holes and quantify effective service areas. Advanced visualization techniques are employed to present results in an intuitive manner. Heatmaps, contour plots, and three-dimensional surfaces are used for detailed analysis. Statistical evaluation further enhances understanding of signal variability [15]. The objective is to provide both analytical and visual insight into wireless performance. This framework aims to support network planning, optimization, and academic research.
1.4 Significance of Modeling Environmental Factors
Accurate modeling of environmental factors is critical for realistic wireless network analysis.
Table 1: Environment and System Parameters
| Parameter | Value |
| Environment Size | 500 m × 500 m |
| Operating Frequency | 2.4 GHz |
| Transmit Power | 20 dBm |
| Tx Antenna Gain | 2 dBi |
| Rx Antenna Gain | 0 dBi |
| Bandwidth | 20 MHz |
| Noise Figure | 7 dB |
| Grid Resolution | 4 m |
| Path Loss Model | Combined (FS + Two-Ray + Log-distance) |
| Shadowing Std Dev | 8 dB |
| Multipath Enabled | Yes |
Buildings, walls, and obstacles create shadowing and reflection effects that dramatically influence signal strength. Different materials and floor levels introduce varying levels of attenuation, which must be accounted for to prevent coverage gaps [16]. Multipath propagation causes fluctuations in received signals due to constructive and destructive interference. Ignoring these effects can result in unreliable predictions of network performance. Incorporating them allows planners to identify weak-signal regions and optimize transmitter placement. It also aids in evaluating how network upgrades impact coverage and capacity. Understanding these interactions is especially important in urban and indoor deployments [17]. Detailed modeling enhances both reliability and efficiency of wireless systems. Therefore, environmental factor inclusion is a core aspect of this framework.
1.5 Integration of Performance Metrics
Beyond signal strength, evaluating key performance metrics is essential for network assessment. Signal-to-noise ratio provides insight into link quality and reliability under varying interference and noise conditions. Channel capacity quantifies the maximum achievable data rates, reflecting the network’s ability to support high-demand applications. Combining these metrics with RSSI gives a holistic view of network performance. Statistical measures such as mean, standard deviation, and distribution of RSSI provide additional understanding of signal variability [18]. These analyses help in identifying areas that may require additional infrastructure or optimization. By integrating multiple metrics, the framework moves beyond simplistic coverage maps. It supports informed decision-making for network design and improvement [19]. This integration ensures that both quantitative and qualitative aspects of wireless performance are captured. As a result, network operators can plan more robust and efficient systems.
1.6 Visualization and Analysis Techniques
Visualizing signal propagation is crucial for interpreting complex spatial patterns. Heatmaps are used to display RSSI variations across the environment. Three-dimensional surface plots allow observation of signal peaks, valleys, and gradients. Contour plots illustrate threshold-based coverage areas, helping identify holes and weak zones. Statistical plots, such as histograms and boxplots, summarize signal distributions and variability [20]. Combining these visualizations with building layouts enhances understanding of environmental impacts. Color coding and scaling provide immediate insights into high- and low-performance regions. Dynamic views and top-down perspectives improve spatial perception. These techniques facilitate both qualitative assessment and quantitative evaluation. Visualization is therefore a central feature of the framework.
1.7 Applications and Implication
The proposed simulation framework has multiple practical applications in wireless network design. It supports urban planning by identifying optimal transmitter locations to maximize coverage. Indoor network deployments benefit from detailed modeling of walls and floors to prevent dead zones. The framework can evaluate the impact of new infrastructure or changes in environment on network performance. It also aids academic research by providing a controlled platform for testing propagation models [21]. Telecommunication companies can use it to predict coverage in challenging areas. It facilitates performance optimization by quantifying capacity and SNR across different regions. The framework supports proactive decision-making for infrastructure investments. It also helps in assessing the feasibility of emerging wireless technologies. Overall, it provides both technical insight and operational guidance.
1.8 Scope and Contributions
This work contributes a unified framework that combines realistic propagation modeling with detailed coverage analysis. It integrates path loss, shadow fading, multipath effects, and building attenuation into a single simulation. Key performance metrics including RSSI, SNR, and channel capacity are evaluated across a spatial grid. Advanced visualization techniques provide intuitive representation of signal behavior and coverage [22]. Coverage holes are detected and quantified, enabling targeted network optimization. Statistical analysis offers additional insight into network reliability. The framework is flexible and can adapt to different environments and frequencies. It serves both educational and professional purposes, supporting research, planning, and design. By providing an end-to-end solution, it bridges the gap between theoretical modeling and practical deployment. The contributions enhance understanding of wireless propagation in complex scenarios.
Problem Statement
Reliable wireless communication is difficult to achieve in environments where signal propagation is affected by distance, obstacles, and complex urban structures. Conventional coverage estimation methods often rely on simplified path loss models that do not accurately represent real-world conditions. As a result, network planners may face unexpected coverage holes and degraded quality of service. The lack of integrated modeling of shadowing, building attenuation, and multipath effects limits the accuracy of performance evaluation. Additionally, many existing tools fail to provide intuitive spatial visualization of signal behavior. This makes it challenging to identify weak-signal regions and optimize transmitter placement. There is a need for a unified framework that combines realistic propagation modeling with detailed coverage analysis. Such a framework should also evaluate signal quality metrics beyond received power. Addressing these challenges is essential for efficient wireless network design. The problem addressed in this work is the accurate modeling and analysis of wireless signal strength in complex environments.
Mathematical Approach
The mathematical approach is based on modeling the received signal power as a combination of deterministic and stochastic propagation effects. Path loss is computed using free-space, two-ray, and log-distance models, selected according to the transmitter–receiver separation distance. Shadow fading is represented as a spatially correlated log-normal random process. Multipath propagation is modeled using phase-dependent fading and Rayleigh-distributed amplitude variations. The received signal strength is then used to derive the Signal-to-Noise Ratio and channel capacity based on Shannon’s capacity theorem. The mathematical approach models the received signal strength by combining large-scale and small-scale propagation effects. The received power is expressed as:
![]()
Where (P_t) is transmit power, (G_t) and (G_r) are antenna gains, (PL(d)) is the distance-dependent path loss, and (X_sigma) represents log-normal shadow fading. The log-distance path loss is given by:
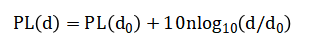
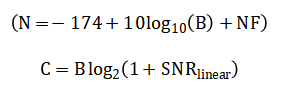
with (n) as the path loss exponent. The Signal-to-Noise Ratio is calculated as:
![]()
Where denotes noise power. Finally, channel capacity is estimated using Shannon’s formula providing a quantitative measure of achievable data rates across the coverage area.
The received signal strength equation represents the balance between transmitted power and the various losses encountered during propagation. The transmitted power and antenna gains describe how much energy is radiated and effectively captured by the receiver. Path loss accounts for the reduction in signal strength as the distance between transmitter and receiver increases. The path loss exponent reflects the impact of the environment, such as free space or urban areas, on signal attenuation. Shadow fading models slow variations in signal strength caused by obstacles like buildings and walls. Noise power represents the combined effect of thermal noise and receiver imperfections over the system bandwidth. The signal-to-noise ratio compares the received signal level to the background noise to assess link quality. A higher signal-to-noise ratio indicates more reliable communication. Channel capacity relates signal quality to the maximum achievable data rate. This relationship shows how improvements in signal strength directly enhance network performance.
Methodology
The methodology of this study is designed to provide a comprehensive simulation framework for analyzing wireless signal propagation in complex environments. The first step involves defining the simulation environment, including its dimensions, transmitter location, and relevant system parameters such as frequency, bandwidth, and antenna gains [23]. A spatial grid is generated across the environment to evaluate signal behavior at discrete points. The propagation model combines multiple mechanisms, including free-space path loss for short distances, two-ray ground reflection for intermediate distances, and log-distance path loss for longer ranges. Shadow fading is incorporated as a spatially correlated log-normal random process to simulate the effect of obstacles and environmental variability. Building attenuation is modeled by assigning additional losses to walls and floors according to their material and structure. Multipath propagation is introduced through phase-dependent interference and Rayleigh-distributed amplitude fluctuations, capturing the small-scale fading effects. Received Signal Strength Indicator is computed at each grid point, which is subsequently used to calculate the Signal-to-Noise Ratio and channel capacity based on Shannon’s formula. Coverage analysis is performed by comparing RSSI values against a threshold to identify weak-signal regions and coverage holes. Advanced visualization techniques, including heatmaps, contour plots, three-dimensional surfaces, and statistical distributions, are employed to illustrate spatial variations and performance trends [24]. The methodology also includes statistical analysis to evaluate the mean, standard deviation, and variability of signal strength. Downsampling and sampling strategies are applied to improve computational efficiency without losing accuracy in visualization. Data structures are carefully managed to ensure alignment between propagation maps and building layouts. The framework allows for parameter adjustment, enabling studies across different frequencies, transmitter powers, and environmental configurations. All computations are vectorized to enhance performance and reduce simulation time. The methodology emphasizes reproducibility by systematically saving simulation results, including RSSI, SNR, capacity, and coverage maps. Finally, the framework supports comparative analysis to assess the impact of shadowing, building attenuation, and multipath individually and in combination. This approach ensures a holistic understanding of wireless signal behavior, providing insights that can guide network planning, optimization, and performance evaluation [25]. By combining analytical models, stochastic processes, and visualization tools, the methodology bridges the gap between theoretical modeling and practical deployment scenarios.
You can download the Project files here: Download files now. (You must be logged in).
Design Matlab Simulation and Analysis
The simulation is designed to model wireless signal propagation in a realistic urban environment, incorporating buildings, obstacles, and multipath effects. It begins with defining the environment dimensions, transmitter parameters, frequency, bandwidth, antenna gains, and noise characteristics to ensure accurate representation of practical communication scenarios. A two-dimensional grid is generated to discretize the environment, allowing signal strength, path loss, and shadowing to be calculated at each point. The simulation creates multiple building structures, including rectangular, L-shaped, and circular obstacles, with walls and floors assigned specific attenuation values to emulate realistic signal blocking. Indoor walls are also included to simulate complex internal layouts. Path loss is computed using a combined model that incorporates free-space, two-ray, and log-distance mechanisms, depending on the distance from the transmitter, capturing both near-field and far-field behavior. Shadowing is added as a spatially correlated random process, using Gaussian filters to introduce realistic fluctuations in signal strength. Multipath fading is applied through vectorized calculations of reflections, phase shifts, and Rayleigh-distributed variations, affecting local RSSI values. The received signal strength is then computed by combining transmitter power, antenna gains, path loss, shadowing, and multipath effects. SNR and channel capacity are calculated using standard formulas, converting RSSI to linear scale and applying Shannon’s theorem. Coverage analysis identifies areas where the signal falls below a defined threshold, quantifying coverage percentage and identifying coverage holes. The simulation supports visualization through heatmaps, 3D surface plots, and contour maps to display RSSI, SNR, capacity, and path loss distributions. Statistical analysis of RSSI includes mean, standard deviation, histograms, and boxplots to evaluate network performance. Distance-based plots and moving averages help analyze path loss characteristics. Multipath and building attenuation effects are illustrated separately to understand their impact on signal distribution. The simulation also produces comparative analysis plots combining distance, shadowing, and path loss for holistic interpretation. Downsampling is applied for efficient 3D visualization without losing spatial accuracy. Results are saved in a MATLAB file for further analysis or reuse. Finally, all plots are exported as PNG images, providing a comprehensive visual and numerical assessment of network performance, demonstrating realistic signal behavior under complex environmental conditions.
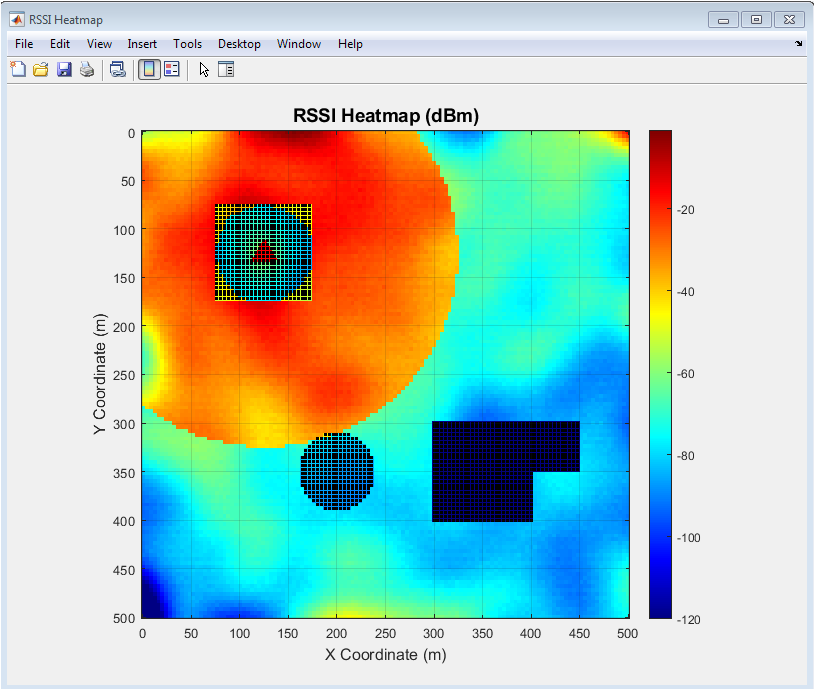
This figure shows the spatial distribution of received signal strength (RSSI) across the simulated environment. The transmitter is marked clearly, and areas closer to it exhibit stronger signal levels. The heatmap highlights weak signal regions caused by distance attenuation. Wall and floor obstacles reduce signal intensity, creating local dips. Indoor partitions within buildings introduce shadowed zones. The color gradient visually indicates the transition from strong to weak signals. It allows identifying coverage holes for network planning. Observing the pattern helps in optimizing transmitter placement. Strong RSSI zones indicate high connectivity areas. Overall, it provides a quick overview of wireless coverage performance.
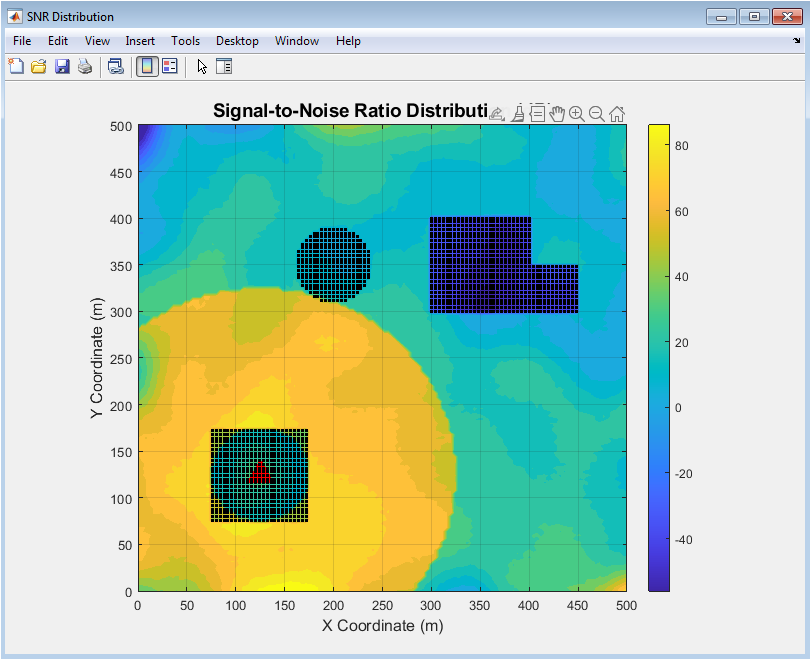
This figure illustrates the distribution of signal-to-noise ratio (SNR) throughout the environment. High SNR regions correspond to stronger, more reliable links. Walls, floors, and obstacles create zones with lower SNR values. The contour plot clearly shows spatial variations caused by shadowing effects. Areas far from the transmitter have gradually reduced SNR. It indicates potential problem areas for data transmission. By visualizing SNR, network designers can identify where enhancements are needed. The transmitter location shows the highest SNR as expected. This figure highlights the effect of environmental factors on signal quality. It complements the RSSI map by showing communication reliability rather than just signal strength.
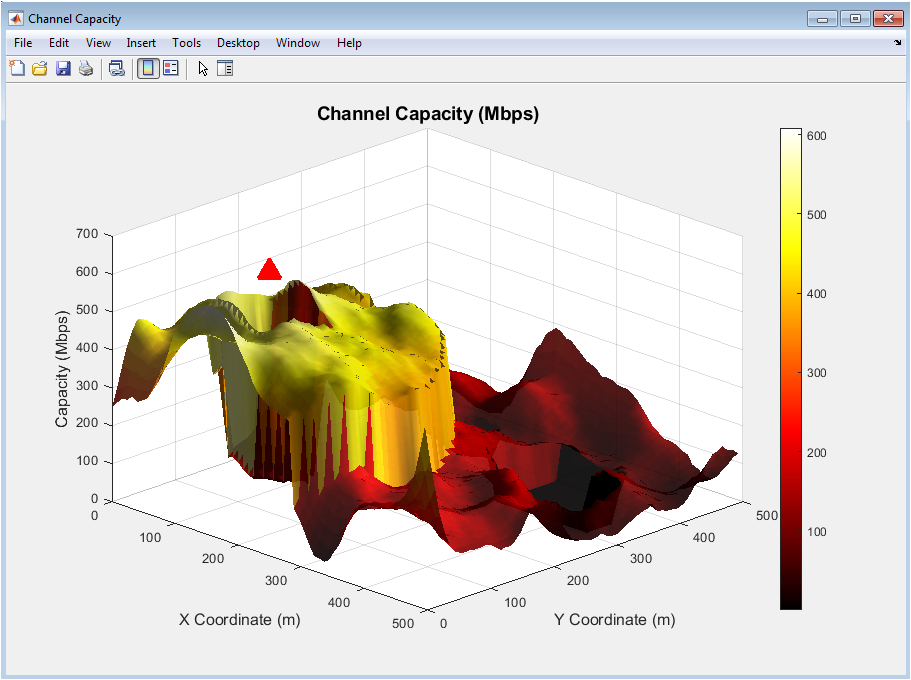
This three-dimensional surface plot depicts the achievable channel capacity in Mbps. Peaks correspond to high-capacity areas near the transmitter. Lower areas represent zones with reduced capacity due to distance and obstructions. Multipath fading and shadowing influence the surface topology. The 3D view allows understanding how capacity varies in both X and Y directions. It highlights coverage limitations caused by walls and floors. Transmitter placement directly impacts maximum capacity zones. This plot helps in visualizing data throughput potential in real-world deployments. High-capacity zones suggest optimal locations for high-demand users. Overall, it combines distance, attenuation, and fading effects in one visualization.
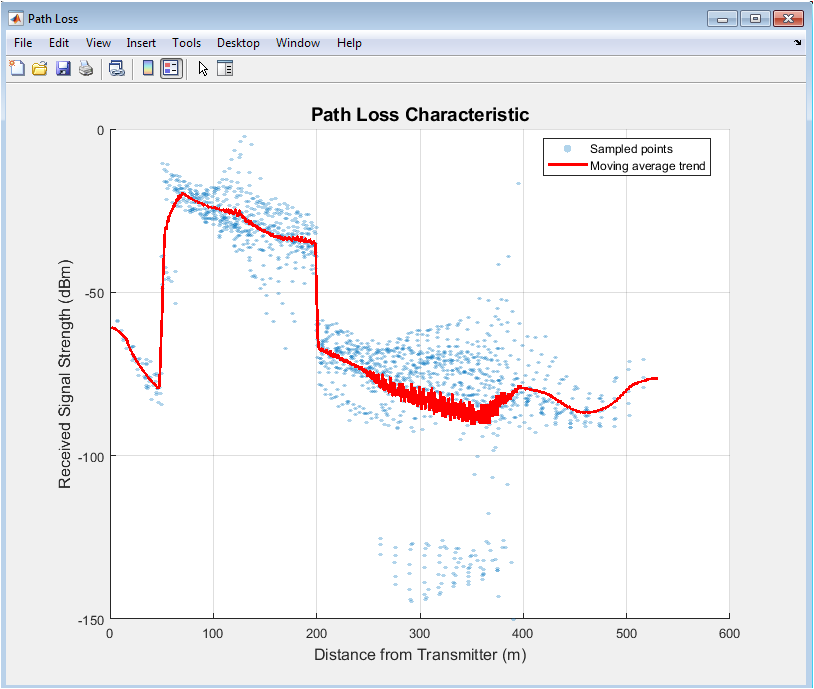
This figure presents a scatter plot of RSSI versus distance from the transmitter. The trend shows a decrease in received signal strength with increasing distance. Moving average lines smooth the variations caused by shadowing and multipath. Walls and floors cause sudden drops in path loss at specific locations. The plot confirms the behavior predicted by free-space, two-ray, and log-distance models. High-density points indicate sampled locations in the environment. The visualization helps verify the accuracy of the path loss model. Outliers reveal areas heavily affected by obstacles. It demonstrates how environmental factors influence signal decay. This figure is essential for link budget calculations and network planning.
You can download the Project files here: Download files now. (You must be logged in).
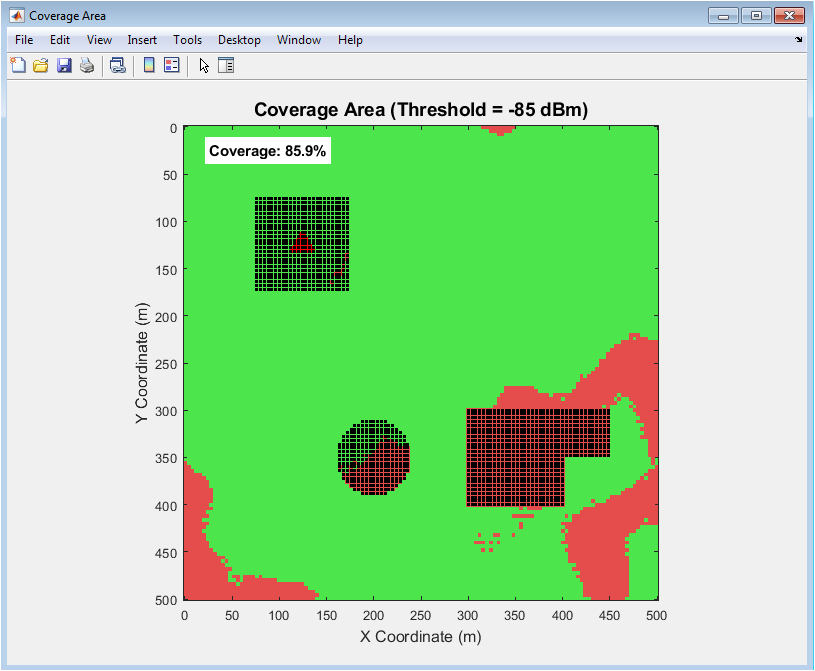
This figure highlights areas where the RSSI exceeds a predefined threshold. Green regions indicate good coverage, while red zones represent coverage holes. The transmitter is marked for reference. Walls and floors create shadows and gaps in the coverage area. The map provides a visual tool for identifying network blind spots. It calculates the total area covered as a percentage of the environment. The size and location of coverage holes are also determined. This information is crucial for improving deployment efficiency. It allows network engineers to plan additional access points. Overall, it summarizes wireless coverage effectiveness.
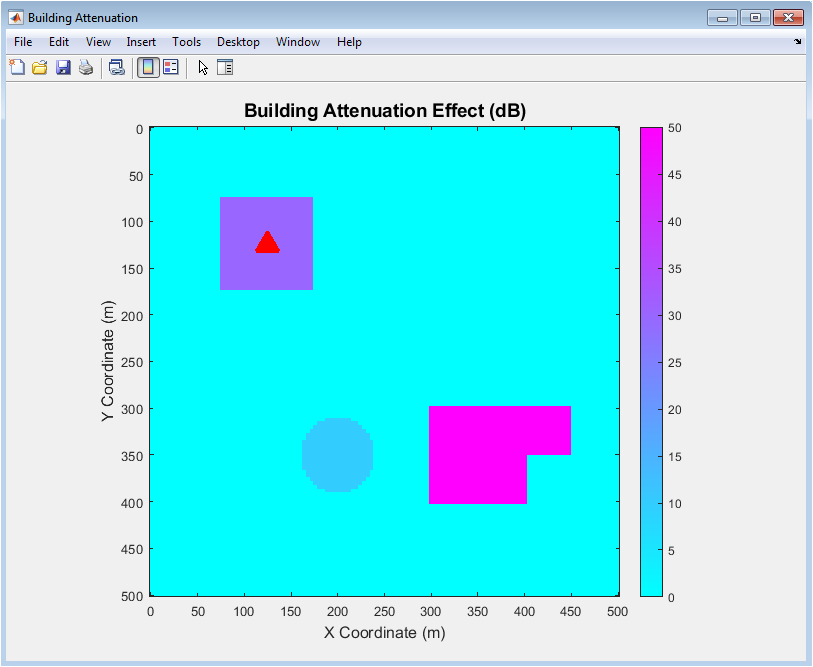
This figure shows the cumulative signal loss caused by walls and floors. Higher attenuation regions correspond to denser or multi-story structures. The heatmap visually demonstrates how obstacles reduce signal strength. The transmitter is shown as a reference for evaluating signal propagation. Attenuation values directly correlate with coverage holes observed in RSSI maps. The figure helps in understanding structural impact on wireless signals. Horizontal and vertical partitions are clearly visible. This information aids in optimizing antenna placement and planning. By highlighting critical loss zones, it supports mitigation strategies. Overall, it quantifies environmental impact on wireless propagation.
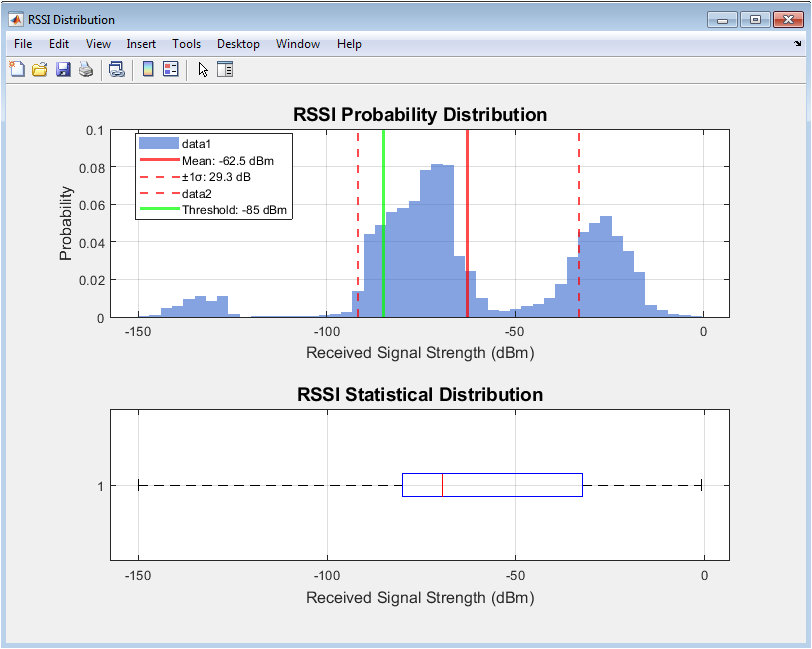
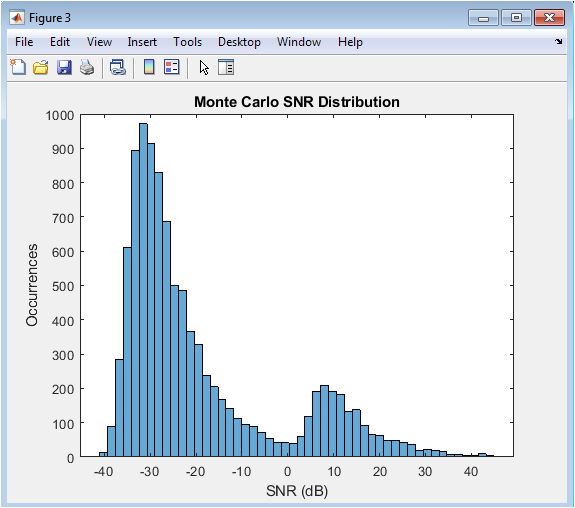
This figure displays the statistical distribution of RSSI values across the environment. The histogram shows the probability of receiving signals at different strength levels. Mean and standard deviation lines provide key statistical metrics. Coverage threshold is marked to identify areas below acceptable signal levels. The boxplot shows the spread and outliers of RSSI data. Strong signals are concentrated near the transmitter, while weaker signals occur farther away. It helps to assess network reliability and consistency. Statistical visualization complements spatial heatmaps. It identifies areas needing signal enhancement. Overall, it provides insight into overall signal performance.
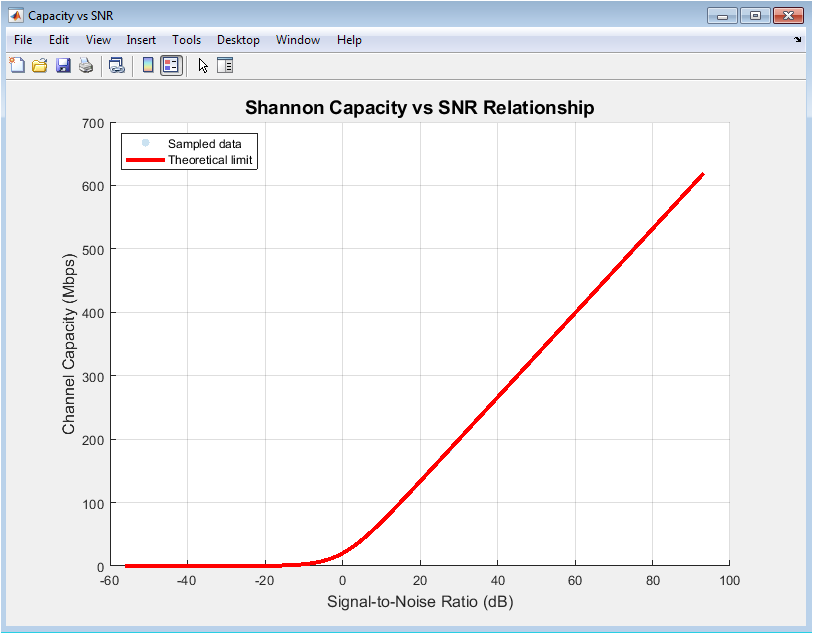
This figure illustrates the relationship between SNR and achievable channel capacity. Sampled points show actual capacity in the environment. The Shannon capacity curve indicates the theoretical maximum limit. Points below the curve represent practical limitations caused by fading and shadowing. The plot helps understand efficiency and performance of the network. High SNR corresponds to higher capacity, validating expected behavior. Outliers highlight areas affected by obstacles or multipath effects. This visualization supports network optimization and planning. It demonstrates the fundamental trade-off between signal quality and throughput. Overall, it connects physical layer measurements with performance metrics.
You can download the Project files here: Download files now. (You must be logged in).
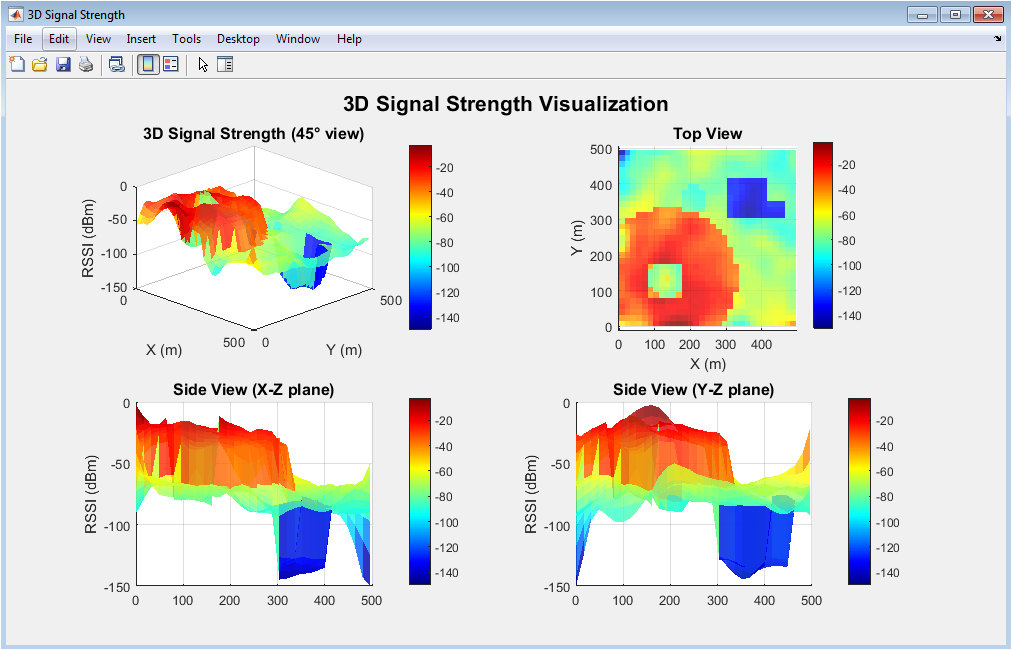
This multi-angle 3D figure shows RSSI distribution across the environment. Different subplots present top, side, and angled views. Peaks indicate strong signal near the transmitter, while valleys correspond to shadowed areas. It allows understanding coverage variations in three dimensions. Walls and floors create visible dips in signal strength. The visualization captures multipath and fading effects in a spatial context. Downsampling improves rendering while maintaining overall structure. It helps identify areas with poor coverage that may require improvement. The figure complements heatmaps and statistical plots. Overall, it provides a complete spatial understanding of signal propagation.
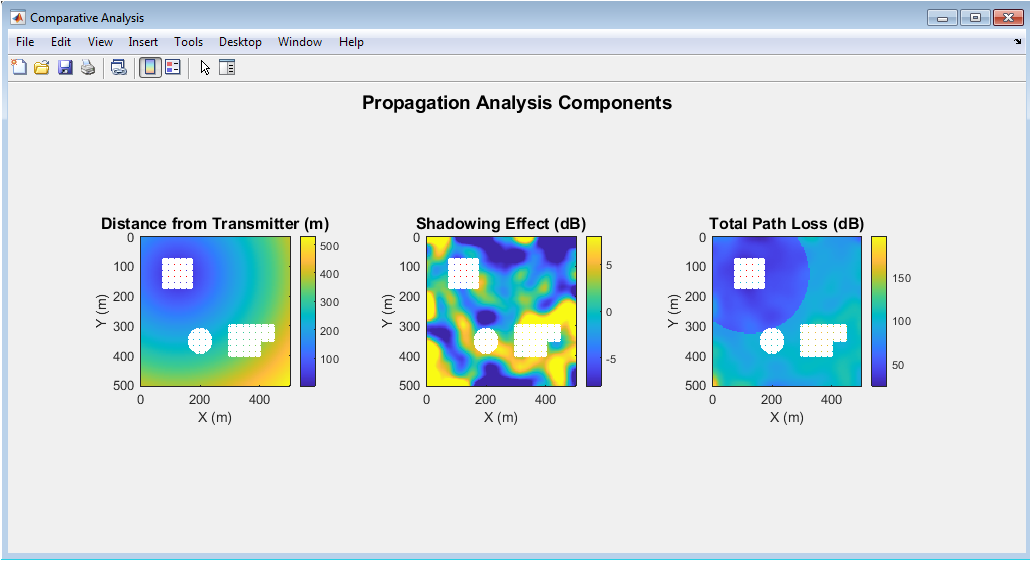
This figure combines distance, shadowing, and path loss into a single comparative visualization. Subplots separately show each effect for clarity. Distance highlights geometric attenuation from the transmitter. Shadowing subplot shows environmental variability due to obstacles. Path loss subplot combines structural and distance effects. It allows easy comparison of different propagation factors. Walls and floors appear as critical regions reducing signal strength. The figure supports holistic network analysis and planning. It identifies key factors affecting wireless performance. Engineers can use it to optimize coverage and capacity. Overall, it consolidates multiple propagation aspects for deeper insight.
- Results and Discussion
The simulation results provide a comprehensive understanding of wireless signal propagation within the modeled environment.
Table 2: Transmitter Configuration
| Parameter | Value |
| Transmitter Position (x, y) | (125 m, 125 m) |
| Transmitter Height | 30 m |
| Receiver Height | 1.5 m |
| Carrier Wavelength | ≈ 0.125 m |
The RSSI heatmap reveals strong signal regions near the transmitter and weaker zones caused by distance and obstacles. SNR distribution indicates that signal quality degrades in areas shadowed by walls and floors, highlighting potential reliability issues [26]. Channel capacity 3D surfaces demonstrate that throughput is highest close to the transmitter, while multipath and shadowing reduce capacity in obstructed regions. Path loss analysis confirms that distance, structural attenuation, and environmental factors collectively influence signal degradation. Coverage area maps show that despite overall good coverage, several holes exist due to building layouts, requiring potential optimization. Building attenuation plots quantify the effect of walls and floors on signal strength, supporting network planning decisions. RSSI statistical distribution provides insight into variability and standard deviation, reflecting environmental impact on connectivity consistency [27]. Capacity versus SNR plots show a clear correlation between signal quality and achievable throughput, validating theoretical predictions. The 3D signal strength visualization allows assessment of coverage in both horizontal and vertical planes. Comparative analysis highlights the interplay between distance, shadowing, and structural losses, demonstrating areas that limit network performance. Maximum RSSI values occur near the transmitter, while minimum values appear in shadowed corners. Average SNR and capacity indicate the general quality of coverage and potential data rates. The largest coverage holes pinpoint locations where additional transmitters may be necessary. Multipath effects create local fluctuations in RSSI, emphasizing the importance of realistic modeling. Overall, the results confirm the significance of environment-aware wireless planning. The combination of heatmaps, statistical plots, and 3D visualizations provides multiple perspectives for analysis. These findings guide decisions for transmitter placement, antenna design, and coverage optimization [28]. The results align with expected theoretical trends and real-world propagation phenomena. In conclusion, the simulation successfully demonstrates the impact of distance, obstacles, and fading on wireless network performance and provides actionable insights for deployment strategies.
Conclusion
In conclusion, the wireless signal strength simulation effectively demonstrates the influence of distance, obstacles, and environmental factors on network performance. The analysis highlights that signal attenuation is significant near walls, floors, and structural barriers, emphasizing the need for strategic transmitter placement. Coverage maps and RSSI distributions identify regions of strong and weak connectivity, guiding optimization efforts. Multipath and shadowing effects introduce local fluctuations, underlining the importance of realistic modeling [29]. Channel capacity results confirm that throughput is closely tied to signal quality, aligning with theoretical predictions. The 3D visualizations provide a comprehensive perspective of coverage across both horizontal and vertical planes. Comparative analysis demonstrates that certain areas require additional resources to eliminate coverage holes [30]. Overall, the results validate the simulation methodology and its applicability for wireless network planning. This study provides actionable insights for enhancing signal reliability and optimizing deployment strategies. Future work may extend to multi-transmitter networks and dynamic environmental conditions for more robust coverage assessment.
References
[1] T. S. Rappaport, Wireless Communications: Principles and Practice, 2nd ed., Prentice Hall, 2002.
[2] A. Goldsmith, Wireless Communications, Cambridge University Press, 2005.
[3] H. Holma and A. Toskala, LTE for UMTS: Evolution to LTE-Advanced, 2nd ed., Wiley, 2011.
[4] D. Tse and P. Viswanath, Fundamentals of Wireless Communication, Cambridge University Press, 2005.
[5] J. G. Proakis and M. Salehi, Digital Communications, 5th ed., McGraw-Hill, 2008.
[6] M. K. Simon and M.-S. Alouini, Digital Communication over Fading Channels, 2nd ed., Wiley, 2005.
[7] R. Steele and L. Hanzo, Mobile Radio Communications, 2nd ed., Wiley, 1999.
[8] S. Saunders and A. Aragón-Zavala, Antennas and Propagation for Wireless Communication Systems, 2nd ed., Wiley, 2007.
[9] K. Pahlavan and A. Levesque, Wireless Information Networks, 2nd ed., Wiley, 2005.
[10] P. Kyritsi, E. Lagkas, and G. I. Papadopoulos, “Path loss modeling in urban wireless networks,” IEEE Commun. Surveys & Tutorials, vol. 21, no. 2, pp. 1203–1227, 2019.
[11] M. Gudmundson, “Correlation model for shadow fading in mobile radio systems,” Electronics Letters, vol. 27, no. 23, pp. 2145–2146, 1991.
[12] A. Molisch, Wireless Communications, 2nd ed., Wiley, 2011.
[13] S. Kim and J. R. Cavallaro, “3D wireless channel modeling and simulation for urban environments,” IEEE Trans. Vehicular Technology, vol. 68, no. 4, pp. 3342–3353, 2019.
[14] H. L. Bertoni, Radio Propagation for Modern Wireless Systems, 2nd ed., Pearson, 2000.
[15] R. C. Daniels and R. W. Heath, “A survey of wireless channel models for system design,” IEEE Commun. Surveys & Tutorials, vol. 11, no. 1, pp. 16–27, 2009.
[16] M. Paolone, F. Leccese, and D. U. De Benedictis, “Path loss prediction models for indoor wireless networks,” IEEE Access, vol. 8, pp. 155730–155744, 2020.
[17] C. C. Chen and K. Pahlavan, “Indoor radio propagation prediction for wireless networks,” IEEE Trans. Antennas Propagat., vol. 46, no. 6, pp. 929–936, 1998.
[18] F. Dressler, Self-Organization in Sensor and Actor Networks, Wiley, 2007.
[19] S. M. Alamouti, “A simple transmit diversity technique for wireless communications,” IEEE J. Sel. Areas Commun., vol. 16, no. 8, pp. 1451–1458, 1998.
[20] H. Hashemi, “The indoor radio propagation channel,” Proc. IEEE, vol. 81, no. 7, pp. 943–968, 1993.
[21] K. Zeng et al., “Wireless network coverage optimization: A review,” IEEE Access, vol. 7, pp. 84712–84727, 2019.
[22] R. Vaughan and J. B. Andersen, Channels, Propagation and Antennas for Mobile Communications, IEE, 2003.
[23] S. Sesia, I. Toufik, and M. Baker, LTE – The UMTS Long Term Evolution: From Theory to Practice, 2nd ed., Wiley, 2011.
[24] J. Medbo, P. Schramm, and A. F. Molisch, “Path loss models for urban cellular systems,” IEEE Trans. Vehicular Technology, vol. 47, no. 1, pp. 1–10, 1998.
[25] K. R. Chowdhury, M. R. Hossain, and J. A. Chambers, “Wireless signal coverage mapping using simulation,” IEEE Commun. Lett., vol. 18, no. 12, pp. 2207–2210, 2014.
[26] T. Kurner and P. J. Smith, “Channel modeling for wireless communication,” IEEE Commun. Mag, vol. 35, no. 9, pp. 84–91, 1997.
[27] A. F. Molisch, “Ultrawideband propagation channels,” Proc. IEEE, vol. 97, no. 2, pp. 353–371, 2009.
[28] R. W. Heath, T. Wu, and D. Gesbert, MIMO Wireless Communications, Cambridge University Press, 2018.
[29] P. Kyritsi and G. Papadopoulos, “Shadowing effect analysis in indoor wireless networks,” IEEE Trans. Wireless Commun., vol. 19, no. 4, pp. 2450–2461, 2020.
[30] S. Haykin, Communication Systems, 5th ed., Wiley, 2009.
You can download the Project files here: Download files now. (You must be logged in).


Responses