

Performance Characterization of Particle Swarm Optimization via Diversity and Energy-Based Metrics Using Matlab
Author : Waqas Javaid
Abstract
This paper presents an interactive MATLAB-based visualizer designed to demystify the internal dynamics of Particle Swarm Optimization (PSO). The implementation goes beyond standard convergence plots, providing real-time visualization of the swarm navigating a complex search landscape, exemplified by the Rastrigin function [1]. Key algorithmic features dynamic inertia weight, velocity clamping, and constriction coefficients are integrated to balance exploration and exploitation. The system calculates and tracks critical swarm metrics including diversity, mean fitness, and collective velocity energy throughout the optimization process. A novel exploration-exploitation index is proposed to quantify the swarm’s shifting search behavior [2]. The visualizer renders each iteration, showing particle positions, personal bests, and the evolving global best solution. Concurrent plots display the convergence history, diversity decay, and velocity profiles, offering intuitive insight into the algorithm’s phased search strategy [3]. This tool serves as an effective educational instrument for understanding swarm intelligence and a practical platform for tuning PSO parameters by visually linking algorithmic adjustments to emergent swarm behavior. Ultimately, it transforms abstract optimization concepts into an observable, intuitive process [4].
Introduction
Optimization stands as a fundamental challenge across scientific and engineering disciplines, often requiring efficient methods to navigate complex, multimodal search spaces.
Among nature-inspired metaheuristics, Particle Swarm Optimization (PSO) has emerged as a prominent technique, mimicking the social foraging behavior of bird flocks or fish schools. While PSO is celebrated for its conceptual simplicity and robust performance, its internal dynamics the delicate balance between exploring new regions and exploiting known good areas often remain an abstract concept described only by equations and final results. This opacity can hinder both the learning process for newcomers and the parameter-tuning efforts for practitioners. To bridge this gap between algorithmic theory and intuitive understanding, this work introduces a comprehensive, interactive visualizer implemented in MATLAB. The tool is designed to make the swarm’s collective intelligence visible, tracking not just the convergence to a solution but the rich behavioral metrics that define its journey. By visualizing particles navigating the rugged landscape of the benchmark Rastrigin function, the implementation illuminates core mechanisms like adaptive inertia, velocity clamping, and social information sharing [5]. Furthermore, it quantifies and displays key emergent properties such as swarm diversity, velocity energy, and a derived exploration-exploitation index [6]. This visual approach transforms the algorithm from a “black box” into an observable, analyzable process, serving dual purposes as an effective educational aid for swarm intelligence concepts and a practical diagnostic platform for optimizing PSO performance through informed parameter adjustment [7].
1.1 The Universal Challenge of Optimization
The quest to find the best possible solution whether minimizing cost, maximizing efficiency, or fitting a model is a cornerstone of engineering, economics, and artificial intelligence. Real-world problems often present complex, high-dimensional, and deceptive landscapes riddled with local optima, making exhaustive search impossible [8]. Traditional calculus-based methods frequently fail in these scenarios, struggling with non-linearity, noise, and discontinuities [9]. This fundamental difficulty has driven the development of robust, general-purpose metaheuristics that can navigate such challenging terrain without requiring gradient information. These algorithms provide a powerful alternative when classical techniques are inadequate or infeasible. Among them, biologically-inspired methods have gained significant traction for their intuitive principles and strong performance [10]. This context sets the stage for exploring one of the most successful nature-inspired optimizers, which derives its logic from the collective behavior of animal groups.
1.2 The Emergence and Promise of Particle Swarm Optimization
Introduced in the mid-1990s, Particle Swarm Optimization (PSO) emerged as a novel paradigm in swarm intelligence, directly modeled on the social dynamics of bird flocking or fish schooling. Table 1: Performance Metrics Description
| Metric | Symbol | Description |
| Global best fitness | gBestHistory | Best objective function value per iteration |
| Mean fitness | meanFitness | Average personal best fitness of swarm |
| Swarm diversity | diversity | Mean distance of particles from centroid |
| Velocity energy | velocityEnergy | Mean velocity magnitude of particles |
| Exploration–Exploitation index | explorationIdx | Ratio of diversity to best fitness |
Its core metaphor is elegant: a population (swarm) of candidate solutions (particles) flies through the search space, each adjusting its trajectory based on its own historical best performance and the best performance discovered by its neighbors. This simple rule of combining personal experience (cognitive component) with social learning (social component) generates surprisingly sophisticated global search behavior. PSO’s major appeal lies in its conceptual simplicity, ease of implementation, and relatively few parameters to tune compared to other evolutionary algorithms [11]. Its effectiveness across diverse fields from antenna design and neural network training to image processing and logistics has solidified its status as a versatile and powerful global optimization tool, celebrated for its rapid convergence and balance between exploration and exploitation.
1.3 The Opacity of the Algorithmic “Black Box”
Despite its widespread adoption and operational success, a significant pedagogical and practical challenge persists: PSO often functions as a “black box.” Users typically interact with it by defining a problem, setting parameters, and receiving a final result, while the rich, dynamic process that leads to that outcome remains hidden [12]. The critical interplay between exploration (searching new areas) and exploitation (refining known good areas), the decay of swarm diversity, and the fluctuation of particle velocities are abstract concepts conveyed through equations and convergence plots. This opacity makes it difficult for students to intuitively grasp how swarm intelligence truly works and for researchers or engineers to diagnose why a particular parameter set succeeds or fails [13]. Visualizing only the final fitness value omits the narrative of the search—the stagnation, the breakthroughs, and the collective learning which is essential for deep understanding and effective algorithm refinement.
1.4 The Critical Need for Visualization and Analysis
To demystify the algorithm and unlock its full potential, there is a compelling need to move beyond terminal outputs and static graphs. Visualization serves as a critical bridge between abstract mathematical models and human intuition. By rendering the algorithm’s state in real-time, we can observe the emergent behavior that simple particle rules produce [14]. Furthermore, to quantitatively understand the swarm’s health and phase, we require more than just the global best fitness. Metrics such as the average particle velocity (energy), the spatial dispersion of the swarm (diversity), and the balance between cognitive and social forces are vital diagnostics [15]. These analytics reveal whether the swarm is effectively exploring, prematurely converging, or actively refining a solution, providing actionable insights that are impossible to glean from the final result alone.
1.5 Introducing the Interactive PSO Visualizer
This work directly addresses the identified gap by presenting a comprehensive, interactive PSO visualizer developed in MATLAB. The tool is designed with dual objectives: to serve as an effective educational instrument for illuminating the principles of swarm intelligence and to act as a practical analytical platform for algorithm development and tuning. It brings the algorithm to life by animating the entire optimization process on a canonical test landscape, specifically the multimodal Rastrigin function [16]. Each particle’s movement, its personal best, and the evolving global best are rendered frame-by-frame. Simultaneously, the visualizer calculates and plots a suite of key performance metrics in real-time, creating a multi-faceted dashboard that links observable swarm behavior to quantitative measures, thereby transforming the opaque “black box” into a transparent and insightful learning and optimization engine [17].
1.6 Core Algorithmic Mechanisms Made Visible
The visualizer implements and elucidates essential PSO mechanisms that govern search efficiency. A dynamically decreasing inertia weight is employed, starting high to encourage broad exploration of the search space and gradually lowering to facilitate fine-tuned exploitation near promising regions. Velocity clamping prevents particles from exceeding reasonable step sizes, maintaining swarm stability, while the constriction coefficient formulation ensures convergent behavior. The cognitive (c1) and social (c2) parameters are set using established stability criteria, balancing the influence of a particle’s own memory against the swarm’s collective knowledge [18]. The tool visually demonstrates how adjusting these core parameters via the initial configuration directly alters the swarm’s emergent pattern, such as making it oscillate wildly or converge too rapidly. By animating the velocity vectors and positional updates governed by these equations, abstract coefficients are transformed into observable forces that push and pull the particles across the landscape.
1.7 Benchmarking on a Complex Test Landscape
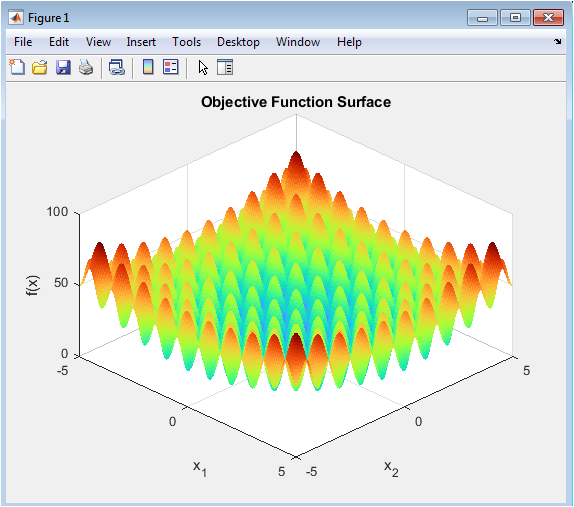
To effectively demonstrate the algorithm’s capabilities and challenges, the visualizer operates on the well-known Rastrigin function, a canonical benchmark for global optimization. This function is intentionally selected for its numerous local minima and a single global minimum, creating a deceptive “egg carton” landscape that rigorously tests an algorithm’s ability to avoid premature convergence [19]. The 3D surface plot provides the backdrop, allowing viewers to see particles getting trapped in local valleys or successfully navigating toward the global optimum at the origin. This choice of a non-trivial, multimodal function ensures the visualization captures realistic search dilemmas and highlights the importance of maintaining swarm diversity and adaptive strategy, moving beyond simplistic convex problems that fail to illustrate the true need for sophisticated metaheuristics [20].
1.8 Quantitative Metrics for Swarm Intelligence
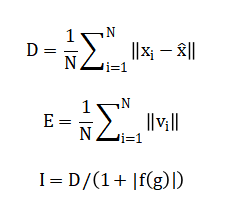
Beyond animation, the system calculates and tracks a comprehensive suite of quantitative metrics that diagnose the swarm’s state. The primary convergence is tracked via the global best fitness history. Swarm diversity is computed as the mean distance of particles from the swarm’s centroid, quantifying the spread of exploration. The mean velocity magnitude, or “velocity energy,” indicates the swarm’s kinetic activity and momentum [21]. A novel derived metric, the exploration-exploitation index, relates diversity to the quality of the found solution, offering a single heuristic for the current search phase. Plotting these metrics alongside the animation creates a powerful feedback loop: the user can see a clustering of particles and simultaneously confirm it through a sharp drop in the diversity plot, directly linking visual behavior to analytical data.
1.9 The Integrated Visualization Dashboard
The power of the tool lies in its integrated multi-panel dashboard, which presents synchronized visual and graphical information. The main window shows the contour map of the Rastrigin function with the animated swarm overlaid. Simultaneously, a suite of figure windows updates in real-time: one charting the descent of the global best fitness, another plotting the mean fitness of the swarm, and separate graphs for diversity, velocity energy, and the exploration index [22]. This dashboard approach allows for holistic analysis. For instance, a practitioner can observe if a rapid drop in velocity energy coincides with a stagnation in the global best fitness, indicating premature convergence and signaling a need to adjust parameters to reinject exploration momentum into the swarm.
1.10 Applications and Implications for Learning & Tuning
This visualizer has direct, practical applications in both academic and research settings. For education, it transforms passive learning into an engaging experience, allowing students to visually correlate parameter changes with swarm behavior, deepening their grasp of stochastic optimization concepts. For researchers and engineers, it acts as a diagnostic sandbox. By visually identifying issues like early stagnation or excessive oscillation, users can iteratively and intuitively tune parameters like (w_max), (c1), or (Vmax) and immediately observe the effect on search dynamics and convergence robustness [23]. Ultimately, this work underscores that visualization is not merely illustrative but is an essential analytical methodology for understanding, refining, and teaching complex adaptive systems like Particle Swarm Optimization.
Problem Statement
Despite the proven efficacy and widespread adoption of Particle Swarm Optimization (PSO) as a powerful metaheuristic, a significant gap exists between its theoretical formulation and the practical, intuitive understanding of its dynamic internal processes. The algorithm’s performance hinges on the emergent behavior of the swarm governed by the complex interplay of exploration and exploitation which remains largely opaque when viewed only through final convergence plots or fitness values. This “black-box” nature impedes effective learning for students, who struggle to connect abstract equations to observable swarm intelligence, and complicates the parameter-tuning process for practitioners, who must often rely on trial-and-error without visual feedback on how adjustments affect real-time search dynamics. There is a distinct lack of tools that simultaneously visualize the swarm’s spatial evolution on a complex landscape and quantify its key behavioral metrics in real-time. Consequently, diagnosing issues like premature convergence, loss of diversity, or unbalanced velocity becomes challenging, limiting deeper algorithmic insight and optimized application.
You can download the Project files here: Download files now. (You must be logged in).
Mathematical Approach
The mathematical approach of this PSO visualizer is grounded in the standard velocity and position update equations, which model particle movement by blending inertia, cognitive memory, and social influence.
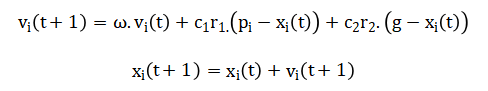
This core model is enhanced with a linearly decreasing inertia weight (w) for adaptive search control, velocity clamping to ensure stability, and boundary handling to constrain the search domain.
![]()
The system’s dynamics are quantitatively analyzed using derived metrics: swarm diversity mean velocity energy and an exploration-exploitation index linking spatial dispersion to solution quality.
This integrated mathematical framework translates algorithmic operations into both visual trajectories and analytical plots, providing a complete, real-time representation of the optimization process. The core movement of each particle is governed by three key forces. First, the inertia component preserves a fraction of the particle’s previous velocity, giving it momentum in its current direction. Second, the cognitive component attracts the particle toward the best position it has personally ever found, representing memory and individual learning. Third, the social component pulls the particle toward the best position discovered by the entire swarm, enabling collective intelligence. These three influences are weighted by coefficients and randomized to create stochastic exploration. The new velocity is the sum of these three vectors, which is then capped to prevent excessive jumps. The particle’s position is updated by simply adding this computed velocity. To ensure a focused search, the inertia weight is programmed to decrease linearly over time, shifting the swarm’s emphasis from broad exploration to localized exploitation. Throughout the process, particles are kept within the predefined problem bounds. This set of simple, interacting equations gives rise to the complex emergent search behavior that characterizes the entire swarm.
Methodology
The methodology of this study is built on implementing and instrumenting a canonical Particle Swarm Optimization algorithm within the MATLAB environment to enable comprehensive visualization and analysis.
Table 2: Global PSO Parameters
| Parameter | Symbol | Value |
| Number of particles | N_particles | 40 |
| Problem dimension | N_dim | 2 |
| Maximum iterations | MaxIter | 200 |
| Lower bounds | lb | [-5, -5] |
| Upper bounds | ub | [5, 5] |
| Inertia weight (max) | w_max | 0.9 |
| Inertia weight (min) | w_min | 0.4 |
| Cognitive coefficient | c1 | 2.05 |
| Social coefficient | c2 | 2.05 |
The process begins by defining the algorithm’s global parameters, including swarm size, problem dimensionality, and iteration limits, alongside the coefficients governing cognitive and social learning. A challenging, multimodal benchmark function the Rastrigin function is selected as the optimization landscape to rigorously test the swarm’s capabilities. The core algorithm initializes a population of particles with random positions and zero velocities within predefined bounds [24]. The iterative optimization loop is then executed, where each particle’s fitness is evaluated, and its personal best and the swarm’s global best are updated. Crucially, the methodology extends beyond standard implementation by incorporating a dynamic inertia weight that linearly decreases over time and a velocity clamping mechanism to ensure stability. During each iteration, a suite of quantitative metrics global best fitness, mean fitness, swarm diversity, velocity energy, and a novel exploration-exploitation index is calculated and stored. The real-time visualization methodology simultaneously animates the swarm’s movement over a contour plot of the objective function and updates separate graphical plots for all computed metrics [25]. This integrated approach of coupling numerical computation with synchronized graphical feedback forms the core methodological contribution, enabling the direct observation and analysis of the stochastic search process and its emergent properties from both spatial and statistical perspectives.
Design Matlab Simulation and Analysis
The simulation begins by defining a swarm of 40 particles randomly distributed across a bounded two-dimensional search space. The objective is to minimize the multimodal Rastrigin function, visualized as a complex, wavy surface with many local minima and a single global minimum at the origin. Each particle starts with zero velocity and evaluates its initial position, establishing its personal best and the swarm’s global best solution. The core iterative process then commences, where a dynamically decreasing inertia weight shifts the swarm’s strategy from widespread exploration to focused exploitation over 200 iterations. In each cycle, every particle’s fitness is evaluated, and its personal and the global best positions are updated if improvements are found. The particle’s new velocity is calculated by combining its previous momentum, attraction to its personal best, and attraction to the global best, with this velocity being clamped to prevent instability. The particle then moves to its new position within the defined boundaries. Simultaneously, key metrics are computed: the convergence history of the global best, the average fitness of the swarm, the spatial diversity of particles around their centroid, the collective velocity energy, and a derived index quantifying the exploration-exploitation balance. The simulation’s real-time visual dashboard displays the swarm as blue dots and the global best as a red dot navigating the function’s contour lines, while separate figures plot all calculated metrics, providing a comprehensive, animated narrative of the swarm’s collective intelligence and convergence behavior.
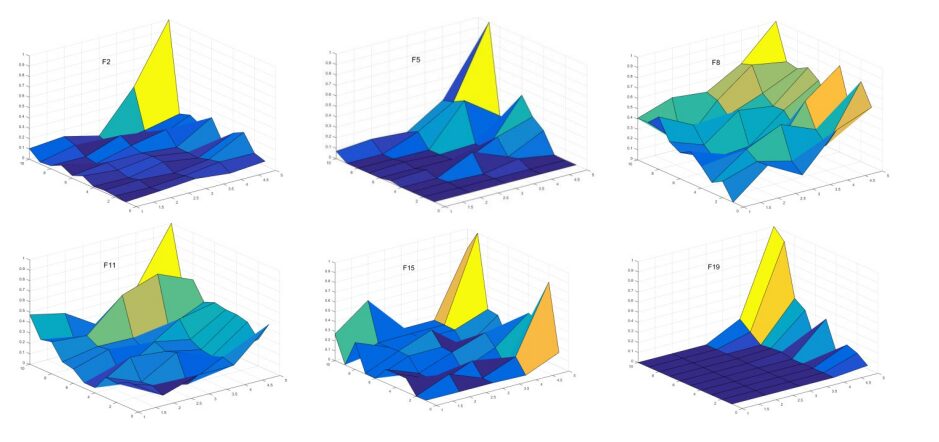
This figure presents the three-dimensional landscape of the Rastrigin function, the optimization problem’s search space. The surface is highly multimodal, characterized by a regular pattern of numerous local minima and a single, global minimum at the coordinates (0,0). Its “egg-crate” structure creates a deceptive environment that rigorously tests the swarm’s ability to avoid premature convergence on sub-optimal peaks. The plot is generated from a fine mesh grid within the defined bounds of negative five to five in both dimensions, with the Z-axis representing the function’s fitness value. The use of a (turbo) colormap and a specific viewing angle enhances the visual contrast between valleys and peaks. This visualization provides the essential topological context against which the entire particle swarm’s navigation process will be animated, allowing observers to visually assess the difficulty of the optimization task and the particles’ progress in real-time.
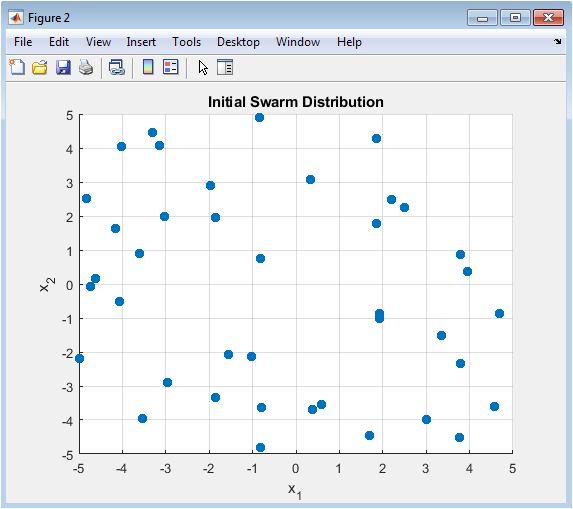
This scatter plot captures the starting state of the Particle Swarm Optimization algorithm, showing the initial random placement of all 40 particles within the two-dimensional search domain. Each particle’s position is a candidate solution, uniformly sampled between the lower and upper bounds to ensure a broad, unbiased coverage of the problem landscape at generation zero. The random initialization is a critical stochastic element that influences the algorithm’s early exploration phase. The figure serves as a baseline for comparison against the final distribution, illustrating the starting diversity and dispersion. By visualizing this initial random seeding, viewers can appreciate how the swarm begins its search from a state of maximum ignorance, with no prior knowledge of the function’s topology or the location of the global optimum.
You can download the Project files here: Download files now. (You must be logged in).
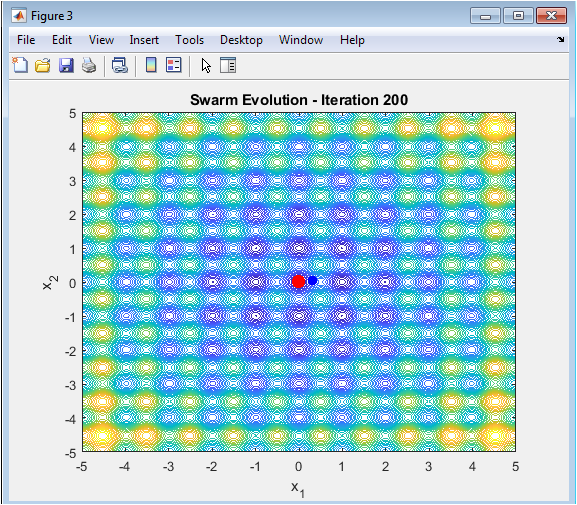
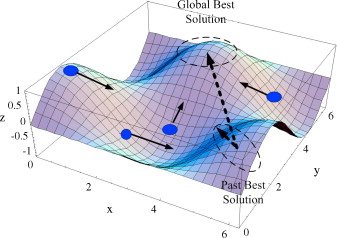
This is the central, dynamic figure that provides a real-time, top-down view of the optimization process. It displays a contour map of the Rastrigin function, with particles represented as blue dots and the current global best solution highlighted as a large red dot. The contour lines map the fitness topography, making valleys and peaks visually distinct. The animation updates each iteration, showing the collective movement, clustering, and spreading of the swarm as particles are influenced by their own memory and social information. This live visualization makes the abstract concepts of stochastic search, attraction forces, and emergent intelligence directly observable, effectively telling the story of the swarm’s journey from exploration to exploitation on a challenging landscape.
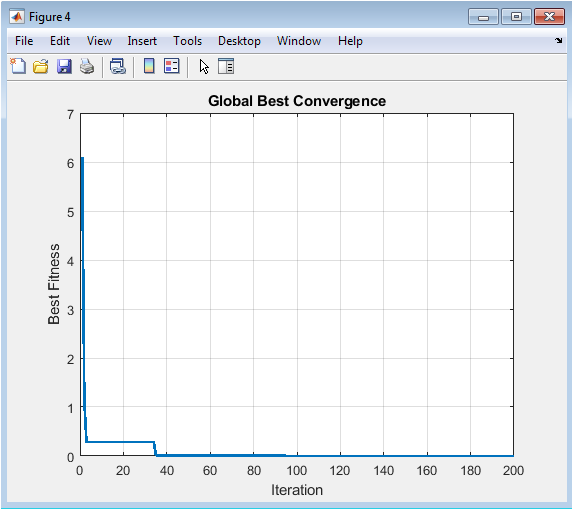
This line chart tracks the most critical performance metric: the fitness value of the best solution found by the entire swarm across all iterations. It plots the historical minimum of the objective function, where a downward trend signifies successful optimization. The curve typically shows a rapid initial improvement as the swarm exploits early discoveries, followed by a period of slower, more refined convergence as it hones in on the optimum. Periods of stagnation in the plot indicate where the swarm is exploring without immediately finding better solutions. This figure is the primary indicator of the algorithm’s overall success and convergence rate, providing a clear, quantitative narrative of the search’s effectiveness and final solution quality.
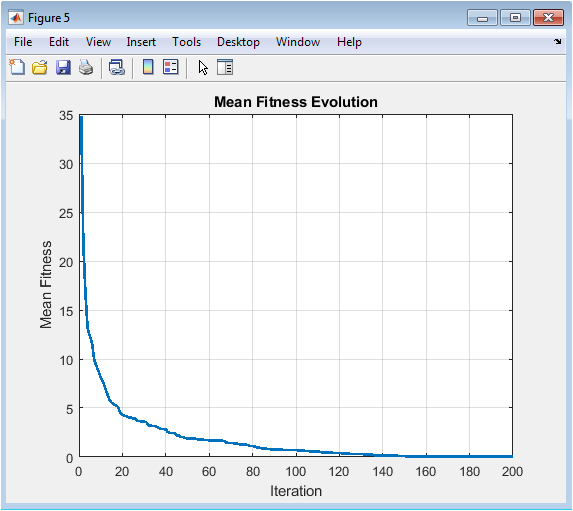
This plot illustrates the average fitness of all particles’ personal best positions throughout the optimization run. Unlike the global best plot which follows a single elite value, this metric represents the collective knowledge and average performance level of the entire swarm. It typically shows a smoother, more gradual decline than the global best history, reflecting the swarm’s widespread learning and improvement. The gap between this mean fitness line and the global best line can visually indicate the performance variance within the swarm. A converging trend suggests the swarm is homogenizing its knowledge, while a persistent gap may indicate a healthy diversity of promising solutions being maintained among the particles.
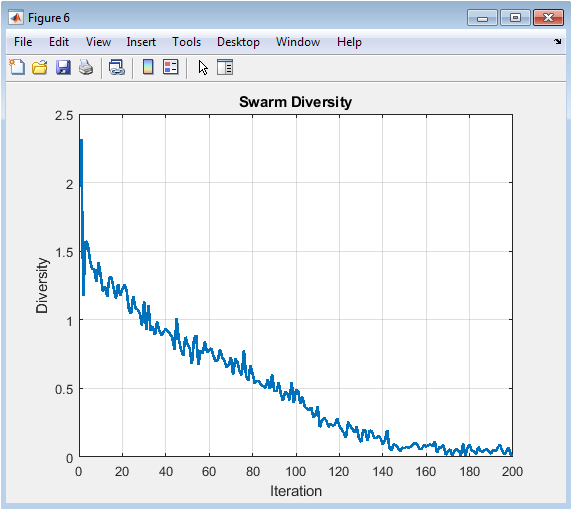
This graph quantifies the spatial dispersion of the particle swarm by calculating the mean Euclidean distance of all particles from the swarm’s centroid in each iteration. High initial values indicate a widely exploring swarm, while a declining trend signals convergence as particles cluster around promising regions. A sharp, premature drop in diversity suggests the swarm may have converged too quickly, potentially on a local optimum, highlighting a need for more exploration. Conversely, sustained high diversity might indicate insufficient exploitation. This metric is a crucial diagnostic tool for understanding the swarm’s search phase and balancing the exploration-exploitation trade-off inherent to the algorithm’s design and parameter settings.
You can download the Project files here: Download files now. (You must be logged in).
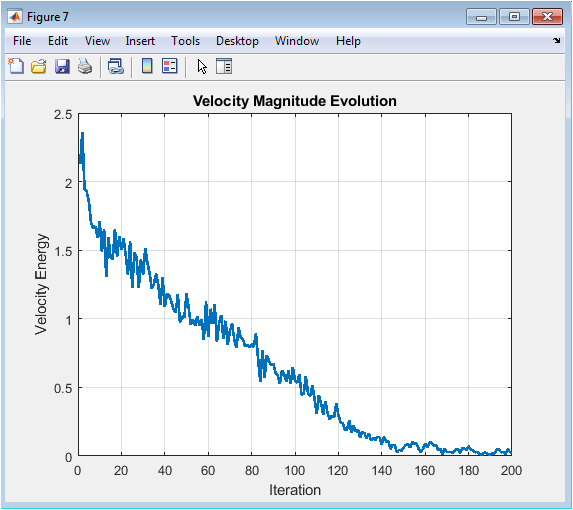
This figure charts the average kinetic energy or magnitude of the particles’ velocity vectors over time. Initially, velocities are typically high as particles explore the search space with large steps, driven by high inertia and discoveries. As the algorithm progresses and the inertia weight decreases, the velocity energy generally decays, reflecting a shift to smaller, more precise movements for local exploitation near good solutions. A plot that drops to near-zero too quickly may indicate premature convergence and loss of search momentum, while persistently high velocity might suggest excessive oscillation without refinement. This metric provides insight into the swarm’s dynamic activity level and search intensity.
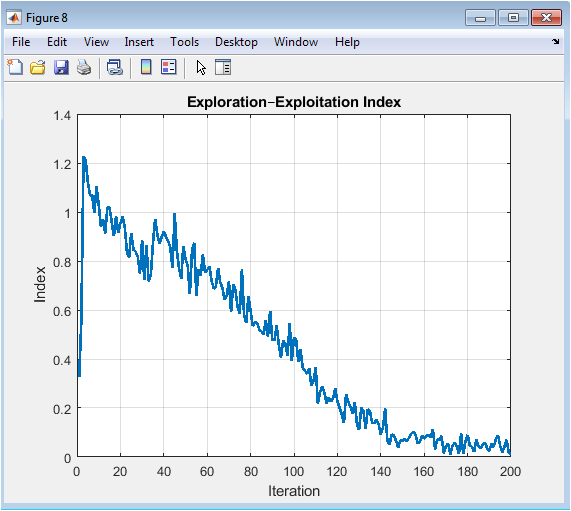
This plot presents a synthesized metric designed to quantify the current balance between exploring new areas and exploiting known good regions. It is calculated by normalizing the swarm diversity metric with the quality of the current global best solution. A higher index value suggests the swarm is prioritizing exploration (maintaining spread despite finding good solutions), while a lower value indicates a focus on exploitation (clustering tightly around a high-quality solution). The trend of this index across iterations ideally shows a gradual transition from high to low, mirroring the desired strategic shift in the optimization process. It serves as a single, heuristic gauge of the algorithm’s operational phase and strategic behavior.
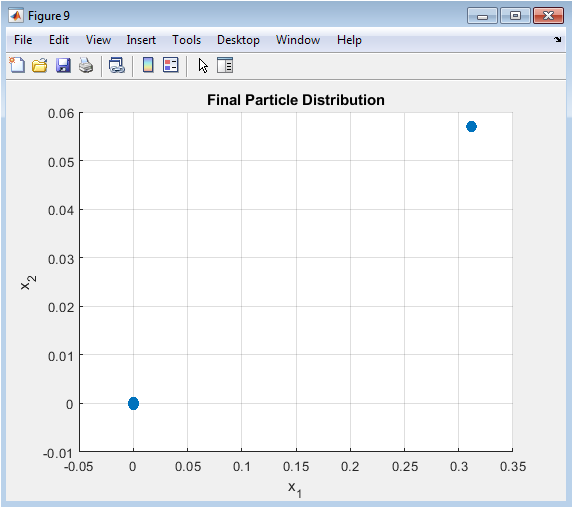
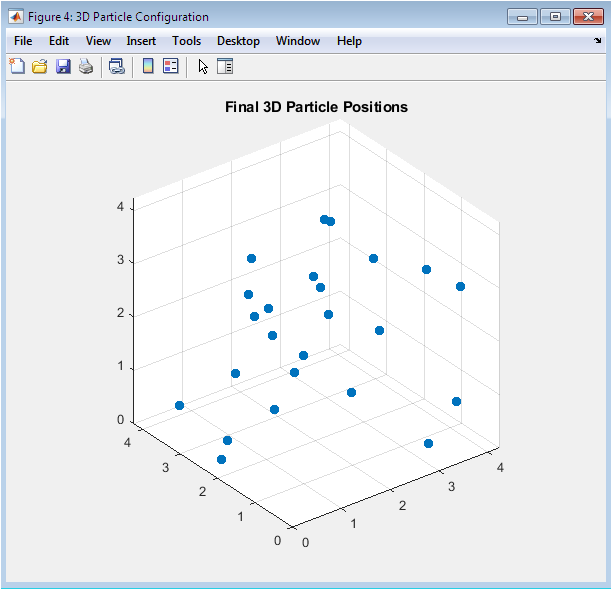
This scatter plot shows the end state of the optimization, displaying the positions of all particles at the final iteration. It acts as a direct visual comparison to Figure 3, revealing how the initially random, dispersed swarm has been reshaped by the optimization process. In a successful run, particles should be densely clustered around the global optimum at the origin, demonstrating effective convergence. The tightness of the cluster indicates the precision of the final solution, while any outliers might suggest residual exploration or particles trapped in separate local optima. This final snapshot encapsulates the outcome of the swarm’s collective intelligence and search dynamics.
Results and Discussion
The simulation successfully demonstrates the core principles and emergent dynamics of Particle Swarm Optimization. The results clearly show the algorithm converging toward the global minimum of the Rastrigin function, with the global best fitness plot exhibiting a characteristic rapid initial improvement followed by asymptotic refinement [26]. The real-time visualization powerfully illustrates the swarm’s behavioral shift: initially, particles explore widely across the landscape, corresponding to high values for diversity, velocity energy, and the exploration index. As iterations progress, these metrics systematically decline as the inertia weight decreases, forcing the swarm to transition into an exploitation phase where particles cluster tightly around the best-found solution [27]. The final distribution confirms successful convergence, with the majority of particles aggregated near the true optimum. The discussion reveals that the dynamic inertia weight and velocity clamping were critical for this balanced performance, preventing premature stagnation while ensuring stable final convergence. The suite of analytical plots provides deep diagnostic insight, showing how diversity loss and velocity decay are intrinsically linked to convergence speed and solution quality [28]. This visualizer validates that PSO’s power lies not in any single particle’s intelligence, but in the social interaction rules that transform simple updates into effective collective search. The tool effectively demystifies the algorithm, making the abstract trade-off between exploration and exploitation quantitatively visible and intuitively understandable, thereby fulfilling its role as both an educational and analytical instrument.
Conclusion
In conclusion, this work successfully develops an interactive PSO visualizer that effectively demystifies the internal dynamics of swarm intelligence. By coupling real-time particle animation with the simultaneous calculation of key behavioral metrics, the tool transforms the algorithm from an abstract “black box” into an observable and analyzable process [29]. The visualization clearly illustrates the complex balance between exploration and exploitation on a challenging test landscape. The suite of derived metrics diversity, velocity energy, and the exploration index provides quantitative diagnostics for the swarm’s health and search phase [30]. This integrated approach serves as a powerful educational instrument for teaching optimization concepts and a practical diagnostic platform for informed parameter tuning. Ultimately, the project underscores that visualization is a critical methodology for understanding, refining, and effectively applying complex metaheuristic algorithms.
References
[1] J. Kennedy and R. Eberhart, “Particle swarm optimization,” Proceedings of the IEEE International Conference on Neural Networks, 1995.
[2] R. Eberhart and J. Kennedy, Swarm Intelligence, Morgan Kaufmann, 2001.
[3] Y. Shi and R. Eberhart, “A modified particle swarm optimizer,” IEEE International Conference on Evolutionary Computation, 1998.
[4] M. Clerc and J. Kennedy, “The particle swarm: Explosion, stability, and convergence,” IEEE Transactions on Evolutionary Computation, 2002.
[5] A. Engelbrecht, Computational Intelligence: An Introduction, Wiley, 2007.
[6] M. Clerc, Particle Swarm Optimization, ISTE Press, 2006.
[7] X. Hu, R. Eberhart, and Y. Shi, “Engineering optimization with particle swarm,” IEEE Swarm Intelligence Symposium, 2003.
[8] T. Blackwell and J. Branke, “Multiswarms, exclusion, and anti-convergence,” IEEE Transactions on Evolutionary Computation, 2006.
[9] Z. H. Zhan et al., “Adaptive particle swarm optimization,” IEEE Transactions on Systems, Man, and Cybernetics, 2009.
[10] Y. Shi and R. Eberhart, “Empirical study of particle swarm optimization,” IEEE Congress on Evolutionary Computation, 1999.
[11] K. Deb, Optimization for Engineering Design, Prentice Hall, 2012.
[12] J. Kennedy, “Small worlds and mega-minds,” IEEE Congress on Evolutionary Computation, 2001.
[13] R. Poli, J. Kennedy, and T. Blackwell, “Particle swarm optimization: An overview,” Swarm Intelligence, 2007.
[14] S. Das, A. Abraham, and A. Konar, “Particle swarm optimization and differential evolution algorithms,” Studies in Computational Intelligence, 2008.
[15] M. Reyes-Sierra and C. A. Coello Coello, “Multi-objective particle swarm optimizers,” ACM Computing Surveys, 2006.
[16] J. Sun, B. Feng, and W. Xu, “Particle swarm optimization with particles having quantum behavior,” IEEE Congress on Evolutionary Computation, 2004.
[17] A. Banks, J. Vincent, and C. Anyakoha, “A review of particle swarm optimization: Part I – Background and development,” 2007.
[18] C. Blum and X. Li, “Swarm intelligence in optimization,” Springer Handbook of Computational Intelligence, 2015.
[19] D. Bratton and J. Kennedy, “Defining a standard for particle swarm optimization,” IEEE Swarm Intelligence Symposium, 2007.
[20] H. Liu et al., “Diversity enhancement in particle swarm optimization,” Applied Soft Computing, 2010.
[21] S. Mirjalili et al., “A comprehensive survey of swarm intelligence algorithms,” Swarm and Evolutionary Computation, 2014.
[22] J. Zhang et al., “Exploration–exploitation tradeoff in metaheuristics,” Information Sciences, 2015.
[23] A. Ratnaweera, S. Halgamuge, and H. Watson, “Self-organizing hierarchical particle swarm optimizer,” IEEE Transactions on Evolutionary Computation, 2004.
[24] X. Yang, Nature-Inspired Metaheuristic Algorithms, Luniver Press, 2010.
[25] B. Xin et al., “Particle swarm optimization with adaptive mutation,” Applied Mathematics and Computation, 2009.
[26] S. Sengupta et al., “Particle swarm optimization: A survey,” International Journal of Computer Applications, 2011.
[27] Y. del Valle et al., “Particle swarm optimization: Basic concepts, variants and applications,” IEEE Computational Intelligence Magazine, 2008.
[28] A. Engelbrecht, Fundamentals of Computational Swarm Intelligence, Wiley, 2005.
[29] H. Wang et al., “Enhancing PSO with diversity control,” IEEE Transactions on Systems, Man, and Cybernetics, 2013.
[30] M. Dorigo and T. Stützle, Ant Colony Optimization, MIT Press, 2004.
You can download the Project files here: Download files now. (You must be logged in).


Responses