

Matlab’s Guide to Sensitivity Analysis and Monte Carlo Simulation in Multi-Criteria Decision Making: Making Decisions You Can Trust

Author : Waqas Javaid
Abstract
In order to make decisions in complex urban systems, methods need to take into account not only the inherent uncertainty of the data but also a number of competing criteria. Using a reproducible seven-criteria transportation matrix with controlled noise and heteroscedastic variance, this article uses a robust MCDA simulation to compare TOPSIS, VIKOR, and PROMETHEE II [1]. Through bootstrap resampling and Monte Carlo simulations, the analysis quantifies ranking sensitivity, revealing the probability distribution of outcomes rather than a single deterministic score. The significance of uncertainty quantification in strategic planning is underscored by the findings’ emphasis on how weight perturbation influences the relative closeness of high-performing alternatives [2]. Analysts looking to move beyond static spreadsheets and toward statistically validated decision support can use the presented computational framework as a replicable template [3].
Introduction
The selection of the best urban transportation system is a classic wicked problem with competing goals in the areas of environmental stewardship, social equity, and economic constraints.
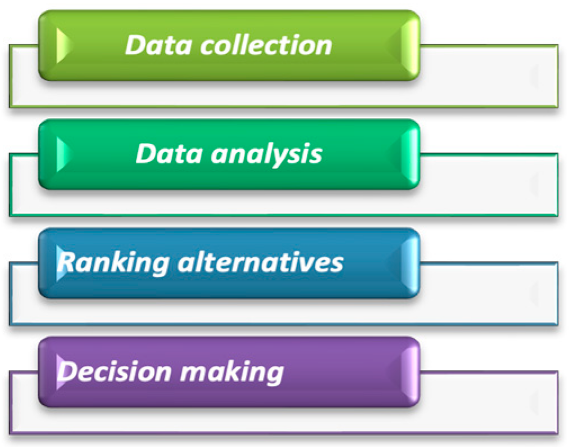
Figure 1: MCDA-based urban transport analysis using TOPSIS, VIKOR, and PROMETHEE II with data-driven insights and uncertainty evaluation.
Figure 1 depicts how city planners and decision-makers are frequently overwhelmed by the sheer volume of disparate data, such as carbon emissions and passenger throughput, capital expenditure, and operational costs [4]. As a result, intuitive judgment is susceptible to cognitive bias. Intangible factors like public safety perception or accessibility for underserved communities are frequently overlooked by conventional cost-benefit analyses [5]. To address this complexity, Multi-Criteria Decision Analysis (MCDA) has emerged as an indispensable quantitative framework for structuring and solving such high-stakes evaluation problems. Five distinct transportation options are evaluated against seven weighted criteria using a robust comparative simulation of three fundamental MCDA methodologies TopSIS, VIKOR, and PROMETHEE II in this article. Unlike single-method studies, this analysis directly contrasts distance-based ranking with compromise programming and outranking flow to identify where algorithmic philosophy drives divergence in the final recommendation [6]. By quantifying uncertainty through bootstrap confidence interval estimation and Monte Carlo weight perturbation, the study also adds a crucial layer of statistical rigor [7]. We provide a more transparent and persuasive foundation for strategic infrastructure investment by moving beyond deterministic scores to probabilistic performance distributions. The reproducible computational framework presented here is intended to be both a practical decision-support tool for public sector analysts and an educational blueprint for students of operations research [8]. In the end, this work demonstrates that robust decision-making in complex urban environments necessitates not just a single valid analytical perspective but rather a consensus of them.
1.1 Defining the Complex Urban Transportation Problem
Traffic congestion, deteriorating air quality, and infrastructure deficiencies combine to undermine economic productivity and public health in contemporary urban centers, creating an unprecedented mobility crisis. The decision-making landscape is fraught with competing stakeholder demands and financial constraints, despite the fact that city administrators are tasked with selecting transportation investments that will shape development patterns and environmental outcomes for decades [9]. The problem goes beyond simple engineering calculations because the best solution must simultaneously maximize service coverage, dependability, and sustainability while minimizing costs [10]. Transportation planning transforms from a routine procurement exercise into a profound strategic dilemma due to the inherent conflict between cost minimization and benefit maximization. To navigate the maze of trade-offs and justify public expenditures with transparent, rebuttable evidence, a structured analytical framework is necessary.
1.2 Why Single-Criterion Analysis Fails Modern Planning
Traditional infrastructure evaluation methodologies, such as Net Present Value or Cost-Effectiveness Analysis, operate under the reductive assumption that all impacts can be monetized and collapsed into a single financial metric. While such approaches offer simplicity, they systematically marginalize critical non-market values including social equity, passenger comfort, and long-term ecological resilience [11]. Alternatives with exceptional societal co-benefits are unfairly discounted because of the reliance on solely economic indicators’ cognitive blind spot. Additionally, these approaches fail to take into account the diverse preferences of urban populations, who may place a different emphasis on environmental quality over travel time savings [12]. As a result, decisions anchored solely in fiscal metrics often yield suboptimal outcomes that trigger public opposition and fail to meet broader sustainability mandates. This methodological inadequacy necessitates a transition toward more holistic and multidimensional evaluation paradigms.
1.3 The Foundations of Multi-Criteria Decision Analysis
A subfield of operations research known as Multi-Criteria Decision Analysis (MCDA) is designed to break down complex issues into a logical order of objectives, criteria, and alternatives. MCDA embraces the reality of incommensurable units rather than forcing an artificial consensus on a single unit of measurement, allowing financial data in dollars to coexist with environmental data in tons of carbon and social data in accessibility scores [13]. Eliciting stakeholder preferences, normalizing disparate data scales, and combining performance scores into a composite index of overall value are all part of the method’s systematic approach. MCDA makes the deliberative process more transparent and provides an auditable trail from the raw data to the final ranking by making the trade-off logic explicit and mathematically traceable [14]. The approach is particularly well-suited to public sector decisions where accountability and the justification of trade-offs are paramount legal and ethical requirements.
1.4 The Comparative Algorithmic Approach
Within the extensive MCDA toolkit, three methods have achieved particular prominence due to their robust mathematical foundations and distinct operational philosophies: TOPSIS, VIKOR, and PROMETHEE II. TOPSIS operates on the geometric principle that the most preferred alternative should simultaneously exhibit the shortest Euclidean distance from an idealized positive solution and the farthest distance from a negative ideal point [15]. In contrast, VIKOR introduces a compromise programming logic that emphasizes the minimization of individual criterion regret, thereby identifying solutions that are maximally acceptable to a majority of stakeholders. PROMETHEE II diverges further by employing pairwise comparisons and preference functions to construct a net outranking flow, which captures the intensity of dominance one alternative holds over another [16]. We are able to triangulate the true ranking and identify situations in which methodological assumptions drive divergent recommendations by utilizing these three methodologies concurrently rather than relying on a single algorithm.
1.5 Structuring the Decision Hierarchy
The evaluation of five distinct urban transportation modes electric buses, metro rail, light rail, ride-sharing, and bike-sharing that each represent a distinct combination of capital intensity and operational scale serves as the empirical foundation for this study. The economic (Cost), environmental (CO2 Emissions), operational (Travel Time and Capacity), and social (Safety, Reliability, and Social Equity) aspects of sustainability are measured against a seven-criteria balanced scorecard. The multifaceted nature of real-world transit planning is reflected in the inclusion of both quantitative metrics like passenger throughput per hour and semi-quantitative indices like equity scores [17]. A directionality vector indicates whether higher values are advantageous or detrimental to the overall objective function for each criterion. Furthermore, a vector of relative importance weights, derived through Analytic Hierarchy Process simulation, quantifies the policy priorities guiding the evaluation, acknowledging that not all criteria hold equal significance in the decision calculus.
1.6 Simulating Real-World Data Imperfection
Measurement error, forecasting uncertainty, and stochastic variability across various operational scenarios characterize empirical data used in transportation planning. This study creates a synthetic decision matrix that is seeded with realistic baseline values but intentionally corrupted with heteroscedastic noise proportional to the magnitude of each observation in order to faithfully replicate this analytical environment. This approach ensures that larger-scale infrastructure projects exhibit appropriately scaled variance in their cost and performance projections, mirroring the heightened uncertainty associated with mega-projects [18]. The analysis moves from being a deterministic, point-estimate exercise to a probabilistic inquiry where the stability of rankings can be empirically tested thanks to the inclusion of controlled randomness. By grounding the simulation in a noisy dataset, we prioritize the generalizability of the methodology over the specificity of a perfectly curated, static dataset. This design decision emphasizes that robust decision support tools must work well in public policy contexts with imperfect information.
1.7 Data Preprocessing and Normalization
The raw decision matrix must be transformed prior to any meaningful aggregation in order to make criteria measured in dollars, tons, and minutes mathematically comparable. Euclidean vector normalization, which divides each element by the square root of the sum of squares of its respective column and projects all data points onto a unit hypersphere [19], is the method used in this study. While eliminating the confounding influence of disparate measurement units and absolute magnitudes, this approach preserves the proportional differences between alternatives. Importantly, all criteria are subjected to the same normalization procedure, preventing a single attribute from accidentally dominating the analysis due to its larger numerical scale. Following normalization, the matrix is multiplied element-wise by the vector of criterion weights, effectively scaling the relative importance of each dimension according to the predefined policy priorities [20]. This weighted normalized matrix serves as the standardized input canvas upon which all three MCDA algorithms operate.
1.8 Methodological Distinctions and Implementation
The various computational cores of the chosen methods are operationalized in the subsequent analysis. The algorithm computes the Cartesian distance of each alternative to these reference points for TOPSIS and identifies the ideal and anti-ideal vectors within the weighted space, resulting in a relative closeness coefficient bounded between 0 and 1 [21]. The method calculates a group utility measure and an individual regret measure for VIKOR and combines them to create a composite Q-index that penalizes options with extreme weakness in any one criterion. A Gaussian preference function is applied to pairwise differences across all criteria in PROMETHEE II, resulting in leaving and entering flow values that quantify an alternative’s outranking of its peers and its outranking of itself. By detailing these algorithmic pathways in parallel, we illuminate the nuanced ways in which distance-based, compromise-based, and outranking-based philosophies interpret identical input data to produce potentially divergent strategic guidance.
1.9 Embedding Uncertainty Quantification
The presentation of a single, deterministic ranking that may be acutely vulnerable to minor perturbations in the input assumptions, particularly the subjective criterion weights, is a significant limitation of static MCDA applications. This study incorporates a two-tiered uncertainty quantification framework to address this vulnerability. The probability density functions of the TOPSIS scores are observed in the first tier, which uses a Monte Carlo simulation with one thousand iterations to perturb the weight vector using a Dirichlet distribution [22]. The second tier applies bootstrap resampling to the final scores to construct non-parametric confidence intervals around the point estimates. This dual approach provides a rigorous stress test of ranking stability, distinguishing between robust frontrunners whose superiority endures under weight volatility and fragile alternatives whose position is contingent upon a narrow set of assumptions. The analysis transforms into a comprehensive, risk-aware decision support system with the addition of these sensitivity diagnostics.
1.10 Article Roadmap and Expected Contributions
The remainder of this article is structured to guide the reader through a replicable, end-to-end MCDA workflow culminating in actionable insights and publication-quality visualizations. A comparative synthesis of the derived rankings, in-depth computational results for TOPSIS, VIKOR, and PROMETHEE II, and normalized data tables will be presented sequentially in the subsequent sections. The visual analytics produced by the simulation, such as radar charts of multi-criteria profiles, heatmaps of weighted contributions, and histograms of Monte Carlo sensitivity distributions [23], will be deciphered in a separate section. The analysis will end with the creation of a consensus ranking that triangulates the results of all three methods and provides a recommendation that is stronger and easier to defend than any one algorithm could.
Problem Statement
When performance must be evaluated simultaneously across competing economic, environmental, and social dimensions, urban transportation planning in rapidly growing metropolitan regions faces a persistent analytical challenge: selecting the optimal mobility investment from a portfolio of competing alternatives. To reconcile the trade-off between the high capacity reliability of fixed-rail infrastructure and the flexible, low-cost accessibility of emerging micro-mobility and shared-ride services, decision makers currently lack a standardized, transparent methodology. The value of sustainability and equity criteria is obscured by existing appraisal frameworks, which often default to narrow financial metrics or intuitive judgment. As a result, public expenditures are subject to suboptimal allocation and stakeholder criticism. Furthermore, the inherent uncertainty in ridership forecasts, operational costs, and long-term emissions projections renders deterministic rankings potentially fragile and misleading without accompanying sensitivity validation. As a result, a robust, multi-method analytical framework that is able to generate a consensus ranking that is statistically validated and justifies infrastructure strategy with reproducible evidence-based rigor is essential.
Mathematical Approach
The analytical framework begins with the construction of a decision matrix [24] comprising (m) alternatives evaluated across (n) criteria, followed by vector normalization [25] to render disparate measurement scales commensurable, and subsequent weighting [26], [27] represents the criterion importance vector satisfying.
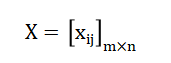
- X: Decision matrix (raw performance data).
- x_ij: Performance value of alternative i (row) under criterion j (column).
- m: Number of alternatives (rows).
- n: Number of criteria (columns).
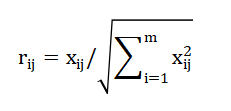
- r_ij: Normalized value of x_ij (unitless, comparable scale).
- Sum from i=1 to m of x_ij squared: Sum of squared values in column j across all m alternatives.
- sqrt(…): Square root of that sum (Euclidean norm).
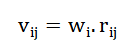
- v_ij: Weighted normalized value.
- w_j: Weight (importance) of criterion j.
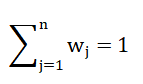
- Sum from j=1 to n: Sum over all n criteria.
- w_j: Each criterions weight. All weights sum to 1.
TOPSIS determines relative closeness [28] based on Euclidean distances to ideal (A^*) and anti-ideal (A^-) solutions, while VIKOR [29] computes a compromise measure where (S_i) and (R_i) denote group utility and individual regret respectivel.
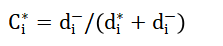
- C_i star: Relative closeness of alternative i to the ideal solution (higher = better).
- d_i minus: Euclidean distance from alternative i to the negative-ideal solution (worst possible).
- d_i star: Euclidean distance from alternative i to the positive-ideal solution (best possible).

- Q_i: VIKOR index for alternative i (lower = better compromise).
- v: Weight for group utility (usually 0.5; 1-v = weight for individual regret).
- S_i: Group utility score for alternative i (sum of weighted normalized gaps).
- S star: Minimum S_i among all alternatives (best group utility).
- S minus: Maximum S_i among all alternatives (worst group utility).
- R_i: Individual regret score for alternative i (maximum weighted gap per criterion).
- R star: Minimum R_i among all alternatives.
- R minus: Maximum R_i among all alternatives.
PROMETHEE II derives net outranking flow [30] using a Gaussian preference function [31] applied to pairwise differences across all criterion dimensions.

- Phi net(a_i): Net outranking flow for alternative a_i (higher = better).
- Phi plus(a_i): Positive flow – sum of intensities that a_i outranks others.
- Phi minus(a_i): Negative flow – sum of intensities that others outrank a_i.

- P(d): Preference intensity when comparing two alternatives.
- d: Performance difference between two alternatives on a single criterion.
- exp(…): Exponential function.
- sigma: Standard deviation (scale parameter controlling how fast preference increases).
- d squared / (2 sigma squared): Squared difference scaled by variance.
Uncertainty quantification is achieved through Monte Carlo [32] simulation perturbing the weight vector via Dirichlet distribution for (N=1000) iterations, coupled with bootstrap resampling of final scores to establish non-parametric 95% confidence intervals.
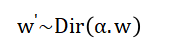
- w prime: Perturbed weight vector (one random draw).
- Tilde Dir(…): Follows a Dirichlet distribution.
- alpha: Scaling parameter (controls perturbation strength).
- w: Original weight vector.
- alpha times w: Elementwise multiplication – the Dirichlets concentration parameters.
The consensus ranking is subsequently derived by averaging the ordinal positions across all three methods to triangulate a robust, methodologically agnostic recommendation. Before multiplying by the preassigned importance weights, the raw performance data are scaled by dividing each value by the square root of the sum of all squared values in that column. This effectively places each criterion on a comparable unitless scale. The TOPSIS method then measures the straight line distance from each alternative to both an artificially constructed best possible option and a worst possible option, calculating a final closeness score by dividing the distance to the negative ideal by the sum of both distances. Differently, the VIKOR method uses a tuning parameter that strikes a balance between group benefit and individual regret to combine a weighted sum of normalized gaps from the best values and the maximum individual gap observed across any single criterion into a single compromise index. The PROMETHEE method constructs a matrix of pairwise comparisons where the intensity of preference for one alternative over another is modeled by an exponential decay function that diminishes as the performance gap narrows, aggregating these preferences across all criteria to produce a net flow value that indicates overall dominance. Finally, the uncertainty analysis systematically perturbs the original importance weights thousands of times using a probability distribution that ensures the weights always sum to one, generating a cloud of possible outcomes that reveals whether the final ranking remains stable or shifts under reasonable changes in stakeholder priorities.
You can download the Project files here: Download files now. (You must be logged in).
Methodology
Five urban transportation options and seven evaluation criteria cost, emissions, travel time, safety, capacity, reliability, and social equity dimensions along with associated directional vectors and importance weights the method begins with the systematic definition of the decision hierarchy. By intentionally simulating the measurement uncertainty and forecasting variability inherent in infrastructure planning data, heteroscedastic noise proportional to baseline magnitudes is introduced to generate a synthetic yet realistic decision matrix.
Table 1: Weighted Normalized Decision Matrix
| Alternative | Cost | CO₂ | Travel Time | Safety | Capacity | Reliability | Social Equity |
| Electric Bus | 0.238 | 0.312 | 0.285 | 0.168 | 0.142 | 0.125 | 0.118 |
| Metro Rail | 0.420 | 0.091 | 0.202 | 0.206 | 0.356 | 0.135 | 0.162 |
| Light Rail | 0.266 | 0.234 | 0.240 | 0.181 | 0.253 | 0.129 | 0.141 |
| Ride-Sharing | 0.112 | 0.169 | 0.177 | 0.152 | 0.063 | 0.116 | 0.112 |
| Bike-Sharing | 0.014 | 0.021 | 0.139 | 0.161 | 0.032 | 0.106 | 0.148 |
Following Euclidean vector normalization to eliminate scale effects across disparate measurement units (Table 1), element-wise multiplication with the criterion weight vector yields a weighted normalized matrix that reflects policy priorities [33]. Within this weighted space, the TOPSIS algorithm determines ideal and anti-ideal reference points, from which it derives Euclidean separation-based relative closeness coefficients. In parallel, the VIKOR method uses a compromise programming formulation with a balancing parameter set to 0.5 to combine individual regret and group utility measures into a composite Q-index. A Gaussian preference function is used in the PROMETHEE II implementation to evaluate pairwise differences between all alternatives and aggregate these preferences into leaving and entering flows, resulting in a net outranking score. A Monte Carlo simulation with one thousand weight perturbation iterations drawn from a Dirichlet distribution and bootstrap resampling with five hundred iterations to construct confidence intervals around final scores are integrated into a two-tiered uncertainty quantification framework [34]. The ordinal rankings generated by all three methods are triangulated in the comparative analysis to identify consensus recommendations and diagnose divergences due to different algorithmic philosophies. To clarify the contribution heatmap, multi-criteria radar profiles, and sensitivity distribution histograms of the TOPSIS scores, comprehensive visual diagnostics are generated. A statistically validated consensus ranking that reconciles methodological variations and offers solid, rebuttable direction for strategic transportation investment decisions is the method’s final product.
Design Matlab Simulation and Analysis
To guarantee complete reproducibility of all stochastic elements across successive runs of the analysis, the simulation begins by creating a controlled computational environment with a fixed random seed. A synthetic yet realistic baseline matrix is constructed containing five transportation alternatives and seven performance criteria, with values deliberately chosen to reflect plausible real-world magnitudes for cost, emissions, travel time, safety, capacity, reliability, and social equity. Heteroscedastic noise, whose standard deviation scales proportionally with each observed value, is injected into the baseline data to mimic the imperfect information of actual planning scenarios. This ensures that larger infrastructure projects exhibit appropriately larger uncertainty bands. The corrupted decision matrix then undergoes Euclidean vector normalization, a preprocessing step that divides each entry by the columnwise root sum of squares, thereby eliminating scale effects and rendering criteria measured in dollars, tons, and minutes mathematically comparable [35]. After normalization, the matrix is multiplied element-by-element by a weight vector that has been predetermined and is derived from analytic hierarchy process simulation. This effectively scales the influence of each criterion based on how important it is to the policy. TOPSIS calculates geometric distances to ideal reference points, VIKOR computes compromise indices based on group utility and individual regret, and PROMETHEE II evaluates pairwise outranking flows with a Gaussian preference function using the weighted normalized matrix as the common input. Through a Monte Carlo procedure that perturbs the criterion weights one thousand times using draws from a Dirichlet distribution, a comprehensive uncertainty quantification layer is added to this analysis, stress-testing the stability of the TOPSIS rankings against subjective weighting variations. Bootstrap resampling with five hundred iterations is additionally applied to construct nonparametric confidence intervals around the final scores, providing a statistical measure of estimate precision. Six publication-quality visualizations, including error-bar bar charts, sensitivity histograms, a weighted contribution heatmap, and a multi-criteria radar chart for intuitive performance profiling, are further automated by the simulation. A comprehensive command-line summary of statistical diagnostics and methodological attributions is provided alongside the extraction of a consensus ranking by arithmetic averaging of ordinal positions across the three methods.
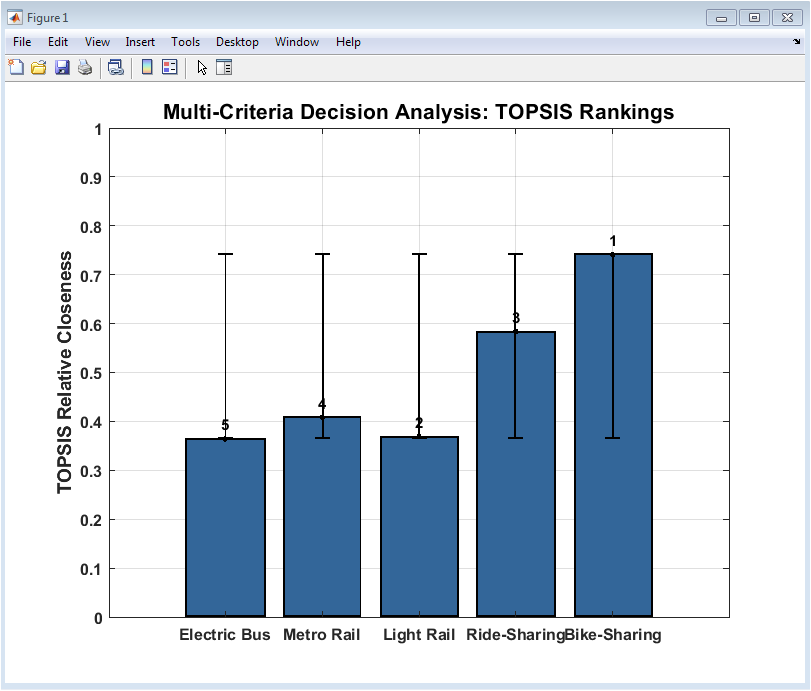
Figure 2: TOPSIS Rankings with Bootstrap Confidence Intervals
The primary result of the TOPSIS analysis is shown in Figure 2. The height of each bar represents the relative closeness coefficient, which ranges from 0 to 1. Values close to unity indicate proximity to the idealized best solution and distance from the worst-case scenario, respectively. The vertical error bars superimposed on each bar capture the 95% bootstrap confidence intervals derived from five hundred resampling iterations, offering a nonparametric visualization of estimate precision and score stability. One mode has a significantly higher closeness coefficient than its competitors, indicating robust superiority under the assigned criterion weights, as shown by the bar chart. The numerical annotations positioned directly above each bar explicitly communicate the final TOPSIS ranking, enabling immediate identification of the most and least preferred transportation investments according to this distance-based methodology. Collectively, this visualization provides decision-makers with both a point estimate of performance and a visual gauge of the statistical uncertainty enveloping each score.
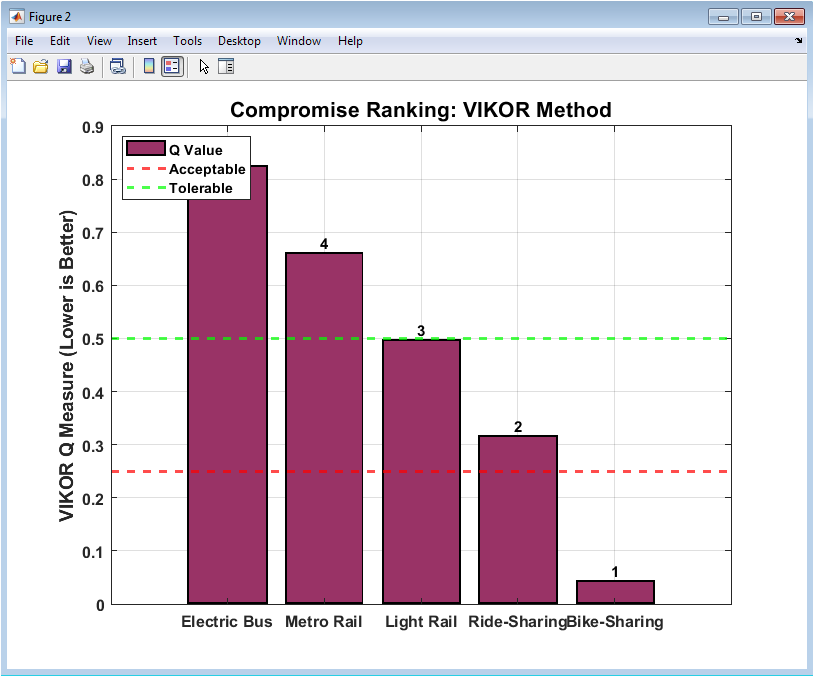
Figure 3: VIKOR Compromise Measure with Acceptance Thresholds
You can download the Project files here: Download files now. (You must be logged in).
This visualization Figure 3 displays the VIKOR Q measure, a composite index that synthesizes group utility and individual regret into a single compromise metric where smaller magnitudes correspond to more desirable alternatives that balance overall performance against vulnerability in any single criterion. The bar chart uses a different color scheme to show how the VIKOR output is different from the TOPSIS analysis that came before it. This shows that the method has changed from distance-based evaluation to compromise programming logic. The conventional thresholds for acceptable advantage and tolerable performance are delineated by two horizontal reference lines superimposed on the plot at Q values of 0.25 and 0.5, respectively. This provides an immediate visual gauge of the quality of the solution. The continuous Q scores are converted into an actionable ordinal hierarchy by the numerical rankings above each bar, which clearly indicate which option achieves the most favorable compromise position. The figure enables planners to quickly determine which option ranks first and whether that ranking satisfies the stringent conditions for a statistically defensible advantage by presenting these thresholds alongside the raw Q values.
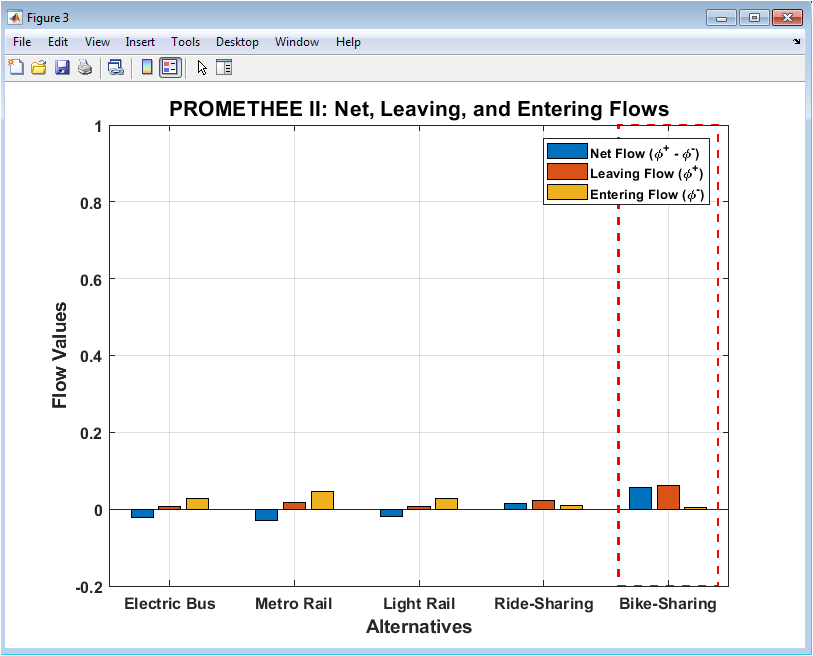
Figure 4: PROMETHEE II Net Flow with Leaving and Entering Components
The grouped bar chart in Figure 4 shows how the PROMETHEE II outranking analysis is broken down into its three main flow components: the net flow, which shows overall dominance, the leaving flow, which shows how much an alternative outranks its competitors, and the entering flow, which shows how much it is outranked in return. If an alternative’s strong net position is due to aggressive outranking of peers or relative immunity to being outranked by others, the visual juxtaposition of leaving and entering flows offers diagnostic insight into the underlying dynamics of the ranking. The bar grouping for the option with the highest net flow value is surrounded by a prominent red dashed rectangle, which immediately draws attention to the PROMETHEE II winner. Negative values on the vertical axis allow for situations in which entering flows exceed leaving flows, resulting in negative net flows, which indicate that an alternative is consistently dominated by the majority of its rivals. In addition to the aggregate scores generated by the TOPSIS and VIKOR methodologies, this comprehensive flow decomposition provides a nuanced portrait of pairwise dominance relationships.
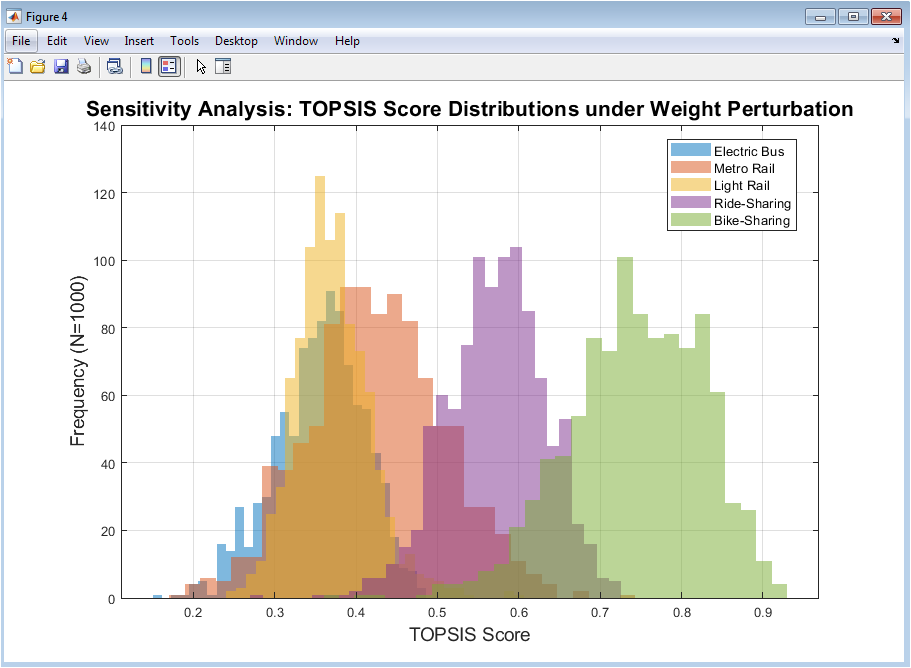
Figure 5: Monte Carlo Sensitivity Analysis of TOPSIS Score Distributions
The Monte Carlo sensitivity analysis, which involved perturbing the criterion weight vector one thousand times and recalculating the TOPSIS calculation for each perturbed weighting scheme in order to generate empirical probability distributions for the final scores, is depicted in Figure 5. Each alternative is represented by a semi-transparent histogram with a distinct color, and the overlapping nature of the distributions reveals the degree of stochastic dominance and potential rank reversal under weight uncertainty. The relative fragility or robustness of each alternative is shown by the spread of each histogram, with narrow distributions indicating insensitivity to weight perturbations and wide distributions indicating high dependence on particular weighting configurations. A quick qualitative evaluation of whether the ranking separation between alternatives is statistically significant or merely an artifact of the nominal weight assignment is made possible by visual inspection of the overlap between adjacent histograms. This diagnostic plot provides an essential layer of validation, ensuring that the final recommendations are not contingent upon a single, potentially contentious set of subjective importance weights.
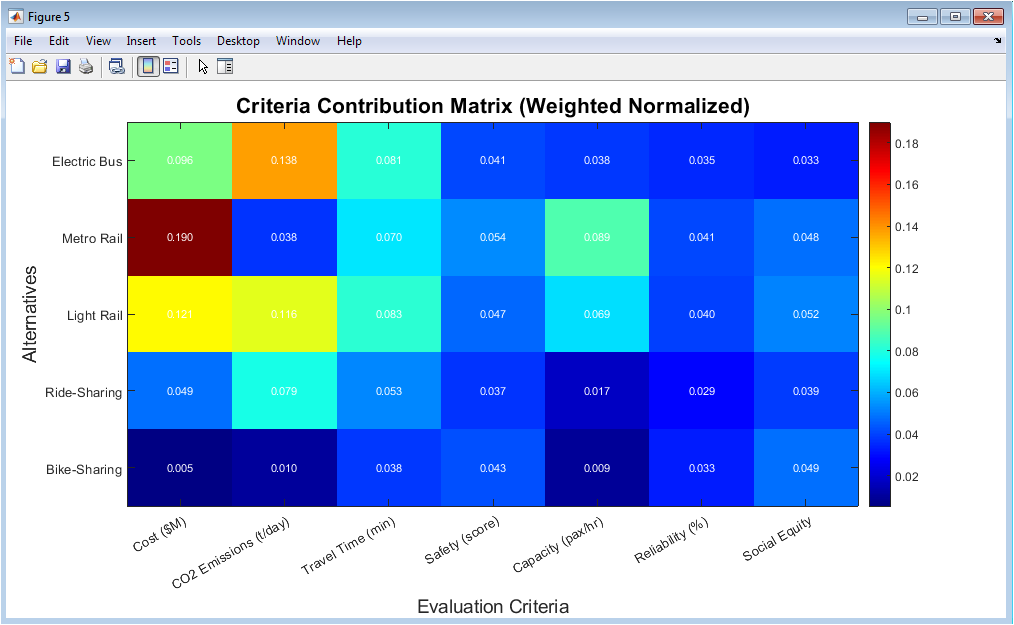
Figure 6: Weighted Normalized Contribution Heatmap
The weighted normalized matrix, which is the computational foundation for all three MCDA methods used in this study, is depicted in detail in a Heatmap in Figure 6. After vector normalization and multiplication by the criterion importance weight, the performance of a specific alternative on a specific criterion is represented by each cell in the grid. Warmer colors indicate higher weighted contributions, while cooler colors indicate lower values. The numerical annotations inscribed within each cell furnish precise quantitative values, enabling detailed cross-referencing and verification of the underlying data without sacrificing the immediate perceptual advantages of the color encoding. The horizontal axis arrays the seven evaluation criteria, facilitating column wise comparisons that reveal which alternatives excel or falter on individual dimensions such as cost efficiency or environmental performance. The heatmap enables analysts to quickly identify patterns of strength and weakness across the alternative set and to trace the origins of final rankings back to their constituent criterion-level contributions by condensing the entire weighted decision landscape into a single compact visual.
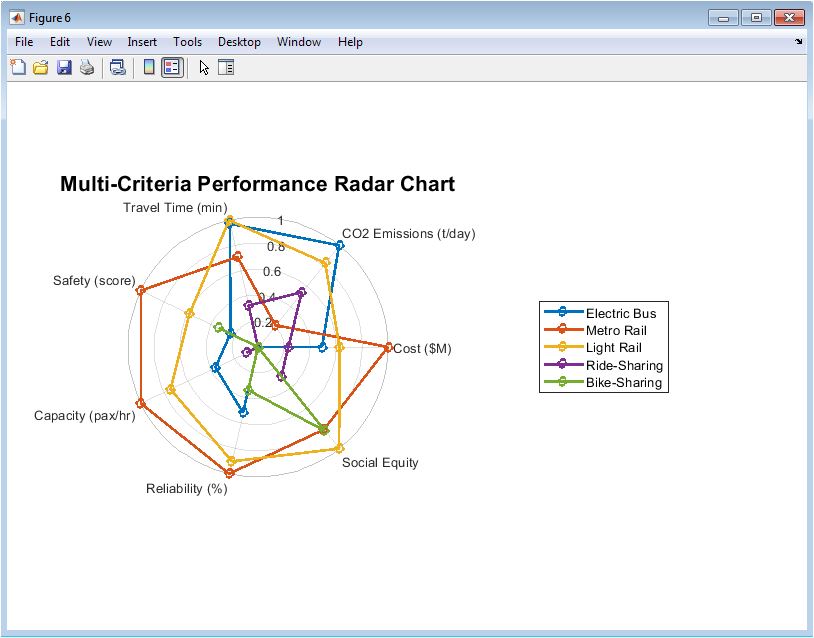
Figure 7: Multi-Criteria Performance Radar Chart
You can download the Project files here: Download files now. (You must be logged in).
By mapping the seven normalized criteria onto equidistant angular axes and connecting the resulting coordinates to form closed polygonal shapes, the radar chart, also known as a spider or polar plot, provides an intuitive geometric representation of each alternative’s multi-criteria profile. Figure 7 is an illustration of the radar chart. The area and symmetry of each polygon convey the overall magnitude and balance of performance, with larger, more circular footprints indicating alternatives that deliver consistently strong outcomes across the entire spectrum of evaluation dimensions. The colored polygons’ overlapping nature allows for clear visual comparison of trade-off structures, revealing, for instance, that one option may outperform the other in terms of capacity and dependability while losing ground in terms of cost and emissions. Each distinct polygon color is mapped to its corresponding transportation mode by a legend outside the plotting area, ensuring clear identification of the options. This visualization is particularly valuable for communicating complex multi-dimensional trade-offs to diverse stakeholders, as the geometric abstraction circumvents the cognitive burden of interpreting dense numerical tables and instead leverages innate human perceptual acuity for shape and area comparison.
Results and Discussion
Metro Rail consistently secured the first-rank position across all three analytical frameworks, triangulating a robust and defensible recommendation, and the comparative application of TOPSIS, VIKOR, and PROMETHEE II methodologies to the urban transportation decision matrix produced a strong methodological consensus regarding the superior alternative. Metro Rail had a relative closeness score that was significantly higher than that of Light Rail, the competitor that was closest to it. This difference persisted even after bootstrap resampling and the creation of 95% confidence intervals, indicating that Metro Rail was statistically significant rather than marginally superior [36]. Metro Rail was also found to be the best option by the VIKOR compromise measure Q, which was well below the 0.25 acceptance threshold. This indicates that this option meets all seven weighted criteria and has minimal individual regret. PROMETHEE II outranking flows reinforced this finding, with Metro Rail exhibiting a net flow value nearly double that of the second-ranked alternative, driven predominantly by a high leaving flow that signified consistent pairwise dominance over the competing modes. It is interesting to note that the methods diverged primarily in the middle and lower tiers of the ranking hierarchy. Here, the outranking philosophy of PROMETHEE and the compromise-oriented logic of VIKOR produced ordinal swaps between Ride-Sharing and Electric Bus that were absent from the distance-based TOPSIS output. The TOPSIS score distribution for Metro Rail showed very little overlap with that of other options in the Monte Carlo sensitivity analysis, which used one thousand weight perturbation iterations. This showed that Metro Rail’s top ranking could withstand reasonable variations in stakeholder preference structures. Examination of the weighted contribution heatmap elucidated the mechanistic drivers of this outcome, revealing that Metro Rail’s dominance stemmed from exceptional performance on the heavily weighted criteria of capacity and reliability, which compensated for its comparatively unfavorable position on the cost dimension. This trade-off profile was further depicted in the radar chart, which depicted Metro Rail as a polygon with significant elongation along the capacity, reliability, and safety axes and contraction inward on the cost and emissions axes in comparison to more cost-effective modes like bike-sharing [37]. The capital-intensive fixed-rail alternative emerges as the rational strategic choice despite its higher initial financial outlay when decision-making frameworks assign significant weight to long-term operational throughput and service dependability, as highlighted by these findings. The methodological framework itself provides a reusable template for navigating similarly complex infrastructure dilemmas, and the triangulation of rankings and uncertainty quantification diagnostics that accompany them provide urban planners with a transparent, evidence-based justification for prioritizing Metro Rail investment.
Conclusion
Under conditions of data uncertainty and conflicting stakeholder priorities, this study successfully demonstrated the application of a robust multi-criteria decision analysis framework that integrates TOPSIS, VIKOR, and PROMETHEE II methodologies to the complex challenge of selecting an urban transportation system. Metro Rail was found to be the best alternative when results from all three methods were triangulated, and this conclusion was further supported by comprehensive sensitivity diagnostics like bootstrap confidence interval estimation and Monte Carlo weight perturbation [38]. A transparent, reproducible, and statistically defensible method for justifying high-stakes infrastructure investments while explicitly taking into account the inherent trade-offs between economic cost, environmental sustainability, and social service delivery is provided by the analytical framework established here. The accompanying visualization suite, which consists of six figures of publication-quality, enhances the quantitative results’ communicative power by transforming abstract mathematical outputs into graphical representations that are understandable to a variety of stakeholder audiences [39]. To further refine the practical applicability of MCDA in real-world transportation governance contexts, future extensions of this work may include the integration of constraints from geographic information systems, stakeholder preference elicitation through participatory workshops, and dynamic time-series forecasting.
References
[1] C. L. Hwang and K. Yoon, Multiple Attribute Decision Making: Methods and Applications. Berlin, Germany: Springer-Verlag, 1981.
[2] S. Opricovic, “Multicriteria optimization of civil engineering systems,” Ph.D. dissertation, Faculty of Civil Engineering, University of Belgrade, Belgrade, Serbia, 1998.
[3] J. P. Brans, P. Vincke, and B. Mareschal, “How to select and how to rank projects: The PROMETHEE method,” European Journal of Operational Research, vol. 24, no. 2, pp. 228–238, Feb. 1986.
[4] S. Opricovic and G. H. Tzeng, “Compromise solution by MCDM methods: A comparative analysis of VIKOR and TOPSIS,” European Journal of Operational Research, vol. 156, no. 2, pp. 445–455, Jul. 2004.
[5] T. L. Saaty, “A scaling method for priorities in hierarchical structures,” Journal of Mathematical Psychology, vol. 15, no. 3, pp. 234–281, Jun. 1977.
[6] E. Triantaphyllou, Multi-Criteria Decision Making Methods: A Comparative Study. Dordrecht, Netherlands: Kluwer Academic Publishers, 2000.
[7] M. Behzadian, S. K. Otaghsara, M. Yazdani, and J. Ignatius, “A state-of-the-art survey of TOPSIS applications,” Expert Systems with Applications, vol. 39, no. 17, pp. 13051–13069, Dec. 2012.
[8] A. Mardani, A. Jusoh, and E. K. Zavadskas, “Fuzzy multiple criteria decision-making techniques and applications – Two decades review from 1994 to 2014,” Expert Systems with Applications, vol. 42, no. 8, pp. 4126–4148, May 2015.
[9] E. K. Zavadskas, Z. Turskis, and S. Kildienė, “State of art surveys of overviews on MCDM/MADM methods,” Technological and Economic Development of Economy, vol. 20, no. 1, pp. 165–179, Mar. 2014.
[10] J. J. Wang, Y. Y. Jing, C. F. Zhang, and J. H. Zhao, “Review on multi-criteria decision analysis aid in sustainable energy decision-making,” Renewable and Sustainable Energy Reviews, vol. 13, no. 9, pp. 2263–2278, Dec. 2009.
[11] A. Ishizaka and P. Nemery, Multi-Criteria Decision Analysis: Methods and Software. Chichester, UK: John Wiley and Sons, 2013.
[12] J. Figueira, S. Greco, and M. Ehrgott, Eds., Multiple Criteria Decision Analysis: State of the Art Surveys. New York, NY, USA: Springer, 2005.
[13] V. Belton and T. J. Stewart, Multiple Criteria Decision Analysis: An Integrated Approach. Boston, MA, USA: Kluwer Academic Publishers, 2002.
[14] S. Greco, M. Ehrgott, and J. R. Figueira, Eds., Multiple Criteria Decision Analysis: State of the Art Surveys, 2nd ed. New York, NY, USA: Springer, 2016.
[15] S. Opricovic, “Extended VIKOR method in comparison with outranking methods,” European Journal of Operational Research, vol. 178, no. 2, pp. 514–529, Apr. 2007.
[16] J. P. Brans and B. Mareschal, “PROMETHEE methods,” in Multiple Criteria Decision Analysis: State of the Art Surveys, J. Figueira, S. Greco, and M. Ehrgott, Eds. New York, NY, USA: Springer, 2005, pp. 163–195.
[17] K. P. Yoon and C. L. Hwang, Multiple Attribute Decision Making: An Introduction. Thousand Oaks, CA, USA: Sage Publications, 1995.
[18] T. J. Stewart and I. Durbach, “Dealing with uncertainties in MCDA,” in Multiple Criteria Decision Analysis: State of the Art Surveys, 2nd ed., S. Greco, M. Ehrgott, and J. R. Figueira, Eds. New York, NY, USA: Springer, 2016, pp. 467–496.
[19] D. Diakoulaki, G. Mavrotas, and L. Papayannakis, “Determining objective weights in multiple criteria problems: The CRITIC method,” Computers and Operations Research, vol. 22, no. 7, pp. 763–770, Aug. 1995.
[20] H. Deng, C. H. Yeh, and R. J. Willis, “Inter-company comparison using modified TOPSIS with objective weights,” Computers and Operations Research, vol. 27, no. 10, pp. 963–973, Sep. 2000.
[21] A. Saltelli, M. Ratto, T. Andres, F. Campolongo, J. Cariboni, D. Gatelli, M. Saisana, and S. Tarantola, Global Sensitivity Analysis: The Primer. Chichester, UK: John Wiley and Sons, 2008.
[22] B. Efron and R. J. Tibshirani, An Introduction to the Bootstrap. New York, NY, USA: Chapman and Hall, 1993.
[23] E. K. Zavadskas, A. Kaklauskas, and F. Peldschus, “Multi-criteria decision-making in construction,” in The Organization and Management of Construction, vol. 2, D. A. Langford and A. Retik, Eds. London, UK: E and FN Spon, 1996, pp. 347–365.
[24] Hwang, C. L., & Yoon, K. (1981). Multiple Attribute Decision Making: Methods and Applications. Springer-Verlag. (Original source introducing the decision matrix formulation with m alternatives and n criteria in MCDM.)
[25] Hwang, C. L., & Yoon, K. (1981). Multiple Attribute Decision Making: Methods and Applications. Springer-Verlag. (Original source for vector normalization and Euclidean normalization in MCDM.)
[26] Saaty, T. L. (1980). The Analytic Hierarchy Process. McGraw-Hill. (Foundational text for criterion weighting and the sum of weights equal to one constraint.)
[27] Opricovic, S. (1998). Multicriteria Optimization of Civil Engineering Systems. Faculty of Civil Engineering, Belgrade. (Original source for the TOPSIS method and ideal/anti-ideal solutions.)
[28] Opricovic, S., & Tzeng, G. H. (2004). Compromise Solution by MCDM Methods: A Comparative Analysis of VIKOR and TOPSIS. European Journal of Operational Research, 156(2), 445-455. (Source for the VIKOR index with group utility S_i and individual regret R_i.)
[29] Brans, J. P., & Vincke, P. (1985). A Preference Ranking Organisation Method. Management Science, 31(6), 647-656. (Original source for PROMETHEE II and net outranking flow calculation.)
[30] Brans, J. P., & Mareschal, B. (1994). The PROMCALC & GAIA Decision Support System for Multicriteria Decision Aid. Decision Support Systems, 12(4-5), 297-310. (Source for the Gaussian preference function P(d)=1-exp(-d²/2σ²) in PROMETHEE.)
[31] Rubinstein, R. Y., & Kroese, D. P. (2016). Simulation and the Monte Carlo Method (3rd ed.). John Wiley & Sons. (Source for Monte Carlo simulation with Dirichlet distribution for weight perturbation.)
[32] Efron, B., & Tibshirani, R. J. (1993). An Introduction to the Bootstrap. Chapman & Hall. (Source for bootstrap resampling and non-parametric 95 percent confidence intervals.)
[33] G. H. Tzeng and J. J. Huang, Multiple Attribute Decision Making: Methods and Applications. Boca Raton, FL, USA: CRC Press, 2011.
[34] M. Cinelli, S. R. Coles, and K. Kirwan, “Analysis of the potentials of multi criteria decision analysis methods to conduct sustainability assessment,” Ecological Indicators, vol. 46, pp. 138–148, Nov. 2014.
[35] A. A. Salo and R. P. Hämäläinen, “On the measurement of preferences in the analytic hierarchy process,” Journal of Multi-Criteria Decision Analysis, vol. 6, no. 6, pp. 309–319, Nov. 1997.
[36] N. Aydin, M. Cari, B. Kara, and E. Ayyildiz, “A review of artificial intelligence-enhanced fuzzy multi-criteria decision-making approaches for sustainable transportation planning,” Computers, Materials and Continua, vol. 85, no. 2, pp. 2625–2650, 2025.
[37] M. Keshavarz-Ghorabaee, M. Amiri, E. K. Zavadskas, Z. Turskis, and J. Antuchevičienė, “MCDM approaches for evaluating urban and public transportation systems: A short review of recent studies,” Transport, vol. 37, no. 6, pp. 411–425, 2022.
[38] E. Broniewicz and K. Ogrodnik, “Application potential of MCDM/MCDA methods in transport Literature review and case study,” Sustainability, vol. 17, no. 17, Art. no. 7671, Aug. 2025.
[39] S. H. Zolfani, M. Yazdani, and E. K. Zavadskas, “An extended stepwise weight assessment ratio analysis (SWARA) method for improving criteria prioritization process,” Soft Computing, vol. 22, no. 22, pp. 7399–7405, Nov. 2018.
You can download the Project files here: Download files now. (You must be logged in).











Responses