

MATLAB/Simulink model creation for a battery energy storage system
Author: Waqas Javaid
Abstract
This research paper presents the MATLAB/Simulink battery energy storage system (BESS) model’s detailed development. The BESS is modeled using a suggested logical-numerical modeling approach, which does away with the requirement for complicated circuitry, control algorithm implementation, first principle derived mathematical equations, and long computation times. By using straightforward logic and mathematical functions, the suggested modeling approach significantly reduced the modeling work. Three case study applications—peak shaving, load shifting, and load leveling—are used to illustrate the use of the suggested BESS model using actual commercial building recorded load profiles. For performance study, the BESS model may produce detailed graphical data such as load profile, peak demand both with and without BESS, and battery state of charge.This paper’s BESS implementation and case study are completely replicable. From LV distribution scale in kWh to MV utility scale MWh storage applications, the suggested BESS model is appropriate. The suggested BESS model is a vital tool for determining the size of BESS deployment and conducting feasibility studies.
1. Introduction
Utility scale energy storage system plays a vital role in the development of smart grid. Its serve as a temporal energy buffer to store energy from the generation resources and deliver to the load or back to the grid strategically to achieve the intended objectives including matching supply and demand, load leveling, load shifting, voltage support, frequency regulation, distributed generation integration, spinning serve, etc. There is various type of energy storage system technologies [1] available in the market, which includes lead acid, lithium ion, sodium sulphur, redox flow battery, fuel cell, supercapacitor, superconducting magnetic, compressed air, flywheel, pumped hydro, etc. Each of them have its pros and cons in term of physical size, life span, scalability, cost, maintainability, capital expenditures, operating expenses and return of investment. Amount all, the most commercially and economically viable for LV and MV storage application is battery-based. This is because the cost of the battery has a declining trend in the past decade
[2] and found itself a wide variety of applications including domestic residential storage, electric vehicle, uninterrupted power supply, community energy storage, utility scale storage, off-grid system, etc. On top of that, there are many research institutions around the world putting in lots of effort to improve the performance of BESS [3].
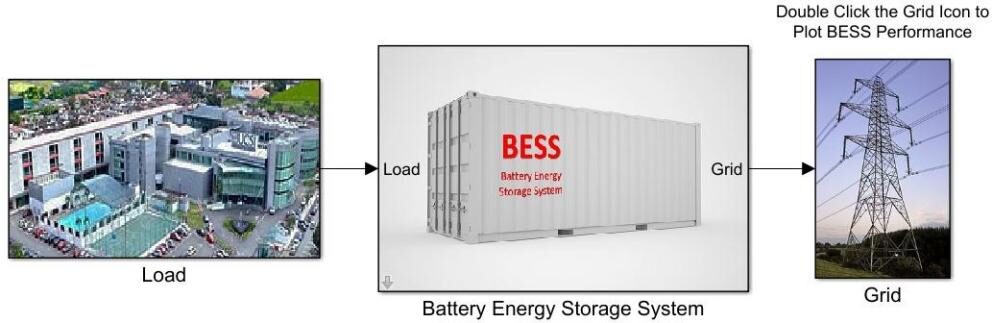
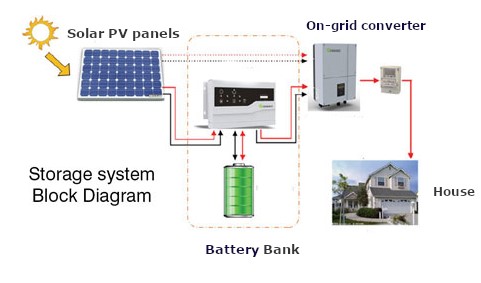
A general overview of BESS is shown in Fig. 1, it is usually located within distribution substation proximity connected at the point of common couple in between the grid transmission supply and load. It serves as energy buffer to temporary store and delivers energy under specific conditions such as time or load level to achieve the intended objective. Most of the time the grid is continually supplying the load and at the same time charge the battery under some set conditions such as excess energy is available, off- peak hour or low tariff time and discharge during high load consumption time. The BESS can also serve as temporary emergency backup power when the grid supply is not available or interrupted.
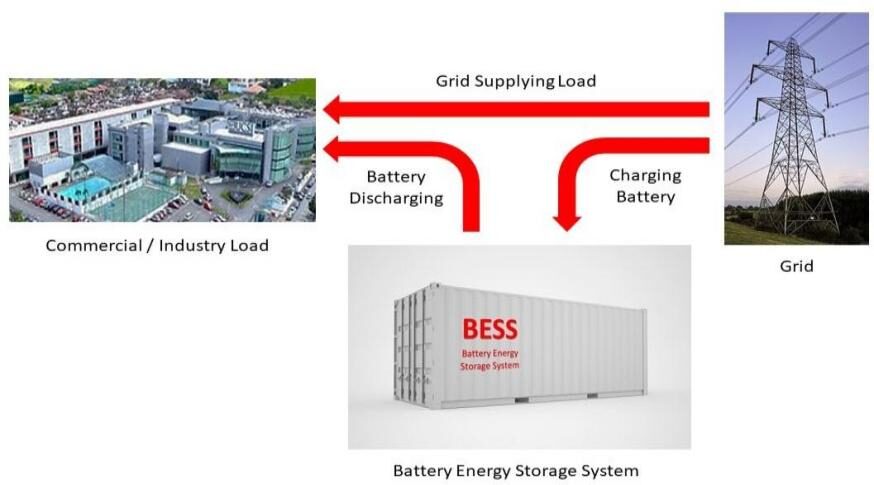
Fig. 1. Overview of battery energy storage system.
For any BESS implementation, it is important to conduct feasibility study through simulation. However, to create the BESS model for simulation require in-depth knowledge of battery charge discharge controller, power conversion system design and battery modeling [4-7]. Due to the complexity of the BESS model, it usually requires hours of simulation time to complete a simulation case. To some extent, it requires the use of real-time hardware in the loop to speed up the simulation time. In this paper, a logical-numerical modeling method is proposed. This modeling eliminates the complexity of power electronic converter circuitry and control algorithm implementation. The following sections will describe the detail BESS implementation in MATLAB/Simulink.
2. Methodology
A logical-numerical modeling approach is proposed in this paper to model the BESS. MATLAB/Simulink is chosen as the development platform for modeling. The proposed modeling approach is based on simple logic and mathematic function that mimic the functional behavior of BESS. The overview of the BESS Simulink model is shown in Fig. 1, it consists of three main blocks, and there are Load, Battery Energy Storage System and Grid. The load is basically a Simulink native ‘from Workspace’ block which read in load profile from MATLAB workspace in an hourly basis representing the building of interest to integrate BESS. The main BESS block computes the BESS charge discharge activities with respect to the BESS setting and sent the total grid usage to the grid block which is also a Simulink native ‘To Workspace’ block. With the information now available in workspace the BESS performance can be plotted for analysis.
Fig. 2. Overview of the BESS model in Simulink.
The details MATLAB/Simulink BESS block implementation is shown in Fig. 3. Under the mask of BESS block, the author’s group the BESS into three subgroups to ease the understanding of the implementation and flow of the BESS. The three subgroups include the Battery, Power Converter System and Charge Discharge Controller. By this grouping approach, it makes the BESS functional block easy to upgrade and improve in the future.
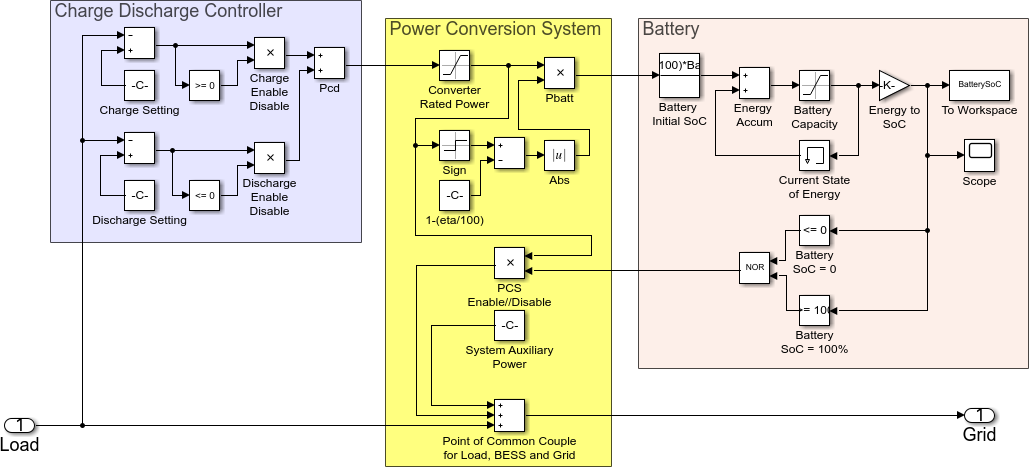
Fig. 3. Detail Simulink implementation of the BESS block.
You can download the Project files here: Download files now. (You must be logged in).
2.1. Charge discharge controller
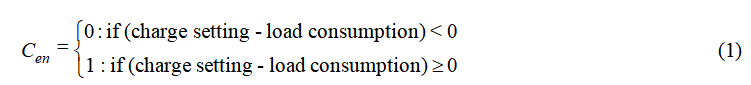
The charge discharge controller manages how the BESS charge and discharge the battery. The charge and discharge setting in kW are subtracted from the system auxiliary power to ensure the desired set charge or discharge power is factored in the BESS auxiliary power. The charge setting defines when the load consumption is below the charge setting in kW, the power conversion system will start to charge the battery from the grid supply. The charge enable and disable is defined in (1) where the charge setting power is subtracted from the load consumption power if the result is positive, the Cen is enabled and the charge controller will send the required resultant power from the subtraction to charge the battery through the power conversion system. If the subtraction result is negative the Cen is disabled.
Similarly, the discharge setting define when the load consumption is above the discharge setting in kW, the power conversion system will start to discharge energy from the battery to supply the load which in turn reduce the grid supply utilization. The discharge enable and disable is defined in (2) where the discharge setting power is subtracted from the load consumption power if the result is negative, the Den is enabled and the discharge controller will send the required resultant power from the subtraction to discharge the battery through the power conversion system to the load. If the subtraction result is positive the Den is disabled.

The charge discharge controller output Pcd is defined in (3) where the Cen and Den is always first complement to each other meaning charge and discharge can never happen at the same time. The addition block merged the charge and discharge outputs into a single output to the power conversion system.
![]()
2.2. Power conversion system
The power conversion system sits in between the charge discharge controller, battery, load, and the grid. It directed the charge discharge controller output to charge the battery from the grid or discharge battery to feed the load. The input of the power conversion system takes in the charge discharge controller power in kW, similarly, a positive sign indicates a charge and negative sign indicate a discharge. The input of the power conversion system passes through a saturation block which serves as the converter rated power which is the maximum charge and discharge power that the BESS can handle.
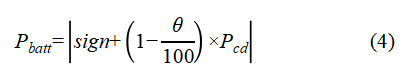
One of the important attribute to be considered for any power conversion system is its power conversion efficiency. How the power conversion system efficiency influence the battery charge and discharge power is computes and defined in (4), where Pbatt is power to battery, sign is +1 during charging and -1 during discharging, θ is the conversion efficiency which can be set by the user, typically in the range from 80-95% and Pcd is the charge or discharge power in kW from the charge discharge controller. Take an example of 90% power conversion efficiency is applied to the power conversion system, during charging with a positive sign of 100kW is taken from the grid to charge the battery, however only 90kW of power flow into the battery, similarly during discharging with a negative sign, 110kW is discharged from the battery, however, only 100kW is feed the load.
The power conversion system output power pass through the PCS enable and disable control by the battery feedback then connect to the point of common couple between load and the grid via an Addition block. A system auxiliary power block represents the energy requires to run the entire BESS is also taken into account. These include the cooling, monitoring, communication, protection, switchgear, lighting, etc. It is typically in the range from 5-20% of the BESS power conversion system rated power. The output of the Addition block represents the load plus system auxiliary power plus charge discharge power taken from the grid.
2.3. Battery
In the battery section, the input of the battery model is a signed integer in the unit of kW sample at an hourly basis from the power conversion system. A positive sign indicates a charge and a negative sign indicate a discharge. The Battery Initial SoC block allows the user to set the initial state of charge of the battery in percentage. This is a common practice to pre-charge the battery at a certain state of charge usually up to 30% before commissioning the BESS. The Addition block and the Memory block which holds the current state of energy form the battery energy accumulator. The saturation block represents the battery capacity and ensures the battery state of energy does not discharge below 0% or continue to charge beyond 100%. The Gain block converts the battery energy unit in kWh to the state of charge in percentage. The output of the battery in state of charge is fed into workspace, scope for usage monitoring, performance analysis plotting and feedback to the power conversion system define in (5) where SoC is less than 0% nor greater than 100% then PCSen is logical zero to disable the power conversion system output via the PCS enable and disable product block.
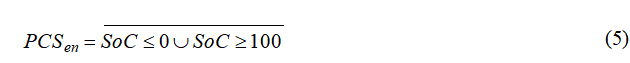
This is to ensure that the charge converter does not continue to charge the battery when the battery has reached 100% state of charge and does not continue to discharge the battery when the battery has reached 0% state of charge.
2.4. BESS model parameters setting
A parameter setting menu was developed to ease the user to configure the BESS model for simulation and performance analysis. The BESS block parameters setting menu is shown in Fig. 4. The parameters description is self-explanatory. In general, the Battery Energy Storage System Rated Power parameters are the maximum charge and discharge power in kW that can be handled by the BESS power conversion system. The nominal battery capacity specific the energy capacity of battery in kWh. The Initial Battery State of Charge parameters is the initial charge remains in the battery before the simulation start. It is a common practice to pre-charge the battery up to a certain state of charge before commissioning the BESS. The power conversion system efficiency allows the user to set the converter efficiency in percentage. This information can be obtained from the BESS technical specification. The system auxiliary power in percentage with respect to the BESS rated power is the power required to run and operate the BESS, this includes the cooling, monitoring, communication, protection, switchgear, lighting, etc. In the charge discharge controller setting section, the charge battery when load consumption is below (kW) imply charging of the battery from the supply grid when the load consumption is below the set value in kW. On the other hand, the discharge battery when load consumption is above (kW) imply discharge of the battery to supply the load when the load consumption is above the set value in kW
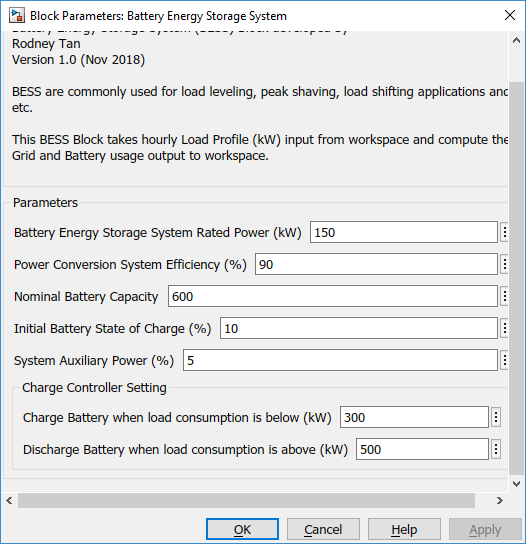
Fig. 4. BESS block parameters setting menu.
You can download the Project files here: Download files now. (You must be logged in).
3. Result and Discussion
To demonstrate the operation and performance of the BESS model, a real load profile recorded at hourly interval was chosen for demonstration. It is a typical weekday commercial office load profile where demand begins from 9 hour to 17 hour, this load profile consume a total of 8790 kWh of energy in a day and have a peak power of 606 kW at 15 hour.
3.1. Case 1 peak shaving application
Peak shaving is one of the most widely used applications for BESS. Peak shaving cut down the peak demand charges on the utility bill. There are many peak shaving strategies, one of the common methods is to charge the battery during off-peak and discharge during peak to shave the peak demand [8-9]. This case study demonstrates how the BESS model can be used for peak shaving application. The BESS rated power is set at 150 kW, the battery capacity is set at 720kWh with initial state of charge of 10%, charge converter efficiency of 90%, system auxiliary power is 5%, the charge power set to 300 kW and the discharge power is set to 500 kW which is the intended shave power level. The BESS model performance is shown in Fig. 5. It can be clearly seen during off-peak hours from 0 to 7 hour and from 21 to 23 hours the load consumption in red is lower than 300 kW. Therefore the charge controller was set to charge the battery during this period of time. During the charging period, the charge controller also ensures the charge power does not exceed the set 300 kW power. This allow the 720 kWh battery to charge up to 84.2% of charge. The BESS begins to discharge power from the battery when the load consumption reaches the set 500 kW at 10 hour and maintain at shaved power level of 500 kW till 17 hour. The battery reaches the depth of discharge of 5.8%, then the BESS starts to charge the battery again from 21 hour onward and the battery reaches 17.5% at 23 hour which is more than the 10% initial charge at the beginning of this simulation. This indicates that there is enough stored energy for the next day and the cycle shall sustain daily. In summary, this case study demonstrates the BESS is capable to shave the peak power from 606 kW down to 500 kW with just an additional 397 kWh of energy on top of the load profile of 8790 kWh.
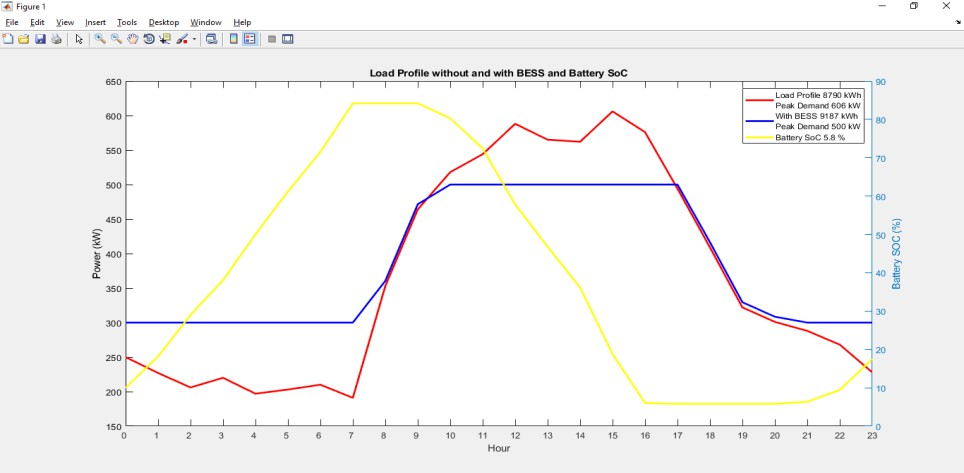
Fig. 5. Peak shaving application load profile without and with BESS and battery SoC.
3.2. Case 2 load shifting application
To encourage demand side management and matching between supply and utilization for the grid operator, electricity tariff varies from time to time. In most cases, it is usually lower during off-peak hours. Load shifting is a common technique apply for demand side management and take advantage of the off- peak tariff incentive [10]. This case study demonstrates how the proposed BESS can be used for load shifting application. The BESS rated power is set at 350 kW, the battery capacity is set at 3000kWh with initial state of charge of 20%, power conversion system efficiency of 90%, system auxiliary power is 5%, the charge power set to 550 kW and the discharge power is set to 300 kW. The BESS model performance is shown in Fig. 6. It can be clearly seen that during off-peak hours from 0 to 7 hour and 19 to 23 hour the BESS is charging the battery up to the charge limit of 550 kW. The BESS charge the battery up to 91.5% at 9 hour and begin to discharge down to the discharge load level of 300 kW till 18 hour with battery depth of discharge reaches 8.8% and begin to charge the battery again till the end of the day. With that, the BESS is effectively shifting the load from peak hour to off-peak hour with additional 2021 kWh of energy on top of the load profile of 8790 kWh. In summary, this case study demonstrates that the BESS is capable to shift the load from peak hour to off-peak hour with 44.5% of charge in the battery at the end of the day at 23 hour. This indicates that there is enough stored energy for the next day and the cycle shall be able to sustain daily.
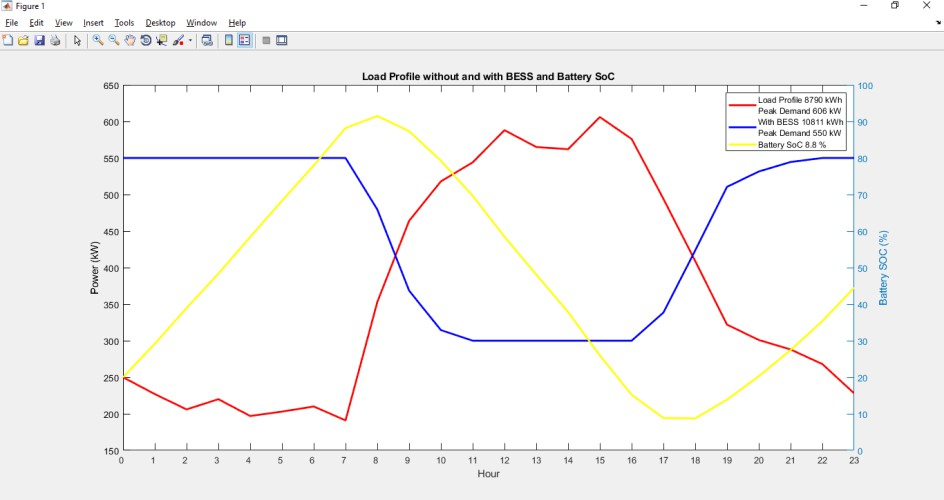
Fig. 6. Load Shifting Application Load Profile without and with BESS and Battery SoC.
You can download the Project files here: Download files now. (You must be logged in).
3.3. Case 3 load leveling
With the rapid growth of renewable energy distributed generation connected to the grid. The intermittence nature of solar PV and wind power injection can cause great fluctuation to the grid supply. One of the important features of the smart grid is the ability to match supply and demand through the support of BESS. Load leveling is a common technique used to achieve unity load factor which is flattening the load and supply throughout the day [11-12]. This case study demonstrates how the proposed BESS model can be used for load leveling application. The BESS rated power is set at 250 kW, the battery capacity is set at 2000kWh with initial state of charge of 30%, the power conversion system efficiency is set at 90%, system auxiliary power to run the BESS is 5% and the load level is set at 400 kW which is two-third of the load profile maximum demand. The BESS model performance is shown in Fig.7. It can be clearly see that the BESS is capable to maintain the set load level at 400 kW through the day achieving the unity load factor by charging the battery from 0 to 8 hour up to 88.2%, and discharging the battery from 9 to 17 hours down to 8.4% and then charge the battery again and from 18 hour till end of the day up to 32.3%.This indicates that there is enough stored energy for the next day and the cycle shall be able to sustain daily. In summary, this case study demonstrates the BESS is capable to level the load power at the set 400 kW with just additional 810 kWh of energy on top of the load profile of 8790 kWh.
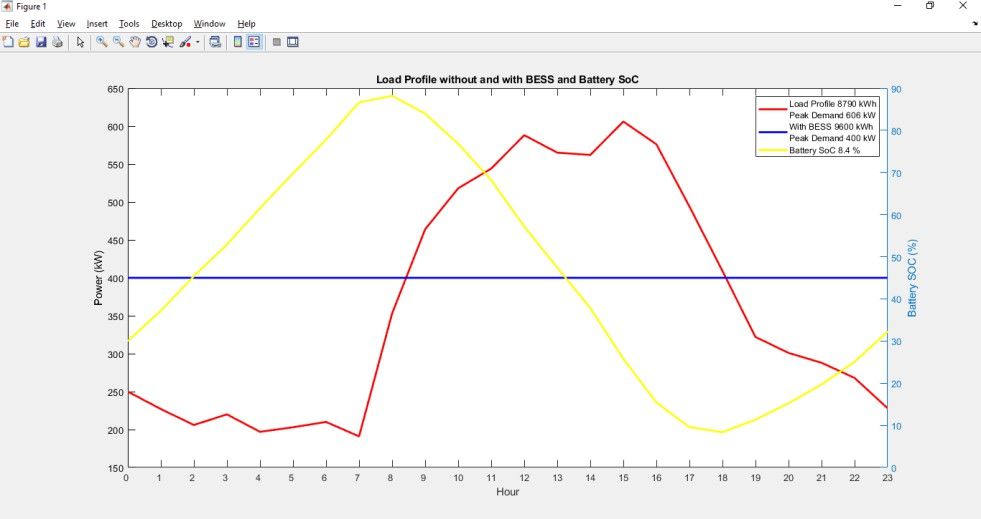
Fig. 7. Load leveling application load profile without and with BESS and battery SoC.
3.4. Discussion
The three case studies presented above fully demonstrated the ease of use and capability of the proposed BESS model. The BESS simulation provides overlay graphical results that visualize clearly how energy is stored and deliver at hourly interval. The results presented for each case study may not be fully optimized. However, it demonstrated the BESS model potential applications. In practice, it requires at least a month up to a yearlong of load profile to tune the BESS parameters for optimum performance. Among these three case studies, load shifting uses the highest battery capacity of 3000 kWh, highest BESS rated power of 350 kW and 2021 kWh additional energy, where else peak shaving application uses the lowest battery capacity of 720 kWh, lowest BESS rated power of 150 kW and only 397 kWh additional energy. This is simply because load shifting requires higher rated power and higher battery capacity to store the energy to be shifted from one time slot to another, where else for peak shaving or load leveling it requires only the energy different to shaved or level the set power, therefore uses less power, battery capacity, and energy. From the economic perspective, the two important BESS parameters require attention are the rated power and battery capacity, simply because these two parameters are proportional to the cost of BESS implementation. The proposed BESS was implemented in such a way that the charge discharge controller, power conversion system and battery can be flexibly replaced or upgrade to deal with more complex energy profile applications.
4. Conclusion
The development of the BESS model implemented in MATLAB/Simulink has been presented in this paper. The proposed modeling method greatly simplified the modeling effort and significantly reduce the simulation time. It comes with easy to use menu setting for the BESS and simulation setup. The BESS simulation provides graphical results that overlay the load profile without and with BESS, and battery state of charge visualizing how energy is stored and delivered at hourly interval. Three case studies including peak shaving, load shifting and load leveling presented in this paper fully demonstrated the capability of the BESS model. The BESS model applications are not limited to load side LV distribution level in kWh but up to MV utility scale in MWh storage capacity. The BESS model was implemented in a way that allows the battery, power conversion system or charge discharge controller to be flexibly added, replace and upgrade to cater for more complex storage applications. Lastly, the proposed BESS model contributes as an indispensable tool for BESS implementation sizing determination and feasibility study.
References
[1] Xuesong Z, Yitong L, Youjie M. The overview of energy storage technology, Presented at: 2015 IEEE International Conference on Mechatronics and Automation (ICMA)
[2] Brinsmead TS, Graham P, Hayward, Ratnam EL, Reedman L. Future energy storage trends: An assessment of the economic viability, Potential Uptake and Impacts of Electrical Energy Storage on the NEM 2015-2035. CSIRO, Australia. Report No. EP155039, 2015.
[3] Feehally T, Forsyth AJ, Todd R, Foster MP, Gladwin D, Stone DA, Strickland D. Battery energy storage systems for the electricity grid: UK research facilities, Presented at: 2016 The 8th IET International Conference on Power Electronics, Machines and Drives (PEMD)
[4] Tian X, Muyi L, Peng Z, Liting T, Xiaohui Q, Ning A, Modeling and Simulation of Battery Energy Storage System (BESS) Used in Power System, Presented at: 2015 5h International Conference on Electric Utility Deregulation and Restructuring and Power Technologies (DRPT).
[5] Mostafa F, Sebastian K, Claudio AC, Kankar B, Thomas L, Battery energy storage system models for microgrid stability analysis and dynamic simulation. IEEE Transactions on Power Systems, 2018; 33 (2):2301-2312.
[6] Three-Phase Battery Energy Storage System written for PSCAD v4.6 and Later, Manitoba Hydro International (2018)
[7] Lova R, RTDS Modelling of Battery Energy Storage System, Master Thesis, Uppsala Universitet; 2011
[8] Moslem U, Mohd FR, Mohd FA, Syahirah AH, Ab Halim Abu Bakar, Tan CK. A review on peak load shaving strategies.
Renewable and Sustainable Energy Reviews, 2018; 82: 3323-3332.
[9] Kein HC, Yun SL, Stella M. Battery energy storage system for peak shaving and voltage unbalance mitigation. International Journal of Smart Grid and Clean Energy, 2013; 2 (3):357-363.
[10] Thillainathan L, Dipti S, Vanessa KWM. Demand side management of smart grid: Load shifting and incentives. Journal of Renewable and Sustainable Energy, 2014; 6 033136.
[11] Robert JK, Gregory FR, Adam RS. Economic analysis of grid level energy storage for the application of load leveling, Presented at: 2012 IEEE Power and Energy Society General Meeting (PESGM)
[12] Mohd FMS, Asnawwi B, Hyogo T, Jun H. Feasibility Study of Battery Energy Storage System with Power Quality Support in Malaysia, Presented at: 2005 18th International Conference on Electricity Distribution (CIRED).
You can download the Project files here: Download files now. (You must be logged in).


Responses