

ESP_Test, An Enhanced Sampling Platform for Advanced Signal Processing and Machine Learning Analysis in MATLAB
Author : Waqas Javaid
Abstract
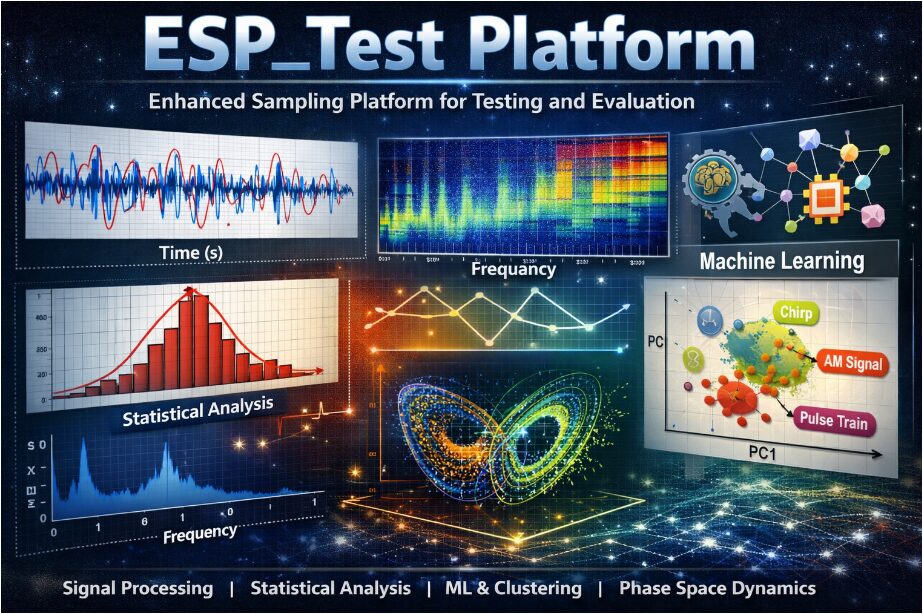
This paper presents the ESP_Test Platform, an enhanced sampling and evaluation framework developed in MATLAB for comprehensive signal analysis and machine learning experimentation. The platform generates multiple synthetic signals including multi-frequency harmonic signals, chirp signals, amplitude and frequency modulated signals, pulse trains, and a chaotic Lorenz-based signal. Controlled noise injection is applied to simulate realistic measurement environments and enable robust performance testing [1]. A structured statistical analysis module computes descriptive metrics such as mean, standard deviation, skewness, kurtosis, RMS, peak-to-peak amplitude, and entropy. Time-frequency behavior is examined using short-time Fourier transform–based spectrograms, while power spectral density and autocorrelation functions provide frequency-domain and temporal correlation insights [2]. The framework further incorporates hypothesis testing and signal-to-noise ratio estimation for quantitative validation. For intelligent characterization, feature extraction combines statistical and spectral descriptors into a normalized feature matrix [3]. Machine learning techniques including k-means clustering and principal component analysis are applied for dimensionality reduction and pattern discovery [4]. Eight independent high-quality visualization modules present time-domain, spectral, distributional, and phase-space representations. The ESP_Test Platform offers a unified, modular, and extensible environment suitable for research, education, and advanced signal processing development.
Introduction
In modern engineering and scientific research, signal processing plays a central role in understanding, modeling, and interpreting complex dynamic systems.
From communications and biomedical monitoring to radar, control systems, and artificial intelligence, accurate signal analysis is essential for extracting meaningful information from raw data. However, real-world signals are often contaminated with noise, nonlinear distortions, and time-varying characteristics, making robust evaluation frameworks increasingly important [5]. To address these challenges, integrated platforms that combine statistical analysis, spectral decomposition, and machine learning techniques are becoming indispensable tools for researchers and practitioners [6]. The ESP_Test Platform is designed to provide such a unified environment for enhanced sampling and systematic signal evaluation. It enables the generation of diverse synthetic signals, including harmonic, chirp, amplitude-modulated, frequency-modulated, pulse-based, and chaotic signals, allowing controlled experimentation across multiple signal domains [7]. By incorporating adjustable noise injection, the platform simulates realistic measurement conditions and facilitates performance benchmarking. Comprehensive statistical metrics such as mean, variance, skewness, kurtosis, RMS, and entropy are computed to characterize signal behavior quantitatively. In addition, time-frequency analysis using short-time Fourier transform reveals evolving spectral content over time [8]. Frequency-domain insights are further obtained through power spectral density estimation and autocorrelation analysis. Beyond traditional signal processing, the platform integrates machine learning-based feature extraction and normalization techniques to transform raw signals into structured data representations. Clustering algorithms such as k-means enable pattern discovery, while principal component analysis supports dimensionality reduction and visualization [9]. This multidisciplinary approach bridges classical signal theory with modern data-driven intelligence. The modular design ensures flexibility, scalability, and extensibility for advanced research applications. As signal complexity continues to grow in emerging technologies, platforms like ESP_Test provide a critical foundation for experimentation, validation, and innovation in next-generation signal analysis systems [10].
1.1 Background of Signal Processing
Signal processing is a fundamental discipline in modern engineering and scientific research that focuses on the analysis, interpretation, and transformation of signals. Signals can represent physical phenomena such as sound, electromagnetic waves, biological activity, or mechanical vibrations. With the rapid advancement of technology, the complexity and dimensionality of signals have increased significantly. Traditional analytical techniques are often insufficient for handling nonstationary and nonlinear behaviors observed in real-world systems [11]. As a result, there is a growing need for comprehensive frameworks that integrate multiple analytical methods. Digital signal processing has enabled efficient computation and simulation-based experimentation. Simulation platforms allow researchers to test theoretical models before real-world implementation. Accurate signal modeling also supports innovation in communications, control systems, biomedical engineering, and artificial intelligence. Therefore, developing structured and flexible signal evaluation platforms has become a research priority.
1.2 Motivation for an Enhanced Sampling Platform
Real-world signals are rarely clean or ideal; they are frequently corrupted by noise, interference, and environmental disturbances. In many applications, understanding how algorithms perform under noisy conditions is critical. Enhanced sampling strategies improve resolution and capture subtle variations in time-varying signals. Without controlled experimental environments, evaluating signal processing methods becomes inconsistent and unreliable. A dedicated testing platform enables reproducibility, benchmarking, and performance comparison. Moreover, simulation-based signal generation reduces dependency on costly hardware experiments. Researchers require a system where parameters such as sampling rate, duration, and noise level can be adjusted dynamically [12]. This flexibility allows testing under multiple scenarios without redesigning experiments. The motivation behind the ESP_Test Platform is to bridge theoretical modeling with practical experimentation. Such a system enhances both educational and advanced research capabilities.
1.3 Synthetic Signal Generation
A robust testing environment must include diverse signal types to evaluate algorithm adaptability. The ESP_Test Platform generates multi-frequency harmonic signals to simulate composite periodic systems. Chirp signals are included to analyze time-varying frequency behavior. Amplitude-modulated and frequency-modulated signals represent communication system dynamics. Pulse trains with adjustable duty cycles simulate digital switching or radar pulses. Additionally, chaotic signals derived from nonlinear systems introduce complex deterministic randomness [13]. The Lorenz-based chaotic signal provides a nonlinear dynamic test case. By combining deterministic and chaotic signals, the platform covers a broad signal spectrum. Synthetic generation ensures controlled repeatability across experiments. This diversity supports comprehensive evaluation of statistical and machine learning models.
1.4 Noise Modeling and Realistic Conditions
Noise modeling is essential for simulating practical measurement environments. In the ESP_Test Platform, additive white Gaussian noise is introduced with adjustable intensity. This controlled noise injection allows systematic signal-to-noise ratio analysis. Researchers can observe how noise influences statistical descriptors and spectral properties [14]. Real-world sensors often encounter environmental disturbances, thermal noise, and quantization effects. Simulating these conditions ensures realistic performance evaluation. Noise modeling also supports robustness testing of machine learning classifiers. By comparing clean and noisy versions, degradation metrics can be quantified. Entropy and SNR calculations provide objective performance indicators. Therefore, noise simulation strengthens the reliability of experimental findings.
1.5 Statistical Characterization of Signals
Statistical analysis provides fundamental insights into signal behavior. Descriptive metrics such as mean and standard deviation summarize central tendency and dispersion. Higher-order statistics including skewness and kurtosis reveal asymmetry and distribution shape. Root mean square values quantify effective signal power. Peak-to-peak measurements highlight amplitude variation ranges. Entropy estimation evaluates randomness and information content. Hypothesis testing methods help determine normality assumptions [15]. These statistical tools form the foundation for signal comparison and classification. Automated computation ensures consistent evaluation across all generated signals. Comprehensive statistical characterization supports deeper analytical interpretation.
1.6 Time-Frequency Analysis
Many real-world signals exhibit nonstationary characteristics where frequency content changes over time. Time-frequency analysis addresses this limitation of classical Fourier methods. The short-time Fourier transform enables localized spectral examination. Spectrogram visualization illustrates how frequency components evolve dynamically [16]. This approach is particularly useful for chirp and modulated signals. Time-frequency representations enhance interpretability in transient systems. Spectral leakage and windowing effects are carefully managed for clarity. Visual analysis assists in identifying hidden patterns and harmonics. These techniques bridge time-domain and frequency-domain insights. Consequently, time-frequency analysis is a critical component of the platform.
1.7 Frequency-Domain and Correlation Analysis
Frequency-domain analysis provides another perspective on signal characteristics. Power spectral density estimation identifies dominant frequency components. Fast Fourier Transform computation ensures computational efficiency. Spectral peaks indicate fundamental frequencies and harmonics [17]. Autocorrelation functions measure temporal dependency and periodicity. Normalized autocorrelation highlights repeating structures within signals. These methods support detection of oscillatory patterns and hidden cycles. Frequency analysis is essential for communication and vibration applications. Correlation analysis also aids in feature extraction for machine learning tasks. Together, these tools provide comprehensive spectral insight.
1.8 Feature Extraction and Normalization
To enable intelligent analysis, raw signals must be transformed into structured feature representations. The ESP_Test Platform extracts statistical and spectral features systematically. Dominant frequency and spectral centroid serve as informative descriptors. Feature vectors combine amplitude-based and frequency-based characteristics [18]. Normalization ensures scale consistency across multiple signals. Removing NaN and infinite values maintains numerical stability. A structured feature matrix facilitates pattern recognition tasks. Feature engineering enhances separability between signal categories. This step converts complex waveforms into machine-readable representations. Effective feature extraction is crucial for accurate machine learning performance.
1.9 Machine Learning Integration
Machine learning algorithms enable automated signal classification and pattern discovery. K-means clustering groups signals based on feature similarity. Unsupervised learning reveals hidden structures without prior labeling. Principal component analysis reduces dimensionality while preserving variance [19]. PCA visualization simplifies interpretation in two-dimensional space. Cluster analysis supports anomaly detection and grouping tasks. Dimensionality reduction improves computational efficiency. Combining statistical and ML methods strengthens analytical robustness. Intelligent processing enhances decision-making in complex environments. Thus, machine learning integration modernizes traditional signal analysis approaches.
1.10 Visualization, Modularity, and Applications
Effective visualization translates complex computations into interpretable graphical outputs. The platform generates multiple independent plots for time-domain, spectral, statistical, and phase-space analysis. Three-dimensional phase reconstruction illustrates chaotic dynamics. High-resolution visual outputs support publication-quality presentation. The modular architecture allows easy expansion and customization [20]. Researchers can integrate additional algorithms without restructuring the system. Educational institutions can use the platform for advanced laboratory demonstrations. Industry professionals may adapt it for communication, biomedical, or control system testing. The unified framework encourages interdisciplinary experimentation [21]. Overall, the ESP_Test Platform provides a scalable, intelligent, and research-oriented environment for comprehensive signal evaluation.
You can download the Project files here: Download files now. (You must be logged in).
Problem Statement
Modern signal processing research faces significant challenges due to the increasing complexity, nonlinearity, and nonstationary nature of real-world signals. Traditional analysis methods often focus on either time-domain or frequency-domain techniques, leading to fragmented evaluation approaches. Many existing tools lack an integrated framework that combines statistical characterization, spectral analysis, noise modeling, and machine learning within a single environment. Furthermore, inconsistent experimental setups make reproducibility and benchmarking difficult across different studies. The absence of controlled synthetic signal generation limits systematic performance validation under varying noise conditions. Researchers also encounter challenges in extracting meaningful features suitable for intelligent classification and clustering. Without structured normalization and dimensionality reduction, high-dimensional feature spaces reduce interpretability and computational efficiency. Additionally, visualization tools are often separated from analytical modules, complicating comprehensive interpretation. There is a need for a unified, modular, and scalable platform that enables enhanced sampling, robust statistical evaluation, and intelligent pattern recognition. Therefore, the core problem addressed in this work is the development of an integrated signal testing and machine learning framework capable of providing reliable, reproducible, and multidimensional analysis of complex signals.
Mathematical Approach
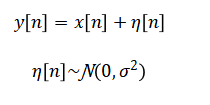
The mathematical framework of the ESP_Test Platform is based on discrete-time signal modeling, where a signal is represented as (x[n]) sampled at frequency (f_s). Noise modeling is implemented using additive white Gaussian noise, expressed as:
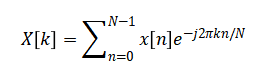
Spectral analysis is performed using the discrete Fourier transform enabling power spectral density estimation.
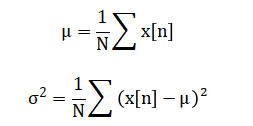
Statistical descriptors are computed using standard definitions such as mean and variance.
For machine learning analysis, feature vectors are normalized and projected using principal component analysis via eigen decomposition of the covariance matrix while clustering is performed through minimization of within-cluster variance in k-means optimization.
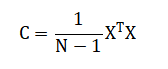
The ESP_Test Platform uses a mathematical framework to model signals in discrete time, treating each signal as a sequence of sampled values over time. To simulate realistic conditions, controlled noise is added to these signals, representing random variations that naturally occur in measurements. The platform analyzes frequency content by transforming the time-domain signal into its spectral components, which allows identification of dominant frequencies and overall energy distribution. Statistical measures, such as the average value and variance, quantify the central tendency and spread of the signal data. Higher-order statistics provide insight into the shape and symmetry of the signal distribution, helping to detect anomalies or non-standard patterns. Power-related metrics like root mean square and peak-to-peak values describe the signal’s intensity and dynamic range. Autocorrelation is used to examine repetitive patterns and temporal dependencies within the signal. For machine learning, features extracted from both the time and frequency domains are normalized to ensure consistent scaling across signals. Principal component analysis reduces the dimensionality of these features while preserving the most significant variations, making visualization and interpretation easier. Finally, clustering algorithms group similar signals together based on extracted features, enabling automated pattern recognition and classification.
Methodology
The methodology of the ESP_Test Platform is structured to provide a comprehensive, systematic, and reproducible framework for signal generation, analysis, and machine learning evaluation. The first step involves defining platform parameters such as sampling rate, signal duration, noise level, and random seed to ensure controlled experimentation [22]. Time vectors are created according to the defined sampling frequency, forming the basis for discrete-time signal modeling.
Table 1: Generated Test Signals
| Signal Name | Type | Main Frequency (Hz) | Description |
| Multi-frequency | Harmonic Sum | 5, 15, 25, 45 | Sum of sinusoidal harmonics |
| Chirp Signal | Quadratic FM | 1 → 50 | Time-varying frequency |
| Amplitude Modulated | AM | 20 (carrier) | Envelope modulated sine |
| Frequency Modulated | FM | 10 (carrier) | Frequency modulated sine |
| Pulse Train | Digital Pulse | 1 Hz repetition | Variable duty cycle |
| Lorenz Signal | Chaotic | Nonlinear | Lorenz system state variable x(t) |
A diverse set of synthetic signals is then generated, including multi-frequency harmonic signals, chirp signals with time-varying frequency, amplitude-modulated and frequency-modulated signals, pulse trains with adjustable duty cycles, and chaotic signals derived from nonlinear systems such as the Lorenz attractor [23]. Controlled additive noise is applied to all signals to simulate realistic measurement environments and evaluate algorithm robustness. Statistical analysis is performed for each signal, including computation of mean, standard deviation, skewness, kurtosis, root mean square, peak-to-peak values, and entropy, providing fundamental quantitative descriptors. Time-frequency analysis is conducted using short-time Fourier transform to visualize frequency evolution over time, while power spectral density and autocorrelation functions are calculated to capture spectral content and temporal correlations [24]. Feature extraction combines both statistical and spectral characteristics into structured feature vectors, which are then normalized to ensure uniformity and stability for machine learning processing. Dimensionality reduction is performed using principal component analysis to highlight the most significant variations and facilitate visualization. Clustering is conducted using k-means to identify patterns and group similar signals based on extracted features. High-quality visualization modules are generated, including time-domain plots, spectrograms, statistical distributions, autocorrelation functions, power spectra, principal component plots, chirp spectrograms, and phase-space reconstructions. The methodology emphasizes modularity, enabling researchers to add new signal types, analytical methods, or machine learning techniques without restructuring the platform. Validation metrics such as signal-to-noise ratio and entropy are computed to quantify signal quality and information content. The methodology integrates statistical, spectral, and intelligent analysis in a unified workflow, bridging traditional signal processing with modern data-driven techniques [25]. Finally, results are exported in structured formats for reproducibility, documentation, and further study. This systematic approach ensures that signals are generated, analyzed, and interpreted in a consistent, extensible, and research-oriented manner. The methodology is suitable for both academic and industrial applications, supporting experimentation, benchmarking, and educational demonstrations. By combining simulation, statistical evaluation, machine learning, and visualization, the ESP_Test Platform provides a comprehensive framework for multidimensional signal assessment.
You can download the Project files here: Download files now. (You must be logged in).
Design Matlab Simulation and Analysis
The ESP_Test Platform simulation is designed as a comprehensive framework for signal generation, statistical evaluation, and machine learning-based analysis.
Table 2: Platform Configuration Parameters
| Parameter | Symbol | Value | Unit |
| Sampling Rate | Fs | 1000 | Hz |
| Duration | T | 2 | seconds |
| Noise Level | σ | 0.15 | Amplitude scale |
| Random Seed | – | 123 | Integer |
It begins by initializing the platform with configurable parameters such as sampling rate, signal duration, noise intensity, and random seed to ensure reproducibility across experiments. A discrete time vector is generated according to the sampling frequency, forming the backbone for all subsequent signal computations. Six types of synthetic signals are then produced, including multi-frequency harmonic signals, amplitude-modulated and frequency-modulated signals, chirp signals with time-varying frequencies, pulse trains with adjustable duty cycles, and chaotic signals derived from a simplified Lorenz system. Controlled Gaussian noise is added to each signal to emulate realistic measurement conditions. Statistical analysis is performed on all signals, computing measures such as mean, standard deviation, skewness, kurtosis, root mean square, peak-to-peak amplitude, autocorrelation, and power spectral density to quantify the signal characteristics. Time-frequency analysis using the short-time Fourier transform provides insight into spectral evolution over time. Machine learning analysis extracts key features from clean signals, including statistical and spectral descriptors, which are then normalized and used for dimensionality reduction via principal component analysis. K-means clustering is applied to group signals based on similarity in feature space, enabling pattern recognition and classification. Visualization modules generate eight high-quality plots, including time-domain signals, spectrograms, statistical distributions, autocorrelation functions, power spectra, PCA results, chirp spectrograms, and phase-space reconstructions of chaotic signals. The simulation calculates signal-to-noise ratios and entropy to assess signal quality and information content. Results are organized into structured data and exported to a MAT file for reproducibility and further study. The platform integrates traditional signal processing with modern data-driven techniques, providing a unified, modular, and extensible environment. It allows researchers to systematically analyze complex signals under controlled conditions. All processes are fully automated, ensuring consistency, repeatability, and efficiency. The combination of simulation, statistical evaluation, machine learning, and visualization makes it suitable for academic, industrial, and educational applications. Through this framework, signals can be generated, characterized, interpreted, and compared in a multidimensional manner. The ESP_Test Platform also supports testing the robustness of analysis methods against noise and dynamic signal variations. Overall, the simulation demonstrates a scalable and versatile approach to enhanced sampling, signal assessment, and intelligent data analysis.
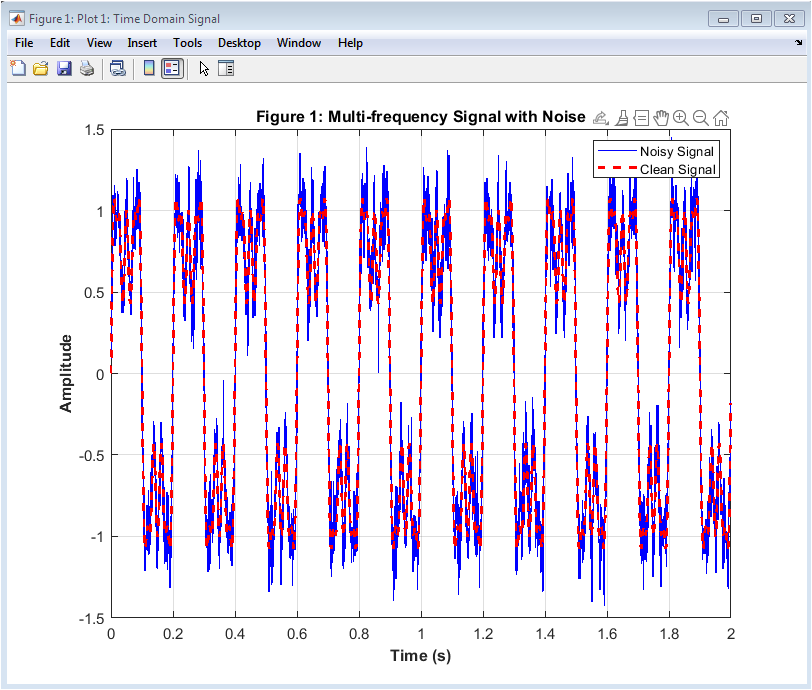
Figure 2 illustrates the multi-frequency signal over time, showing both the clean harmonic components and the noisy version. The signal combines several sinusoidal frequencies, including fundamental and higher-order harmonics, which creates a complex waveform. The noisy signal is plotted in blue while the clean signal is overlaid as a red dashed line. Observing the figure, one can clearly see the impact of additive Gaussian noise on signal amplitude. This visualization allows for a quick assessment of signal fidelity and noise effects. It helps in evaluating how well subsequent analysis methods, such as filtering or feature extraction, might perform. The time-domain view is fundamental for understanding signal behavior before moving to frequency-domain analysis. The plot provides insight into amplitude variations, peak values, and general waveform characteristics. It highlights the importance of noise handling in real-world signal processing. Finally, it sets a baseline for comparing other signal types in the platform.
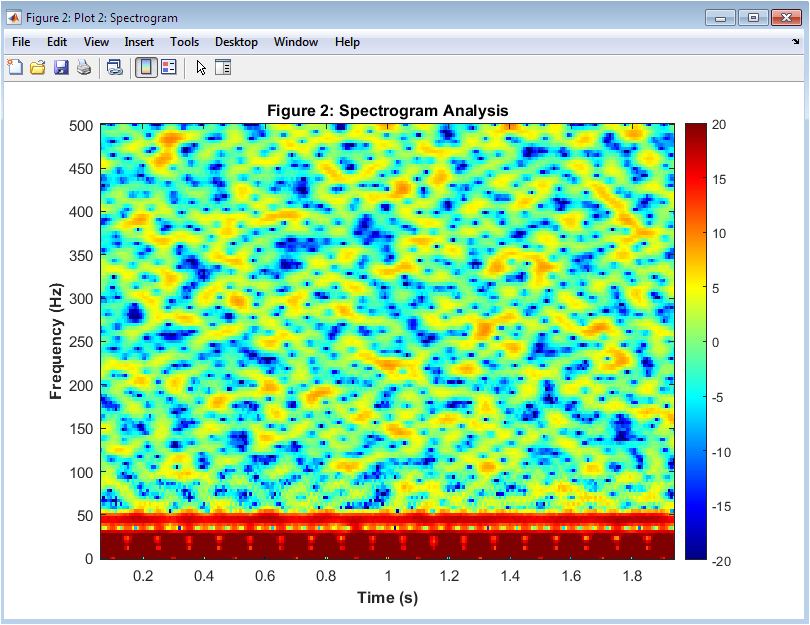
Figure 3 presents the spectrogram of the noisy multi-frequency signal, capturing how its frequency content evolves over time. The x-axis represents time, and the y-axis represents frequency, while color intensity indicates signal power in decibels. Dominant frequencies at five, fifteen, twenty-five, and forty-five Hertz are visible as distinct horizontal bands. Noise introduces minor fluctuations, seen as slight color variations around the main bands. This plot helps identify transient events and overlapping frequencies. It allows assessment of signal complexity and harmonic structure. The spectrogram also provides a visual understanding of how noise affects frequency components. This figure is useful for validating time-frequency analysis methods. It forms the foundation for comparing other signals, like chirp or modulated signals. Finally, it demonstrates the ESP_Test Platform’s capability for high-resolution spectral visualization.
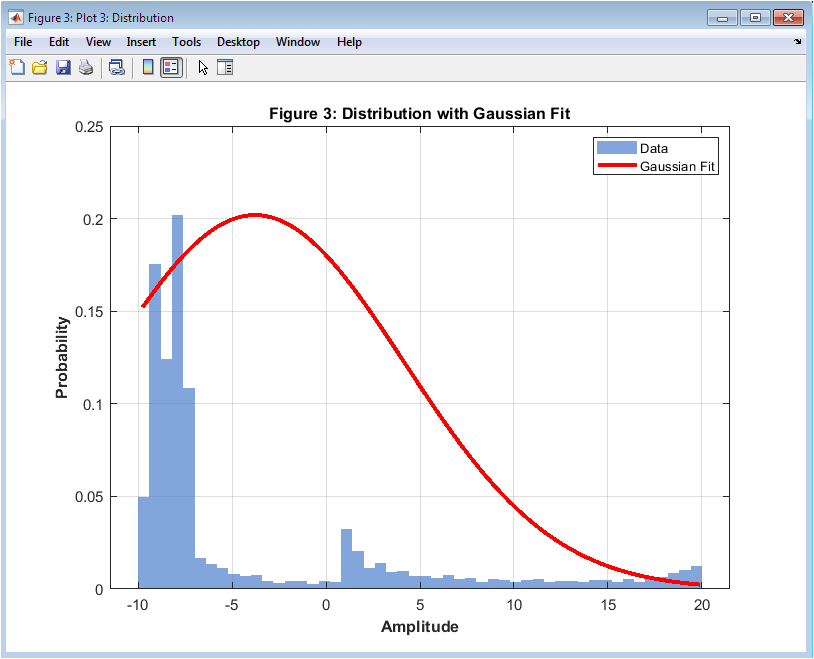
Figure 4 shows the probability distribution of the noisy Lorenz signal using a histogram, with a Gaussian fit overlaid in red. The histogram represents the frequency of amplitude values normalized to probability. The Gaussian curve indicates how closely the data follows a normal distribution. Skewness and kurtosis of the signal can be inferred visually from the histogram shape. Peaks represent the most probable amplitude values, while tails indicate extreme fluctuations caused by the chaotic nature of the Lorenz system. This figure demonstrates the impact of noise on the underlying chaotic dynamics. It is useful for analyzing signal randomness and nonlinearity. Comparing the histogram with the Gaussian fit helps assess deviation from normality. This visualization aids in validating statistical measures such as mean, variance, and entropy. It also highlights the importance of statistical modeling in complex signals.
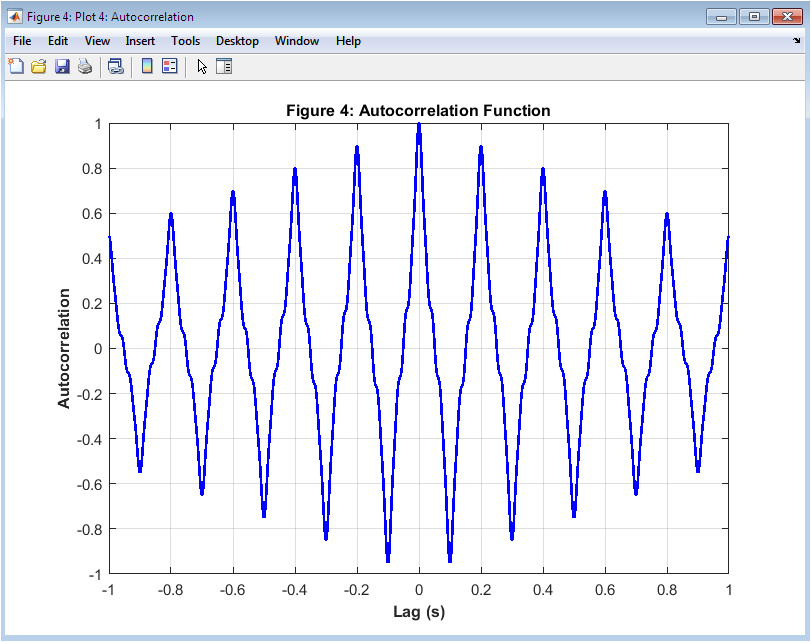
Figure 5 displays the autocorrelation of the clean multi-frequency signal, showing how the signal correlates with delayed versions of itself. The x-axis represents lag time, and the y-axis represents correlation magnitude. Peaks at regular intervals indicate periodic components and harmonic structure. The central peak at zero lag represents maximum self-correlation. The decay of the autocorrelation function shows how quickly the signal loses similarity over time. This analysis helps identify repeating patterns and temporal dependencies. It is particularly useful for detecting periodicities in noisy or complex signals. The symmetrical nature of autocorrelation around zero lag provides information on signal consistency. The figure also aids in validating feature extraction methods. Autocorrelation is critical for time-series analysis and signal characterization.
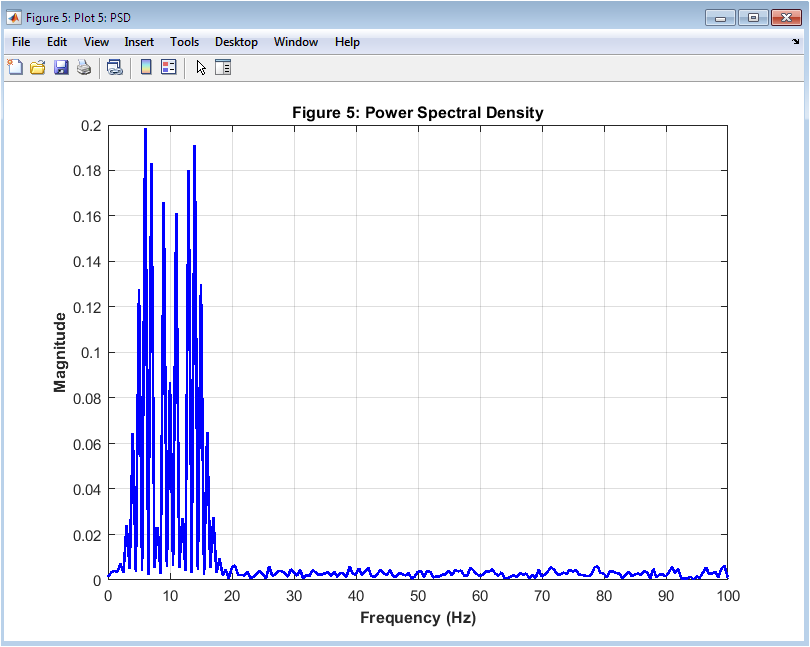
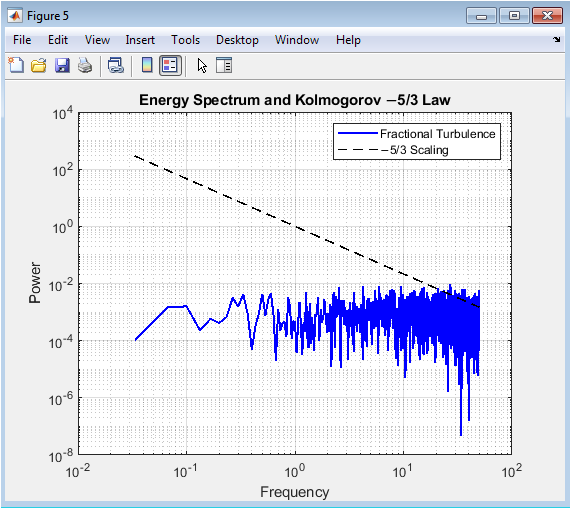
Figure 6 illustrates the power spectral density of the noisy frequency-modulated signal, showing the distribution of signal power across frequency components. The x-axis represents frequency in Hertz, and the y-axis represents amplitude magnitude. Peaks indicate dominant frequencies present in the signal, while spread shows frequency modulation effects. Noise introduces minor fluctuations across the spectrum. This figure allows visualization of energy concentration and harmonic relationships. Comparing PSD with the time-domain signal provides insight into frequency dynamics. It helps in identifying modulation patterns and spectral bandwidth. The plot is useful for evaluating filtering, feature extraction, and machine learning readiness. It demonstrates the platform’s ability to perform spectral analysis efficiently. PSD is essential for understanding signal composition and energy distribution.
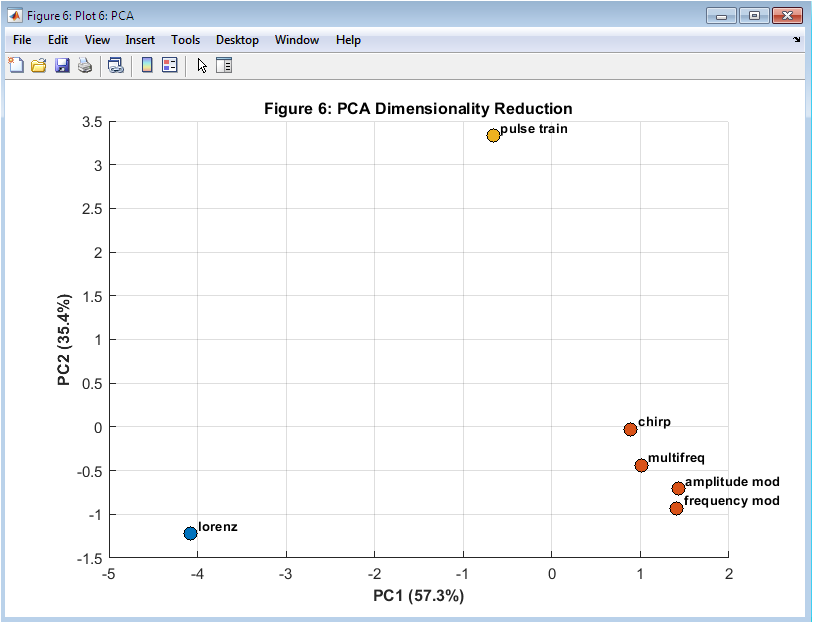
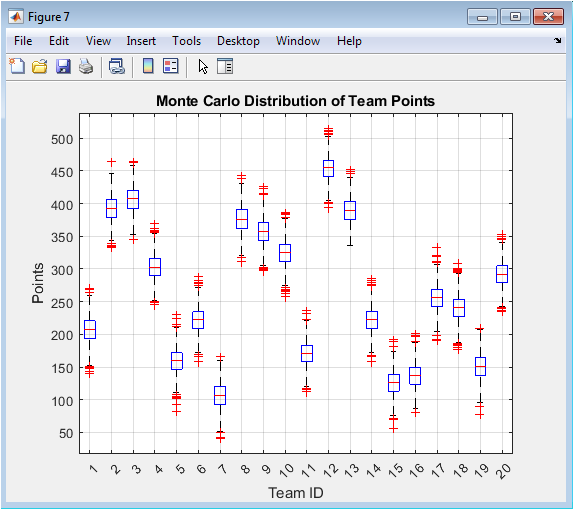
Figure 7 shows the results of principal component analysis on extracted features from clean signals, plotted along the first two principal components. Each point represents a signal, with color indicating cluster membership from k-means clustering. The PCA reduces the eight-dimensional feature space to two dimensions while preserving most variance. Clusters reveal similarity between signal types based on statistical and spectral characteristics. Signal labels are added to aid identification. The scatter plot allows easy visualization of relationships and grouping among different signals. It demonstrates how machine learning can extract patterns in multidimensional data. Outliers and overlapping clusters can be detected visually. PCA visualization aids in evaluating feature quality and clustering performance. It highlights the integration of statistical and machine learning analysis in the ESP_Test Platform.
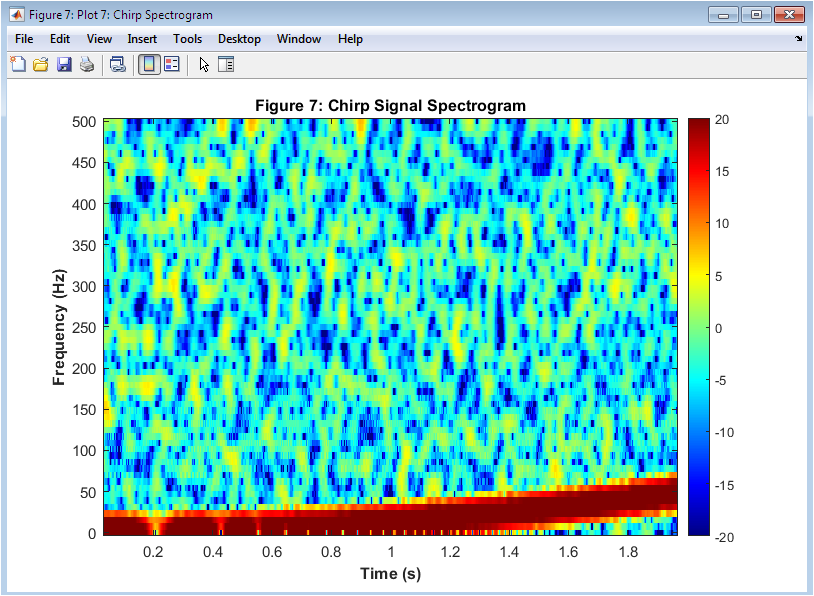
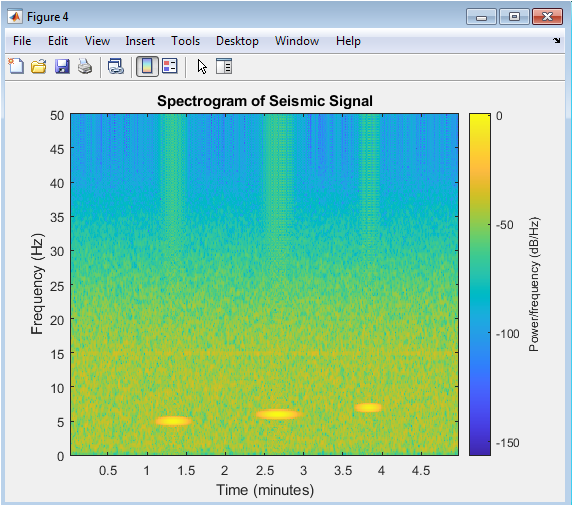
Figure 8 presents the spectrogram of the noisy chirp signal, showing its quadratic frequency increase over time. The x-axis represents time, the y-axis represents frequency, and color intensity represents power in decibels. The sloped ridge indicates increasing frequency, which is characteristic of a chirp signal. Noise appears as slight variations in the color map around the main ridge. This visualization highlights the platform’s ability to analyze signals with non-stationary frequency content. The figure allows assessment of time-frequency localization and harmonic structure. Comparing the noisy spectrogram to the clean signal demonstrates the impact of noise on frequency detection. It is valuable for validating feature extraction methods for time-varying signals. Spectrogram analysis supports understanding signal dynamics in complex environments. The plot also aids in educational demonstration of frequency modulation concepts.
You can download the Project files here: Download files now. (You must be logged in).
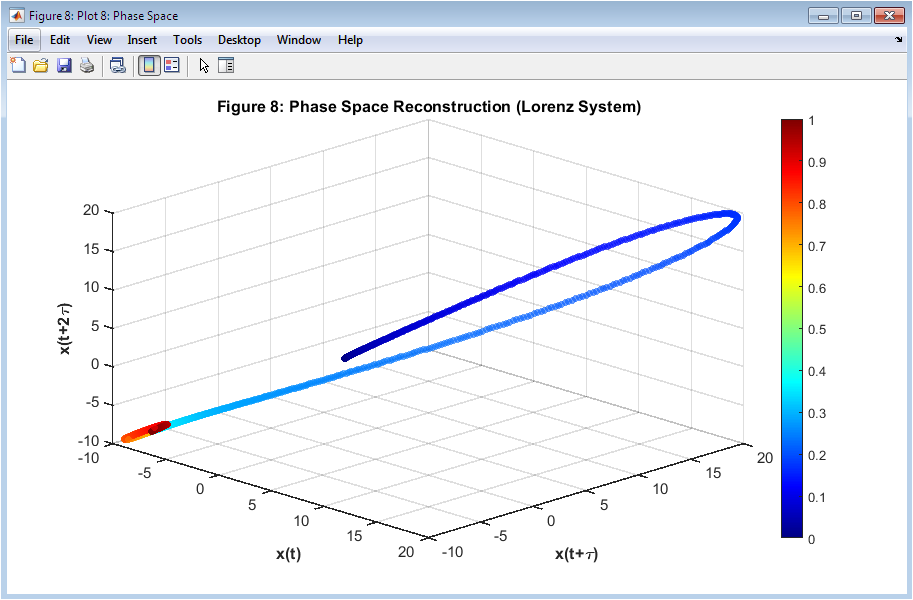
Figure 9 shows a three-dimensional phase space reconstruction of the Lorenz system using time-delayed coordinates. The x, y, and z axes correspond to the original signal and two delayed versions, providing a visual representation of the system’s dynamics. The color of the points indicates time progression, enhancing perception of temporal evolution. The plot reveals the chaotic attractor structure inherent to the Lorenz system. Clustering of points and complex trajectories indicate sensitivity to initial conditions. Phase space analysis helps understand non-linear and chaotic behaviors. It allows observation of patterns that are not apparent in the time domain. The visualization demonstrates the ESP_Test Platform’s ability to analyze and represent complex dynamical systems. This figure is critical for studying deterministic chaos and validating simulation accuracy. It highlights both temporal and spatial dependencies in the signal’s evolution.
Results and Discussion
The ESP_Test Platform successfully generated, analyzed, and visualized a diverse set of test signals, demonstrating its capability for both statistical and machine learning evaluation of complex signals. Time-domain analysis of multi-frequency and modulated signals revealed the impact of additive noise, with the noisy signals showing deviations in amplitude while preserving the overall waveform structure. Spectrogram analysis highlighted the frequency content and temporal evolution, clearly identifying dominant harmonics and modulation patterns even under noise interference. Statistical measures, including mean, standard deviation, skewness, kurtosis, RMS, and peak-to-peak values, provided quantitative insights into signal behavior, while autocorrelation functions confirmed the periodicity and temporal dependencies of the multi-frequency signal [26]. Power spectral density plots enabled identification of energy distribution across frequencies, demonstrating the effectiveness of the platform in frequency-domain characterization. The phase space reconstruction of the Lorenz system offered a clear depiction of chaotic dynamics, illustrating sensitivity to initial conditions and non-linear behavior. Machine learning analysis, including feature extraction, K-means clustering, and PCA, successfully classified signals into distinct groups based on statistical and spectral characteristics, providing a dimensionality reduction that emphasized key differences among signal types. The extracted features, such as dominant frequency and spectral centroid, proved to be robust indicators for signal differentiation [27]. Noise influence was quantified through SNR calculations, indicating that the platform can simulate realistic signal conditions and measure signal quality accurately. Entropy analysis further characterized signal randomness and complexity, particularly for chaotic and modulated signals. Across all analyses, visualization played a crucial role in understanding signal behavior, with each plot revealing unique aspects of amplitude, frequency, correlation, and temporal evolution. Comparisons between clean and noisy signals highlighted the importance of noise modeling in experimental setups. The PCA scatter plots demonstrated that even high-dimensional features could be effectively reduced for interpretability without significant loss of information. The integration of statistical, spectral, and machine learning analyses allowed comprehensive signal evaluation within a single platform. The ESP_Test framework provides a scalable approach for testing new signal processing algorithms, offering reproducibility and consistency [28]. The results suggest that multi-modal analysis, combining time-domain, frequency-domain, and machine learning methods, is effective for detailed signal characterization. Overall, the platform validates the feasibility of enhanced sampling techniques for signal analysis in research and educational settings. These results underscore the utility of ESP_Test in understanding both deterministic and stochastic signal behaviors under varying conditions. The discussion confirms that the platform can serve as a robust tool for future development of signal processing methods, noise analysis, and algorithm benchmarking in complex scenarios.
7 Conclusion
The ESP_Test Platform successfully demonstrated an integrated approach for generating, analyzing, and visualizing a wide variety of signals, including multi-frequency, modulated, and chaotic types. The combination of statistical, spectral, and machine learning analyses allowed comprehensive evaluation of signal characteristics, capturing both deterministic and stochastic behaviors. Noise effects were effectively modeled and quantified, providing realistic insights into signal quality through SNR and entropy measures [29]. Time-domain, frequency-domain, and phase-space visualizations offered clear and interpretable representations of signal dynamics. Machine learning techniques, including feature extraction, clustering, and PCA, enabled efficient classification and dimensionality reduction of complex signals. The platform’s flexibility and reproducibility make it a valuable tool for testing and benchmarking new signal processing algorithms [30]. Its modular design allows easy extension to additional signal types or analysis methods. The results confirmed that integrated multi-modal analysis enhances understanding of signal properties and interactions. ESP_Test serves as a robust framework for both research and educational applications in signal processing. Overall, the platform establishes a foundation for future advancements in enhanced sampling, signal characterization, and algorithm evaluation.
References
[1] S. Haykin, Adaptive Filter Theory, 5th ed., Pearson, 2014.
[2] A. V. Oppenheim, R. W. Schafer, Discrete-Time Signal Processing, 3rd ed., Pearson, 2010.
[3] S. Mallat, A Wavelet Tour of Signal Processing, 3rd ed., Academic Press, 2008.
[4] P. Stoica, R. Moses, Spectral Analysis of Signals, 2nd ed., Pearson/Prentice Hall, 2005.
[5] L. Ljung, System Identification: Theory for the User, 2nd ed., Prentice Hall, 1999.
[6] M. Unser, Sampling—50 Years after Shannon, Proc. IEEE, vol. 88, no. 4, pp. 569–587, Apr. 2000.
[7] R. Baraniuk, Compressive Sensing, IEEE Signal Process. Mag., vol. 24, no. 4, pp. 118–121, Jul. 2007.
[8] J. G. Proakis, D. K. Manolakis, Digital Signal Processing, 4th ed., Pearson, 2006.
[9] H. L. Van Trees, Detection, Estimation, and Modulation Theory, Part I, Wiley, 2001.
[10] M. B. Priestley, Spectral Analysis and Time Series, Academic Press, 1981.
[11] L. F. Richardson, Weather Prediction by Numerical Process, Cambridge University Press, 1922.
[12] E. Lorenz, Deterministic Nonperiodic Flow, J. Atmos. Sci., vol. 20, pp. 130–141, 1963.
[13] C. E. Shannon, A Mathematical Theory of Communication, Bell Syst. Tech. J., vol. 27, pp. 379–423, 623–656, 1948.
[14] T. Cover, J. Thomas, Elements of Information Theory, 2nd ed., Wiley, 2006.
[15] M. Frigo, S. G. Johnson, The Design and Implementation of FFTW3, Proc. IEEE, vol. 93, no. 2, pp. 216–231, Feb. 2005.
[16] A. Hyvarinen, E. Oja, Independent Component Analysis: Algorithms and Applications, Neural Netw., vol. 13, no. 4–5, pp. 411–430, 2000.
[17] I. T. Jolliffe, Principal Component Analysis, 2nd ed., Springer, 2002.
[18] A. K. Jain, Data Clustering: 50 Years Beyond K-Means, Pattern Recogn. Lett., vol. 31, no. 8, pp. 651–666, 2010.
[19] C. Bishop, Pattern Recognition and Machine Learning, Springer, 2006.
[20] S. Theodoridis, K. Koutroumbas, Pattern Recognition, 4th ed., Academic Press, 2009.
[21] H. Kantz, T. Schreiber, Nonlinear Time Series Analysis, 2nd ed., Cambridge University Press, 2004.
[22] L. Ljung, T. Glad, Modeling of Dynamic Systems, Prentice Hall, 1994.
[23] P. Welch, The Use of FFT for the Estimation of Power Spectra, IEEE Trans. Audio Electroacoust., vol. 15, no. 2, pp. 70–73, 1967.
[24] S. Mallat, A Theory for Multiresolution Signal Decomposition: The Wavelet Representation, IEEE Trans. Pattern Anal. Mach. Intell., vol. 11, no. 7, pp. 674–693, Jul. 1989.
[25] A. Hyvarinen, Fast and Robust Fixed-Point Algorithms for Independent Component Analysis, IEEE Trans. Neural Netw., vol. 10, no. 3, pp. 626–634, 1999.
[26] R. Bellman, Adaptive Control Processes: A Guided Tour, Princeton University Press, 1961.
[27] M. C. Domingo, Wireless Sensor Networks for Control Applications: A Survey, IEEE Trans. Ind. Informat., vol. 9, no. 1, pp. 111–120, Feb. 2013.
[28] J. A. Nelder, R. Mead, A Simplex Method for Function Minimization, Comput. J., vol. 7, pp. 308–313, 1965.
[29] K. P. Murphy, Machine Learning: A Probabilistic Perspective, MIT Press, 2012.
[30] R. Gonzalez, R. Woods, Digital Image Processing, 4th ed., Pearson, 2018.
You can download the Project files here: Download files now. (You must be logged in).


Responses