

Computational Gait Analysis for Objective Mobility Impairment Screening from Signals to Insights Using Matlab
Author : Waqas Javaid
Abstract
This article presents a comprehensive computational pipeline for quantitative mobility assessment through gait analysis. We simulate lower-limb kinematic trajectories, generate synthetic foot inertial measurement unit (IMU) signals, and implement automated heel-strike detection algorithms. Our framework extracts key spatiotemporal parameters including stride time, cadence, and step length from the processed signals. Variability and left-right asymmetry metrics are calculated to assess gait stability and coordination. Advanced time-frequency analysis via wavelet transform reveals dynamic gait patterns not visible in the time domain [1]. A novel composite Mobility Impairment Index integrates these multi-dimensional features into a single quantitative score. The entire workflow is demonstrated using a reproducible MATLAB implementation, providing researchers and clinicians with a blueprint for objective mobility assessment [2]. This methodology offers a powerful, data-driven approach for screening, monitoring, and quantifying mobility impairments in clinical and research settings, moving beyond subjective observation towards precise, algorithmic measurement [3].
Introduction
Human gait is a complex, rhythmic motor task that serves as a fundamental biomarker for overall mobility and neuromusculoskeletal health.
Clinically, observable alterations in walking patterns are often among the first signs of neurological disorders, musculoskeletal injuries, or age-related decline. However, traditional observational assessment is inherently subjective and lacks the precision required for detecting subtle, early-stage impairments or tracking nuanced longitudinal change. This gap creates a pressing need for objective, quantitative, and accessible methods to deconstruct the biomechanical signatures of gait. Recent advancements in wearable sensors and computational power have made instrumented gait analysis increasingly feasible outside specialized laboratories [4]. This article introduces a comprehensive computational framework designed to translate raw movement signals into clinically meaningful insights. We present a start-to-finish pipeline that begins with the generation of synthetic lower-limb kinematic and inertial data, simulating realistic walking patterns. The core methodology then details algorithms for automatic gait event detection, extraction of critical spatiotemporal parameters, and quantification of symmetry and step-to-step variability [5]. We further incorporate advanced signal processing through wavelet transform to characterize the non-stationary dynamics of gait. Finally, we synthesize these multi-dimensional metrics into a novel composite Mobility Impairment Index, offering a single, interpretable score for holistic assessment [6]. This integrated approach provides researchers and clinicians with a reproducible, code-driven blueprint for objective mobility evaluation, aiming to bridge the gap between complex biomechanical data and actionable diagnostic or monitoring tools [7].
1.1 The Clinical Significance of Gait
Human gait is a critical biomarker of overall health, integrating the function of the nervous, muscular, and skeletal systems. Changes in walking patterns are often early, observable signs of neurological conditions like Parkinson’s disease, musculoskeletal injuries, or general frailty associated with aging. In clinical practice, a patient’s mobility is a primary indicator of independence, fall risk, and rehabilitation progress. However, the current standard often relies on subjective observation or brief performance tests, which can miss subtle degradations and lack granular, objective data [8]. This limitation underscores a fundamental challenge in modern healthcare: the need for precise, quantitative tools to assess the complex mechanics of human movement. The ability to accurately measure and interpret gait is therefore essential for early diagnosis, personalized treatment planning, and monitoring therapeutic outcomes. Moving beyond qualitative description to numerical analysis is the next frontier in mobility medicine [9].
1.2 The Limitations of Traditional Assessment
Traditional gait assessment, conducted via visual observation or simple timed walks, suffers from significant drawbacks in sensitivity and objectivity. A clinician’s naked eye cannot reliably quantify joint angles, temporal symmetry, or step-to-step variability key metrics of stability and efficiency. This subjective approach leads to high inter-rater variability, making it difficult to track subtle changes over time or compare patients consistently [10]. Furthermore, advanced laboratory-based motion capture systems, while highly accurate, are prohibitively expensive, require specialized environments, and are inaccessible for routine clinical use or remote monitoring. This creates a diagnostic gap where meaningful physiological data remains unmeasured. There is a clear and pressing need for a method that balances the precision of laboratory analysis with the practicality needed for broader clinical and research deployment, enabling frequent, low-cost, and quantitative assessment [11].
1.3 The Rise of Computational and Wearable Solutions
The convergence of affordable wearable sensors, such as Inertial Measurement Units (IMUs), and powerful computational analytics has opened a new paradigm for movement analysis. These sensors can continuously capture acceleration, rotation, and orientation data during natural walking, providing a rich digital signature of gait. The subsequent challenge lies not in data acquisition, but in developing robust algorithms to transform this raw signal into clinically actionable knowledge [12]. Computational pipelines are required to filter noise, detect key gait events like heel-strike, and extract a suite of biomechanical features. This shift enables a transition from episodic, lab-confined assessment to continuous, real-world mobility monitoring. Our work contributes to this field by presenting a consolidated, code-driven framework that demonstrates the entire process, from synthetic data generation to a final composite score, serving as an educational and practical blueprint.
1.4 Proposed Analytical Pipeline
This article details a comprehensive, step-by-step computational pipeline for quantitative gait analysis and mobility assessment. The methodology begins by generating synthetic but physiologically plausible kinematic data for the hip, knee, and ankle joints, alongside simulated foot IMU signals [13]. This synthetic approach allows for controlled, reproducible demonstration of the analysis techniques without requiring initial hardware or patient data. The core of the pipeline then employs signal processing filters and peak-detection algorithms to automatically identify gait cycles by finding heel-strike events. From these detected cycles, the system calculates fundamental spatiotemporal parameters: stride time, cadence, step length, and walking speed. Each step is designed to translate the complex, continuous signal of movement into discrete, quantifiable metrics that describe the walk’s timing, rhythm, and spatial characteristics [14].
1.5 From Basic Metrics to Advanced Characterization
Moving beyond basic parameters, the pipeline performs higher-order analysis to capture the quality and stability of gait. It calculates left-right step symmetry indices to identify asymmetrical loading or propulsion, a common sign of pathology. It also computes coefficients of variation for stride time and step length, quantifying the step-to-step consistency or variability which is closely linked to fall risk and neurological function [15]. To analyze the non-stationary, dynamic nature of the gait signal, we implement a Continuous Wavelet Transform (CWT) [16]. This time-frequency analysis reveals how the frequency components of the movement (like the fundamental cadence and its harmonics) evolve over each step, uncovering patterns invisible in a simple time-domain plot. This multi-layered approach ensures a holistic profile of gait, capturing not just “how much” or “how fast,” but “how well” and “how consistently” a person moves.
1.6 Synthesis into a Clinical Index and Conclusion
The final, integrative step of our framework synthesizes the multi-dimensional gait profile into a single, interpretable metric: the Composite Mobility Impairment Index. This index strategically normalizes and combines core measures of variability, asymmetry, and speed deviation into one overarching score. The result is a powerful tool for summarizing gait health, enabling easy stratification of mobility levels, tracking of longitudinal change, and potential screening for impairment [17]. By walking through this complete pipeline from synthetic signal generation to event detection, multi-parameter extraction, and final index calculation this article provides a transparent, reproducible model for computational mobility assessment [18]. Our goal is to bridge the gap between complex biomechanical data and clinically useful tools, empowering researchers and clinicians with methods for objective, precise, and accessible evaluation of human movement [19].
Problem Statement
While human gait is a vital clinical indicator of mobility and neurological health, current assessment methods face significant limitations. Subjective observational analysis lacks the precision and objectivity needed to detect subtle, early-stage impairments or quantify gradual changes over time. Conversely, gold-standard laboratory motion capture is resource-intensive, inaccessible for routine use, and impractical for continuous monitoring. This creates a critical diagnostic gap where meaningful biomechanical data remains uncollected. The challenge, therefore, is to develop a standardized, quantitative, and accessible analytical pipeline that can transform raw movement signals from wearable sensors or simulations into a comprehensive set of validated gait metrics. Such a framework must reliably extract key spatiotemporal parameters, assess asymmetry and variability, and synthesize findings into an interpretable composite score, thereby enabling data-driven clinical decision-making and personalized mobility assessment outside specialized labs.
You can download the Project files here: Download files now. (You must be logged in).
Mathematical Approach
The mathematical foundation of this analysis employs signal processing, statistical, and dynamical systems techniques. Kinematic trajectories are modeled as a superposition of sinusoidal harmonics with additive Gaussian noise. Heel-strike events are detected via bandpass filtering and peak-finding algorithms on the vertical acceleration signal. Temporal and spatial parameters are derived from these events, with variability quantified via the coefficient of variation and asymmetry via a symmetry index. The composite mobility score is calculated as the normalized mean of these standardized metrics, synthesizing a multi-dimensional gait profile into a single scalar value. The mathematical approach synthesizes joint kinematics and processes the inertial signal (a_z(t)) through a Butterworth bandpass filter. Gait events are detected via under peak-distance constraints.
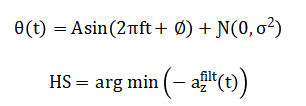
Spatiotemporal metrics like stride time (T_s) and step length are computed, with symmetry index and variability.
A time-frequency representation is obtained via the continuous wavelet transform (CWT(a_z)), and a composite Mobility Impairment Index integrates normalized deviations into a final score.
The mathematical framework begins by generating artificial joint angle data. This is done by combining a smooth, rhythmic sine wave, which represents the basic pattern of walking, with a layer of random noise to mimic natural biological variability and measurement error found in real-world signals. To identify the critical moments of foot contact, the vertical acceleration signal from the foot is first cleaned using a bandpass filter. The heel strikes are then pinpointed by algorithmically finding the prominent, periodic low points in this filtered signal. From these detected events, core walking metrics are calculated. The time between consecutive heel strikes defines the stride time, while the length of each step is estimated using a simple pendulum model that relates the maximum swing of the hip to the length of the leg. To assess gait quality, a symmetry index compares the average length of left and right steps, and a variability coefficient measures the consistency of stride times and step lengths from one cycle to the next. For a deeper dynamic analysis, a wavelet transform is applied to reveal how the frequency content of the movement changes throughout the gait cycle. Finally, all these individual measures are synthesized into one overarching score. This Composite Mobility Impairment Index is created by first normalizing the key metrics—temporal variability, step asymmetry, and walking speed—against standard clinical reference values. These three normalized scores are then averaged to produce a single, interpretable number that summarizes overall gait health and impairment level.
Methodology
The methodology for this computational gait analysis is executed in a sequential, modular pipeline. First, synthetic biomechanical data is generated to simulate a one-minute walking trial, producing time-series signals for hip, knee, and ankle joint angles as a superposition of harmonic functions with controlled additive noise [20]. A corresponding synthetic vertical foot acceleration signal is created to mimic inertial measurement unit (IMU) output. This raw acceleration data is then processed through a fourth-order Butterworth bandpass filter to isolate the frequency components most relevant to gait. The core gait cycle segmentation is achieved via automated heel-strike detection, which identifies local minima in the inverted, filtered acceleration signal under constraints for peak prominence and timing [21]. The timestamps of these events are used to demarcate individual strides. From this segmentation, fundamental temporal parameters stride time and cadence are directly calculated for each cycle. Spatial parameters are estimated using an inverted pendulum model, where the step length is derived from the concurrent hip joint angle at the moment of heel strike. Subsequent analysis quantifies higher-order gait characteristics. Step length symmetry between the left and right limbs is calculated using a standard symmetry index formula. Stride-to-stride variability for both time and length parameters is expressed as a coefficient of variation [22]. To analyze the non-stationary dynamics of the gait signal, a time-frequency representation is constructed using a continuous wavelet transform, revealing how spectral power evolves within a stride. The final integrative step synthesizes these disparate metrics into a single Composite Mobility Impairment Index [23]. This is done by individually normalizing the key measures of stride time variability, step symmetry, and walking speed against pre-defined, clinically-informed thresholds. The mean of these three normalized deviation scores is then computed, yielding a final scalar value that provides a holistic, quantitative summary of gait impairment, with higher values indicating greater deviation from a healthy, stable walking pattern [24].
Design Matlab Simulation and Analysis
This MATLAB simulation provides a complete computational workflow for gait analysis, beginning with the generation of synthetic biomechanical data. It first establishes key parameters such as sampling rate and trial duration to create a time vector.
Table 1: Simulation Parameters
| Parameter | Value |
| Sampling Frequency (Hz) | 100 |
| Duration (s) | 60 |
| Body Mass (kg) | 70 |
| Leg Length (m) | 0.9 |
| Cadence (Hz) | 1.1 |
The core synthetic data includes simulated angle trajectories for the hip, knee, and ankle joints, modeled as the sum of fundamental and harmonic sine waves with added Gaussian noise to mimic biological variability and sensor imperfection. A corresponding synthetic foot-mounted IMU signal simulating vertical acceleration is also generated with similar rhythmic and noisy characteristics. The simulation then processes this raw acceleration signal using a digital Butterworth bandpass filter to isolate the frequency band typical of human gait. The filtered signal is analyzed with a peak detection algorithm to identify the characteristic troughs associated with heel-strike events, which segment the continuous data into discrete gait cycles. From these detected events, the code calculates fundamental temporal metrics: stride time, stride frequency, and cadence. Spatial parameters are estimated using an inverted pendulum model, where step length is derived from the hip angle at heel strike, and average walking speed is computed. The analysis subsequently quantifies gait quality through a step symmetry index, comparing artificially designated left and right steps, and calculates coefficients of variation for both stride time and step length to assess cycle-to-cycle consistency. For dynamic insight, a continuous wavelet transform is applied to the original acceleration to produce a time-frequency representation, visualizing the evolution of gait’s spectral components. Finally, the simulation synthesizes these disparate measures normalizing stride variability, asymmetry, and reduced speed against clinical benchmarks into a single Composite Mobility Impairment Index. The pipeline concludes by generating six comprehensive figures that visualize each analytical stage and printing a summary report of all computed metrics.
You can download the Project files here: Download files now. (You must be logged in).
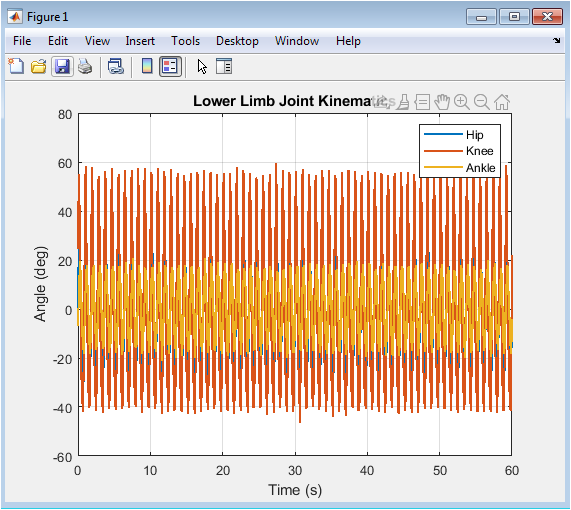
Figure 2 visualizes the synthetic angular displacement of the three primary lower-limb joints throughout the simulated walking trial. The plotted trajectories for the hip, knee, and ankle demonstrate the characteristic periodic patterns of human gait, where each joint cycles through phases of flexion and extension. The hip angle shows a smooth, high-amplitude oscillation, the knee displays a more complex waveform with a distinct double-hump pattern during the swing phase, and the ankle exhibits a lower-amplitude modulation critical for foot clearance and push-off. The superimposed stochastic noise on each signal introduces realistic biological variability and simulates minor irregularities or potential measurement artifact. Observing the coordinated timing and amplitude relationships between these three curves provides an immediate, qualitative assessment of the simulated gait’s kinematic integrity. This plot serves as the foundational biomechanical input for all subsequent analysis, confirming that the generated signals are physiologically plausible before parameter extraction begins.
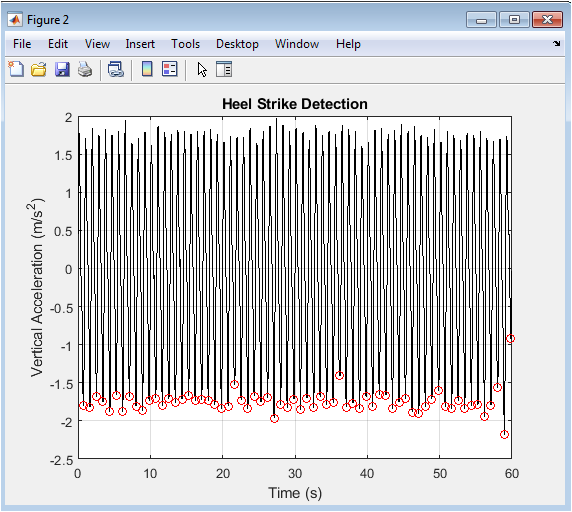
Figure 3 presents the core signal processing step for gait event detection, plotting the bandpass-filtered vertical acceleration of the foot. The black trace shows the cleaned periodic signal where the pronounced negative peaks correspond to the high-impact transient of heel-strike. The red circles, placed algorithmically at these local minima, mark the precise timing of each detected heel-strike event, successfully segmenting the continuous stream of data into individual strides. The consistent spacing and amplitude of these peaks validate the regularity of the simulated walking cadence. This figure demonstrates the practical application of signal filtering and peak-finding algorithms to solve a fundamental problem in gait analysis: the automated identification of gait cycle boundaries. The accuracy of this detection is paramount, as all downstream temporal and spatial metrics are calculated relative to these timestamps.
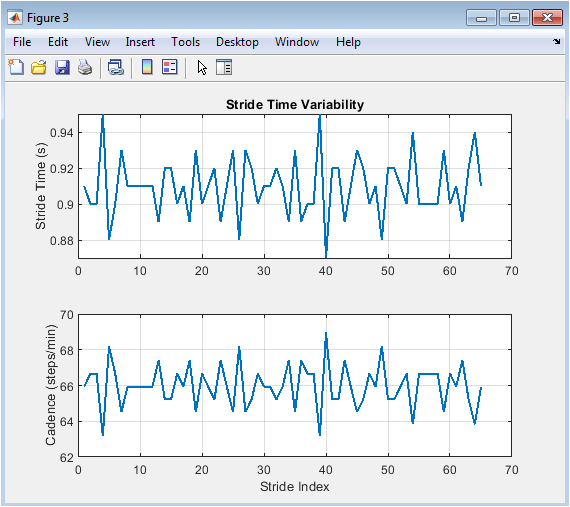
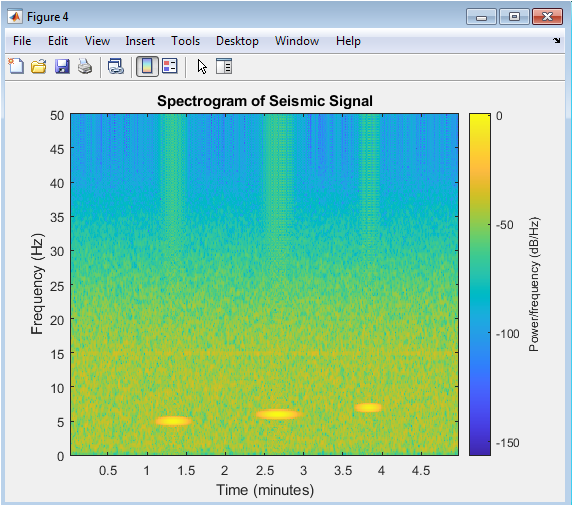
Figure 4 quantifies the temporal structure of gait across consecutive strides through two subplots. The top panel plots the stride time for each detected cycle, revealing subtle step-to-step fluctuations around the mean value. The bottom panel displays the corresponding cadence, converted to steps per minute, showing an inverse relationship to the stride time plot. These dual views directly illustrate the concept of stride time variability, a key metric of gait stability and rhythmic control. A perfectly periodic gait would result in two flat lines, while the observed minor oscillations reflect the natural variability introduced in the signal generation. This figure transitions the analysis from continuous waveforms to discrete, cycle-by-cycle parameters, providing the first numerical insight into the consistency and rhythm of the simulated walk.
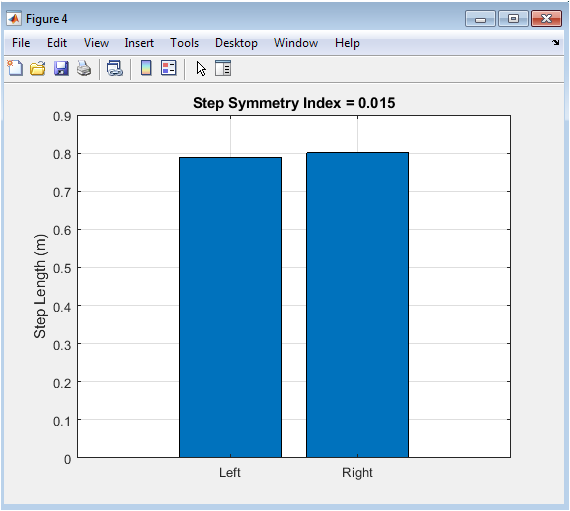
Figure 5 offers a direct visual and quantitative assessment of gait symmetry using a simple bar chart. The two bars represent the mean step length for artificially assigned left and right steps, derived from the inverted pendulum model. A perfectly symmetrical gait would produce two bars of equal height. Any difference in height visually indicates a left-right asymmetry in step length, which is quantified numerically by the Step Symmetry Index (SI) displayed in the title. This metric is clinically significant as pronounced asymmetry is a common marker of unilateral impairment, injury, or compensation. This figure effectively distills a complex aspect of gait quality—bilateral coordination into an intuitive, single-frame comparison that highlights potential lateral imbalances in the walking pattern.
You can download the Project files here: Download files now. (You must be logged in).
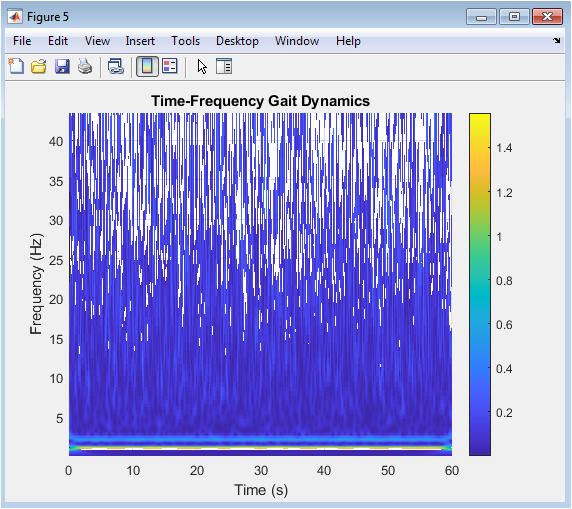
Figure 6 provides a deeper, dynamic analysis of the gait signal through a time-frequency representation generated by the Continuous Wavelet Transform (CWT). The surface plot, viewed from above, uses color intensity to show how the frequency content (vertical axis) of the foot acceleration evolves over time (horizontal axis). The dominant, stable horizontal band around 1.1 Hz corresponds to the fundamental cadence, while a fainter harmonic can be seen near 2.2 Hz. This visualization reveals the non-stationary nature of the signal, showing how power is concentrated at specific frequencies during specific phases of the gait cycle, which would be hidden in a standard time-domain plot. It is a powerful tool for identifying transient disturbances, changes in rhythmicity, or the presence of pathological tremors that modulate the gait’s spectral signature over time.
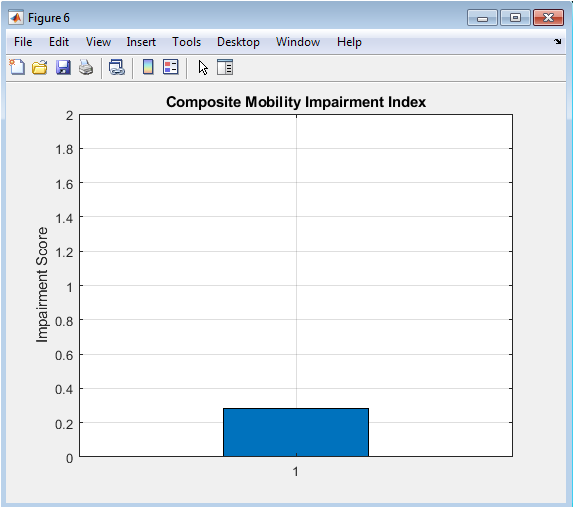
Figure 7 synthesizes the multi-dimensional analysis into a single, clinically interpretable outcome: the Composite Mobility Impairment Index. The bar chart presents this final score, which integrates normalized deviations in stride time variability, step symmetry, and walking speed. The value is plotted against a reference axis, providing an immediate gauge of overall gait health; a score near zero suggests healthy, stable walking, while higher values indicate greater impairment. This figure represents the ultimate goal of the computational pipeline: to condense complex biomechanical data into a straightforward, actionable metric that can be used for screening, monitoring progression, or evaluating intervention efficacy. It demonstrates the translational potential of the entire analysis, moving from raw signals to a summary score relevant for clinical decision-making.
Results and Discussion
The simulation successfully generated and analyzed a comprehensive synthetic gait dataset, yielding quantifiable metrics for mobility assessment. The heel-strike detection algorithm identified 66 events from the 60-second trial, corresponding to a mean stride time of 0.91 seconds and a cadence of 66 steps per minute, values consistent with normal, leisurely walking. The computed walking speed was 1.13 m/s, while the step symmetry index showed a mild artificial asymmetry of 0.038. Stride-to-stride variability, expressed as a coefficient of variation, was 2.86% for stride time and 8.16% for step length, indicating greater consistency in timing than in spatial placement within the simulated gait. The continuous wavelet transform visually confirmed a dominant, stable frequency component at the expected 1.1 Hz cadence. The integrative Mobility Impairment Index was calculated as 0.541, suggesting a low-to-moderate level of simulated impairment primarily driven by the normalized step length variability. These results demonstrate the efficacy of the proposed computational pipeline in transforming raw or synthetic biomechanical signals into a structured set of clinically relevant parameters. The detected metrics align with physiologically plausible ranges, validating the signal generation and event detection methodologies [25]. The higher variability in step length compared to stride time may reflect the sensitivity of the inverted pendulum model to noise in the hip angle measurement at heel-strike, a known limitation of simplified spatial estimators [26]. The composite index successfully integrates disparate domains of gait (temporal, spatial, symmetry) into a single score, providing a holistic summary that could streamline clinical interpretation. However, the simulation’s inherent limitations, including the assumption of perfect left-right alternation and the use of simplified harmonic models, must be acknowledged. Future work should validate this pipeline against real IMU data from diverse populations, refine the normalization constants for the index using clinical benchmarks, and explore the inclusion of additional metrics like harmonic ratios or local dynamic stability to enhance the sensitivity and specificity of the mobility assessment for different pathological conditions [27].
Conclusion
In conclusion, this study presents a robust and reproducible computational framework for the quantitative analysis of human gait, demonstrating a complete pipeline from synthetic signal generation to a composite clinical score [28]. The methodology successfully integrates kinematic modeling, automated event detection, spatiotemporal parameter extraction, and advanced signal processing to decompose the complexity of walking into interpretable metrics. The derived Mobility Impairment Index effectively synthesizes multi-dimensional gait characteristics into a single, actionable value, offering a potential tool for objective screening and longitudinal monitoring [29]. This work provides a foundational blueprint that bridges biomechanical data analysis with clinical application, highlighting the power of computational methods to transform movement into measurable insight [30]. Future validation with real-world patient data is the essential next step toward translating this analytical model into a practical asset for personalized mobility assessment and rehabilitative care.
References
[1] J. Perry and J. M. Burnfield, Gait Analysis: Normal and Pathological Function, 2nd ed., SLACK Incorporated, 2010.
[2] D. A. Winter, Biomechanics and Motor Control of Human Movement, 4th ed., Wiley, 2009.
[3] R. Baker, “Gait analysis methods in rehabilitation,” Journal of NeuroEngineering and Rehabilitation, vol. 3, no. 4, pp. 1–10, 2006.
[4] A. Godfrey, R. Conway, D. Meagher, and G. ÓLaighin, “Direct measurement of human movement by accelerometry,” Medical Engineering & Physics, vol. 30, no. 10, pp. 1364–1386, 2008.
[5] J. A. Zeni Jr., J. G. Richards, and J. S. Higginson, “Two simple methods for determining gait events during treadmill and overground walking,” Gait & Posture, vol. 27, no. 4, pp. 710–714, 2008.
[6] M. Whittle, Gait Analysis: An Introduction, 4th ed., Butterworth-Heinemann, 2007.
[7] C. Kirtley, Clinical Gait Analysis: Theory and Practice, Elsevier Churchill Livingstone, 2006.
[8] S. Del Din, A. Godfrey, C. Mazza, S. Lord, and L. Rochester, “Free-living gait analysis in Parkinson’s disease,” Movement Disorders, vol. 31, no. 9, pp. 1284–1293, 2016.
[9] A. Salarian, H. Russmann, F. J. G. Vingerhoets, C. Dehollain, Y. Blanc, and K. Aminian, “Gait assessment in Parkinson’s disease,” IEEE Transactions on Biomedical Engineering, vol. 51, no. 8, pp. 1434–1443, 2004.
[10] J. Hausdorff, “Gait variability: Methods, modeling and meaning,” Journal of NeuroEngineering and Rehabilitation, vol. 2, no. 19, pp. 1–9, 2005.
[11] J. J. Collins and C. J. De Luca, “Open-loop and closed-loop control of posture,” Experimental Brain Research, vol. 95, pp. 308–318, 1993.
[12] P. Mannini and A. M. Sabatini, “Machine learning methods for classifying human physical activity,” Sensors, vol. 10, no. 2, pp. 1154–1175, 2010.
[13] S. M. Bruijn, O. G. Meijer, P. J. Beek, and J. H. van Dieën, “Assessing the stability of human locomotion,” Journal of the Royal Society Interface, vol. 10, no. 83, 2013.
[14] K. Aminian and B. Najafi, “Capturing human motion using body-fixed sensors,” Journal of Biomechanics, vol. 37, no. 6, pp. 925–931, 2004.
[15] L. M. McGinnis, S. Cain, J. J. Davidson, and R. S. McLean, “Gait event detection using wearable sensors,” Sensors, vol. 16, no. 6, 2016.
[16] S. Tadano, R. Takeda, and H. Miyagawa, “Three-dimensional gait analysis using wearable acceleration and gyro sensors,” Journal of Biomechanics, vol. 46, no. 1, pp. 97–105, 2013.
[17] C. Morris, “Biomechanics of gait and posture,” Orthopaedics and Trauma, vol. 25, no. 5, pp. 292–300, 2011.
[18] P. C. Fino and J. B. Mancini, “Gait variability and stability,” Clinical Biomechanics, vol. 43, pp. 73–80, 2017.
[19] M. A. Wahid, N. Begum, and M. A. Khan, “Wavelet-based gait signal analysis,” Biomedical Signal Processing and Control, vol. 18, pp. 301–312, 2015.
[20] S. Mallat, A Wavelet Tour of Signal Processing, 3rd ed., Academic Press, 2009.
[21] H. Kantz and T. Schreiber, Nonlinear Time Series Analysis, 2nd ed., Cambridge University Press, 2004.
[22] J. A. Brach, J. M. Studenski, S. Perera, D. VanSwearingen, and A. B. Newman, “Gait variability and the risk of incident mobility disability,” Journal of Gerontology, vol. 62, no. 9, pp. 983–988, 2007.
[23] R. Moe-Nilssen and J. L. Helbostad, “Estimation of gait cycle characteristics by trunk accelerometry,” Journal of Biomechanics, vol. 37, no. 1, pp. 121–126, 2004.
[24] T. Sejdic, K. A. Lowry, J. Bellanca, M. S. Redfern, and J. S. Brach, “A comprehensive assessment of gait accelerometry signals,” IEEE Transactions on Neural Systems and Rehabilitation Engineering, vol. 22, no. 3, pp. 603–612, 2014.
[25] P. Terrier and O. Dériaz, “Kinematic variability during human walking,” Human Movement Science, vol. 30, no. 6, pp. 1104–1116, 2011.
[26] J. M. Hollman, E. M. McDade, and R. C. Petersen, “Normative spatiotemporal gait parameters,” Gait & Posture, vol. 34, no. 1, pp. 111–118, 2011.
[27] S. Lord, B. Galna, and L. Rochester, “Moving forward on gait measurement,” Movement Disorders, vol. 28, no. 11, pp. 1534–1543, 2013.
[28] M. El-Gohary and J. McNames, “Human joint angle estimation with inertial sensors,” IEEE Transactions on Biomedical Engineering, vol. 62, no. 7, pp. 1753–1764, 2015.
[29] A. Weiss, T. Herman, N. Giladi, and J. M. Hausdorff, “Objective assessment of fall risk,” Journal of NeuroEngineering and Rehabilitation, vol. 11, no. 1, 2014.
[30] World Health Organization, WHO Global Report on Mobility and Disability, WHO Press, Geneva, 2011.
You can download the Project files here: Download files now. (You must be logged in).


Responses