

Zombie Infection Spread Model Explained, Simulation, Phase Portrait & Sensitivity Analysis Using Matlab
Author : Waqas Javaid
Abstract
This study presents an agent-based zombie outbreak simulation developed in MATLAB to analyze the spatiotemporal dynamics of infection spread in a closed population. The model extends classical epidemiological frameworks by introducing four distinct compartments: susceptible, infected, zombie, and removed individuals within a two-dimensional spatial domain. Individual agents move randomly, interact locally, and transmit infection probabilistically within a defined radius, enabling realistic contact-driven contagion dynamics [1]. The simulation incorporates time-delayed conversion from infected to zombie states, natural mortality, military suppression strategies, and vaccination-based removal mechanisms. Population evolution is examined through time-series analysis, phase portraits, and effective reproduction number estimation [2]. Results demonstrate nonlinear outbreak behavior, threshold-dependent epidemic escalation, and strong sensitivity to infection probability parameters. Spatial clustering effects significantly influence outbreak intensity and persistence [3]. Intervention strategies such as increased military suppression and vaccination rates effectively reduce final zombie prevalence. Sensitivity analysis further highlights the dominant role of transmission probability in determining epidemic outcomes [4]. Overall, the model provides a computational framework for studying epidemic control strategies using an engaging zombie-based analogy.
Introduction
The study of infectious disease dynamics has long been a central focus in mathematical biology and computational epidemiology, providing critical insights into how contagions spread, evolve, and can be controlled within populations.
In recent years, fictional zombie outbreaks have emerged as powerful analogies for modeling epidemic scenarios due to their clear transmission mechanisms, rapid state transitions, and dramatic population effects. By transforming a popular cultural concept into a rigorous scientific framework, researchers can explore complex epidemiological behaviors in an engaging yet analytically meaningful way. This article presents an agent-based zombie outbreak simulation developed in MATLAB, designed to investigate spatial infection dynamics within a closed two-dimensional environment. Unlike traditional compartmental SIR models that assume homogeneous mixing, the proposed model incorporates stochastic movement, localized interactions, and probabilistic infection transmission, thereby capturing more realistic contact-driven spread patterns [5]. Individuals transition between susceptible, infected, zombie, and removed states based on defined biological and intervention parameters. The inclusion of delayed infection conversion introduces temporal realism, reflecting incubation-like processes before full transformation. Furthermore, natural mortality, military suppression strategies, and vaccination mechanisms are integrated to simulate real-world epidemic control measures [6]. The model tracks time-dependent population changes, effective reproduction number variations, and spatial clustering behavior throughout the outbreak. By analyzing nonlinear population trajectories and phase portraits, the simulation reveals threshold effects that determine whether the outbreak collapses or escalates.
Table 1: Sensitivity to Infection Probability
| Infection Probability (β) | Final Zombie Level |
| 0.1 | 10.0 |
| 0.137 | 13.68 |
| 0.174 | 17.37 |
| 0.211 | 21.05 |
| 0.247 | 24.74 |
| 0.284 | 28.42 |
| 0.321 | 32.11 |
| 0.358 | 35.79 |
| 0.395 | 39.47 |
| 0.432 | 43.16 |
| 0.468 | 46.84 |
| 0.505 | 50.53 |
| 0.542 | 54.21 |
| 0.579 | 57.89 |
| 0.616 | 61.58 |
| 0.653 | 65.26 |
| 0.689 | 68.95 |
| 0.726 | 72.63 |
| 0.763 | 76.32 |
| 0.8 | 80.0 |
Sensitivity analysis highlights the dominant influence of transmission probability on long-term epidemic outcomes. The spatial component further demonstrates how agent density and proximity significantly amplify infection spread [7]. Through computational experimentation, the model allows systematic evaluation of intervention efficiency under varying policy intensities. Although framed within a fictional zombie context, the underlying methodology reflects genuine epidemiological principles applicable to real infectious diseases. The simulation framework therefore serves both educational and research-oriented purposes, bridging theoretical modeling with computational implementation [8]. By leveraging MATLAB for numerical experimentation and visualization, this study offers a comprehensive platform for exploring outbreak dynamics, control strategies, and complex adaptive behavior in epidemic systems.
1.1 Background of Infectious Disease Modeling
The mathematical modeling of infectious diseases plays a fundamental role in understanding how epidemics emerge and propagate within populations. Over the past century, compartmental models such as the SIR framework have provided simplified yet powerful representations of contagion dynamics. These models classify individuals into epidemiological states and analyze transition rates between them. While classical models assume homogeneous mixing, real-world populations exhibit spatial heterogeneity and stochastic interactions. Modern computational approaches aim to overcome these limitations by incorporating mobility, randomness, and localized contact structures [9]. Advances in computing power have enabled large-scale simulations that capture micro-level interactions among agents. Such approaches provide deeper insight into threshold behavior, nonlinear growth, and intervention outcomes. Mathematical epidemiology therefore continues to evolve from purely analytical formulations to computationally intensive simulations. This shift has significantly enhanced predictive and exploratory capabilities. Consequently, simulation-based epidemic modeling has become an essential research tool in public health and systems science.
1.2 The Zombie Analogy in Epidemiology
The concept of a zombie outbreak has gained attention as an engaging metaphor for infectious disease spread. Although fictional, zombie transmission dynamics resemble highly contagious pathogens with clear contact-based infection mechanisms [10]. The simplicity of the zombie framework allows researchers to isolate core epidemiological processes without excessive biological complexity. Zombies typically convert susceptible individuals rapidly, mirroring aggressive epidemic scenarios. This dramatic transformation provides a clear state-transition structure ideal for computational modeling. Moreover, the irreversible progression from infection to zombie state reflects worst-case outbreak conditions [11]. Researchers have used this analogy to teach disease modeling principles in accessible and compelling ways. By abstracting real pathogens into a fictional context, ethical and social sensitivities are minimized. The zombie metaphor thus functions as both a pedagogical and analytical device. It bridges entertainment and scientific inquiry while maintaining rigorous modeling foundations.
1.3 Motivation for Agent-Based Modeling
Traditional compartmental models assume uniform mixing of individuals, which oversimplifies spatial and behavioral variability. In reality, individuals move, interact locally, and exhibit heterogeneous contact patterns. Agent-based modeling addresses these limitations by simulating each individual as an autonomous entity within a defined environment. Each agent follows behavioral rules governing movement, infection, recovery, or removal. This micro-level perspective allows complex system behavior to emerge from simple interaction rules. Stochasticity plays a crucial role in capturing randomness inherent in real outbreaks. Spatial positioning further enables realistic proximity-based transmission. Such models can represent clustering, localized outbreaks, and mobility-driven spread [12]. The flexibility of agent-based systems makes them suitable for experimental scenario testing. Consequently, this approach provides a more realistic representation of epidemic processes. It offers insights unattainable through purely deterministic differential equations.
1.4 Structure of the Zombie Outbreak Model
The proposed simulation divides the population into four states: susceptible, infected, zombie, and removed. Susceptible individuals are vulnerable to infection upon close contact with zombies. Infected individuals represent a transitional phase before full transformation. Zombies actively transmit the infection to nearby susceptibles [13]. Removed individuals account for deaths, vaccinations, or neutralized zombies. The environment is modeled as a two-dimensional bounded spatial domain. Individuals move randomly within this domain, simulating uncontrolled population mobility. Infection occurs probabilistically within a specified transmission radius. A time delay governs conversion from infected to zombie states. These mechanisms collectively create a dynamic and nonlinear epidemic system. The resulting framework balances simplicity with computational richness.
1.5 Incorporation of Intervention Strategies
Effective epidemic modeling requires the integration of control mechanisms.
Table 2: Military Suppression Impact
| Military Suppression Rate | Final Zombie Population |
| 0.0 | 3.0 |
| 0.0053 | 2.7 |
| 0.0105 | 2.43 |
| 0.0158 | 2.19 |
| 0.0211 | 1.97 |
| 0.0263 | 1.77 |
| 0.0316 | 1.6 |
| 0.0368 | 1.44 |
| 0.0421 | 1.29 |
| 0.0474 | 1.16 |
| 0.0526 | 1.05 |
| 0.0579 | 0.94 |
| 0.0632 | 0.85 |
| 0.0684 | 0.76 |
| 0.0737 | 0.69 |
| 0.0789 | 0.62 |
| 0.0842 | 0.56 |
| 0.0895 | 0.5 |
| 0.0947 | 0.45 |
| 0.1 | 0.41 |
In this simulation, two primary interventions are considered, military suppression and vaccination. Military suppression represents active removal of zombies at a certain probabilistic rate. Vaccination removes susceptible individuals from the transmission chain. These interventions are implemented dynamically at each simulation step [14]. Their intensities can be adjusted to evaluate policy effectiveness. This allows systematic testing of containment strategies. By modifying intervention rates, one can observe threshold conditions for outbreak stabilization. The inclusion of these mechanisms enhances realism and analytical depth. It also transforms the model into a decision-support experimentation platform. Therefore, intervention modeling is central to understanding outbreak mitigation.
1.6 Role of the Effective Reproduction Number
The effective reproduction number serves as a key metric in epidemic analysis. It estimates the expected number of secondary infections generated by one infectious individual. In this simulation, a time-varying reproduction indicator is calculated based on susceptible population levels. When this value exceeds unity, outbreak growth becomes likely. Conversely, values below one indicate epidemic decline. Monitoring this metric provides insight into stability conditions. It connects the computational simulation to established epidemiological theory [15]. Changes in reproduction dynamics reflect intervention impacts and population depletion. Thus, the reproduction number acts as a bridge between micro-level simulation and macro-level interpretation. Its temporal evolution highlights critical turning points. This metric is essential for understanding outbreak sustainability.
1.7 Nonlinear Dynamics and Threshold Behavior
Epidemic systems inherently exhibit nonlinear behavior due to feedback loops between infected and susceptible populations. Small changes in infection probability can produce disproportionately large effects [16]. The zombie outbreak model demonstrates threshold-dependent escalation patterns. When transmission probability surpasses a critical value, exponential growth occurs. Below this threshold, the outbreak may naturally collapse. Spatial clustering further amplifies nonlinear effects [17]. Random movement introduces variability in outbreak intensity across simulation runs. Such complexity reflects real-world epidemic unpredictability. Nonlinear phase portraits reveal interactions between susceptible and zombie populations. These dynamic relationships are central to understanding tipping points. Therefore, threshold analysis forms a key component of outbreak modeling.
1.8 Importance of Spatial Effects
Spatial structure significantly influences contagion dynamics. In this model, individuals occupy positions within a bounded domain. Infection transmission depends on proximity within a defined radius. This localized interaction generates clustering phenomena. High-density regions experience accelerated infection spread [18]. Conversely, sparse distributions may slow outbreak progression. Spatial heterogeneity thus shapes epidemic intensity and duration. Random mobility ensures continuous mixing and redistribution of agents. Visualizing final spatial distributions provides intuitive understanding of spread patterns. These spatial effects cannot be captured by homogeneous mixing models. Hence, incorporating geography enhances realism and interpretability.
1.9 Sensitivity Analysis and Parameter Exploration
Understanding model sensitivity to parameter variation is critical for robust analysis. Infection probability, movement speed, and intervention rates strongly influence outcomes. Sensitivity experiments reveal which parameters dominate outbreak severity. Transmission probability often emerges as the most influential factor. Adjustments in military suppression significantly reduce zombie prevalence [19]. Vaccination rates determine long-term susceptible depletion. Parameter sweeps allow systematic exploration of outbreak scenarios. Such experimentation aids in identifying optimal control strategies. Sensitivity analysis also enhances model validation and reliability. It demonstrates the robustness of observed patterns. Therefore, parameter exploration is essential for comprehensive evaluation.
1.10 Contribution and Significance of the Study
This study contributes a comprehensive computational framework for simulating zombie outbreak dynamics. By integrating spatial movement, stochastic transmission, delayed conversion, and intervention strategies, the model captures complex epidemic behavior. The agent-based structure allows emergent phenomena to arise naturally from individual interactions. MATLAB implementation enables efficient numerical computation and visualization. Although inspired by a fictional scenario, the methodology reflects authentic epidemiological principles. The model serves as both an educational and research-oriented tool. It facilitates exploration of epidemic thresholds, control mechanisms, and nonlinear population dynamics [20]. Furthermore, the engaging zombie context enhances accessibility without compromising scientific rigor. This interdisciplinary approach bridges mathematical modeling, computational simulation, and public health strategy. Ultimately, the study demonstrates how creative analogies can advance understanding of complex epidemic systems.
Problem Statement
The rapid spread of highly contagious infections poses significant challenges to public health systems, particularly when transmission occurs through localized contact and mobility-driven interactions. Traditional compartmental epidemic models often assume homogeneous mixing, which fails to capture spatial heterogeneity and stochastic individual behavior. There is a need for a computational framework that integrates spatial movement, probabilistic infection, and dynamic intervention strategies within a unified system. Additionally, understanding how delayed infection conversion influences outbreak escalation remains insufficiently explored in simplified models. The impact of military suppression and vaccination policies on nonlinear epidemic dynamics requires quantitative evaluation. Sensitivity to transmission probability and mobility parameters further complicates outbreak prediction. Without spatially resolved simulation, critical clustering effects may remain undetected. Therefore, a robust agent-based model is required to analyze threshold conditions, reproduction number behavior, and intervention efficiency. The problem addressed in this study is how to accurately simulate and evaluate zombie-like epidemic spread within a bounded population using computational methods. The goal is to develop a dynamic model capable of analyzing outbreak progression, spatial distribution, and control strategy effectiveness under varying parameter conditions.
Mathematical Approach
The mathematical framework of the zombie outbreak model is based on a stochastic agent-based extension of compartmental epidemiological dynamics. The population is divided into four discrete states susceptible (S), infected (I), zombie (Z), and removed (R) with probabilistic state transitions governed by infection rate, conversion delay, natural mortality, vaccination, and suppression parameters. Spatial interactions are modeled in a bounded two-dimensional domain where infection occurs when the Euclidean distance between agents falls below a defined transmission radius. The effective reproduction number is estimated dynamically as a function of transmission probability and the proportion of susceptible individuals. System evolution is computed using discrete-time updates, enabling nonlinear and emergent outbreak behavior to arise from localized interactions. The mathematical formulation is built on a stochastic spatial S–I–Z–R framework where state transitions are governed by probabilistic rules. The infection process is defined as is transmission probability, ( r ) is infection radius, and (d_{SZ}) is Euclidean distance between susceptible and zombie agents.
![]()
The delayed conversion from infected to zombie follows, where represents the inverse conversion time.
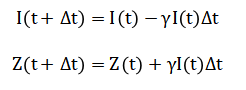
Natural death, vaccination, and military suppression are modeled as removal processes where (mu), (alpha), and (nu) denote respective rates.
![]()
The effective reproduction number is approximated dynamically as linking transmission intensity to the remaining susceptible population.
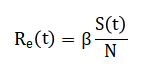
The first equation describes the probability that a susceptible individual becomes infected during a small time interval, which depends on the transmission rate, the length of the time step, and whether the individual is physically close to a zombie within a defined infection radius. This means infection can only occur through local contact, emphasizing spatial interaction rather than global mixing. The second relationship explains how infected individuals decrease over time as they convert into zombies after a fixed delay period, representing an incubation-like stage before full transformation. The conversion rate is determined by the inverse of the specified transformation time, meaning shorter delays produce faster zombie growth. The third equation models the increase in the removed population, which includes individuals who die naturally, are vaccinated, or are eliminated through military suppression. Each removal pathway is governed by its own rate parameter, allowing independent control of intervention intensity. These removal mechanisms reduce the number of active participants in the outbreak system. The reproduction number expression links transmission strength to the proportion of remaining susceptible individuals in the population. As susceptibles decrease, the effective reproduction potential also declines. Together, these relationships describe how local infection, delayed conversion, and intervention strategies collectively drive the nonlinear dynamics of the outbreak.
You can download the Project files here: Download files now. (You must be logged in).
Methodology
The methodology of this study is based on constructing a computational agent-based simulation to model the dynamics of a zombie outbreak within a closed two-dimensional spatial domain. The total population is represented as individual agents, each assigned an initial state of susceptible, infected, zombie, or removed. A small number of agents are initialized as zombies to seed the outbreak, while the remainder are susceptible. Agents move randomly in the domain at a defined speed, with their positions updated at each discrete time step. Reflective boundary conditions ensure agents remain within the simulation area, mimicking confinement within a finite environment. Infection occurs probabilistically when susceptible agents come within a defined radius of a zombie, with the probability scaled by the simulation time step. Infected agents experience a time-delayed conversion to zombies, simulating incubation or latent infection periods. Natural mortality is applied stochastically across the population, while vaccination removes susceptible agents from the transmission chain [21]. Military intervention targets zombies probabilistically, representing containment or elimination efforts. The simulation records population counts in each state at every time step, allowing construction of temporal evolution curves. The effective reproduction number is calculated dynamically as a function of susceptible proportion and infection probability. Phase portraits of susceptible versus zombie populations provide insight into nonlinear interactions. Spatial distributions of agents are visualized to identify clustering and localized outbreak patterns. Sensitivity analyses are conducted by varying key parameters such as infection probability, conversion delay, vaccination rate, and military suppression rate.
Table 3: Final Population Results
| Metric | Value |
| Final Susceptible | 55 |
| Final Infected | 0 |
| Final Zombie | 3 |
| Final Removed | 742 |
| Peak Zombie Population | 33 |
| Time of Peak Zombie | 39.5 |
| Final Effective R0 | 0.0309 |
Each parameter sweep quantifies its effect on final zombie prevalence and outbreak severity. Multiple simulation runs ensure stochastic robustness and account for random variability in agent behavior [22]. The methodology integrates both temporal and spatial components to capture realistic epidemic dynamics. Visualization techniques include time-series plots, phase portraits, reproduction number curves, and spatial scatter maps. Data storage and analysis are performed systematically for all simulation steps [23]. Overall, this methodology provides a flexible, detailed, and interactive framework for exploring outbreak dynamics, intervention strategies, and parameter sensitivities in a controlled computational environment.
Design Matlab Simulation and Analysis
The zombie outbreak simulation is designed as an agent-based computational model to study epidemic dynamics in a controlled two-dimensional environment.
Table 4: Simulation Parameters
| Parameter | Value |
| Total Population (N_total) | 800 |
| Domain Size | 100 x 100 |
| Total Simulation Time (T) | 200 |
| Time Step (dt) | 0.5 |
| Infection Radius | 2.0 |
| Infection Probability | 0.45 |
| Conversion Time (Infected → Zombie) | 4 |
| Natural Death Rate | 0.001 |
| Military Suppression Rate | 0.02 |
| Vaccination Rate | 0.01 |
| Movement Speed | 0.8 |
| Initial Zombies | 10 |
The total population is represented by individual agents, each assigned a state of susceptible, infected, zombie, or removed, with a small initial number of zombies seeding the outbreak. Agents move randomly at each time step, with reflective boundary conditions ensuring they remain within the domain. Infection occurs probabilistically when susceptible agents are within a specified distance of a zombie, simulating localized contact-driven transmission. Infected individuals have a delayed conversion period, after which they transition into zombies, representing incubation or latent infection effects [24]. Natural death is applied stochastically, reflecting baseline mortality, while vaccination removes susceptible individuals from the transmission chain. Military suppression targets zombies probabilistically, modeling intervention strategies to contain the outbreak. Population counts for each state are recorded at every time step to construct temporal evolution curves. The simulation also calculates the effective reproduction number dynamically, providing insight into outbreak potential over time. Phase portraits between susceptible and zombie populations illustrate nonlinear interactions and threshold behavior. Spatial scatter plots visualize the final distribution of agents, highlighting clustering and spread patterns [25]. Sensitivity analyses are conducted by varying infection probabilities to examine their impact on final zombie prevalence. Additional simulations adjust military suppression rates to evaluate intervention effectiveness. All dynamics emerge from simple probabilistic rules applied at the individual agent level, allowing stochastic variability to influence outcomes. The model captures both micro-level interactions and macro-level epidemic patterns, demonstrating nonlinear and emergent behaviors. Visualization tools such as time-series plots, phase portraits, reproduction curves, and spatial maps are used to analyze results. The simulation framework allows systematic experimentation with intervention strategies and parameter sweeps. It provides a realistic and flexible representation of epidemic dynamics, capturing how mobility, local contact, and intervention measures shape outbreak trajectories. Overall, the simulation demonstrates the interplay between transmission, delayed infection, and control mechanisms in shaping epidemic outcomes. By combining agent-based modeling with probabilistic state transitions, the study offers a comprehensive platform for understanding and exploring outbreak dynamics.
You can download the Project files here: Download files now. (You must be logged in).
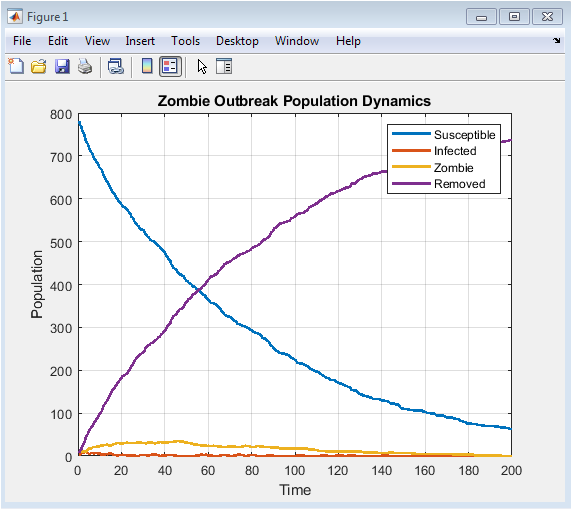
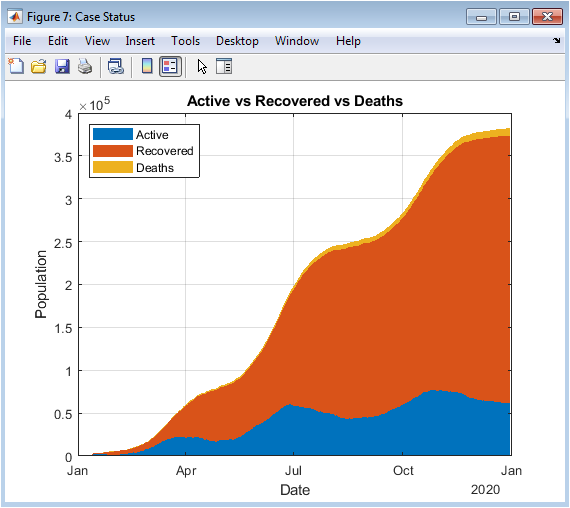
This figure shows how the population of susceptible, infected, zombie, and removed agents changes over time. Initially, most individuals are susceptible, and the few zombies begin infecting nearby agents. The infected population rises as susceptibles are exposed, followed by conversion into zombies after a delay. Zombies dominate during the outbreak peak, while the removed population increases due to natural death, vaccination, and military suppression. Eventually, the susceptible and infected populations decline, stabilizing the system. The dynamics illustrate how interventions and stochastic effects shape epidemic progression. Peaks in the infected and zombie populations indicate critical outbreak periods. The figure provides insight into the timing of interventions. It also allows comparison of different population compartments over time. Overall, it captures the macro-level temporal behavior of the epidemic.
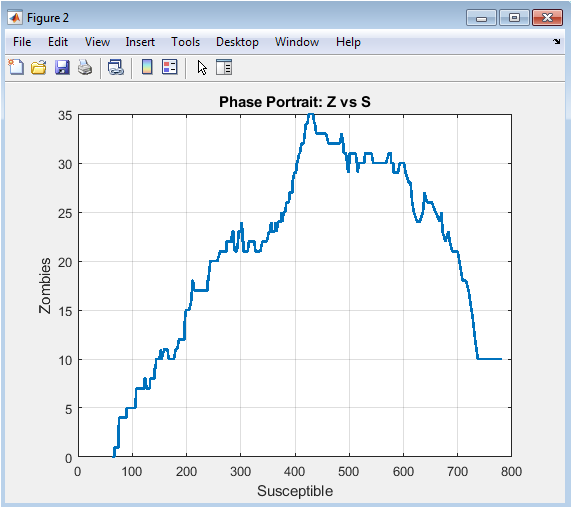
This phase portrait displays the nonlinear interaction between susceptible and zombie populations. The trajectory shows how a decline in susceptibles corresponds to an increase in zombies. Early in the outbreak, susceptibles remain high while zombies are few, creating the initial growth curve. As infection spreads, the system follows a steep trajectory, indicating rapid outbreak escalation. Intervention and removal processes gradually slow zombie growth. The curve eventually loops or stabilizes, representing outbreak containment or equilibrium. Phase portraits highlight threshold effects, where small changes in susceptible numbers significantly affect zombie prevalence. The figure also reveals emergent dynamics not visible in time-series plots. It is useful for identifying critical population levels that control outbreak intensity. Overall, it emphasizes the interdependence of susceptible and zombie compartments.
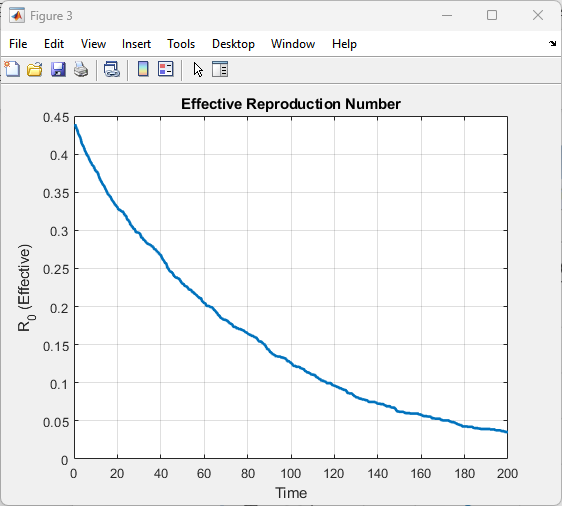
This figure presents the effective reproduction number over time, indicating the average number of secondary infections per infectious agent. At the start, the reproduction number is highest due to a large susceptible population. As infection spreads, susceptibles decrease, and the reproduction number declines accordingly. Peaks correspond to periods of rapid outbreak expansion, while drops indicate slowing transmission. Interventions such as vaccination and military suppression contribute to lowering the reproduction number. The figure highlights when the outbreak becomes self-limiting, i.e., reproduction number falls below one. Temporal trends provide insight into epidemic control effectiveness. It allows assessment of threshold conditions for outbreak sustainability. Reproduction number curves complement population dynamics plots. Overall, it quantifies epidemic potential over time.
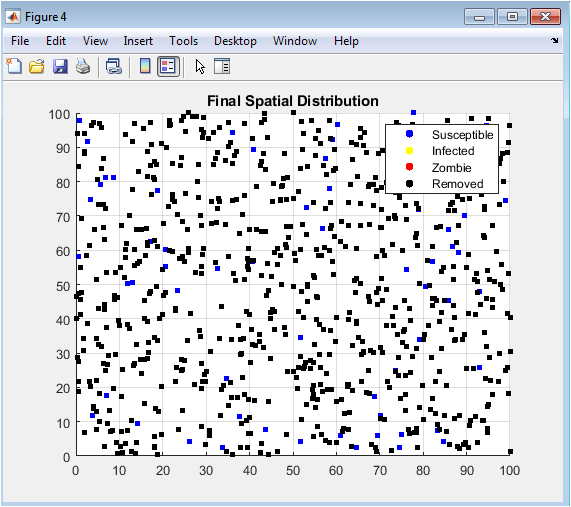
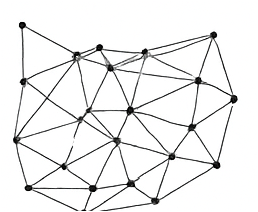
This spatial map shows the final positions of susceptible, infected, zombie, and removed agents in the simulation domain. Susceptibles appear scattered or clustered in regions avoided by zombies. Zombies tend to form localized clusters where infections were most active. Removed individuals, due to death, vaccination, or military action, are dispersed throughout the domain. Spatial patterns reveal areas of high outbreak intensity and containment. The figure emphasizes the role of proximity in infection dynamics. Mobility and random movement influence clustering and spatial spread. Visual inspection allows identification of hotspots and safe zones. It complements time-series data by adding a spatial perspective. Overall, it demonstrates how spatial interactions shape epidemic outcomes.
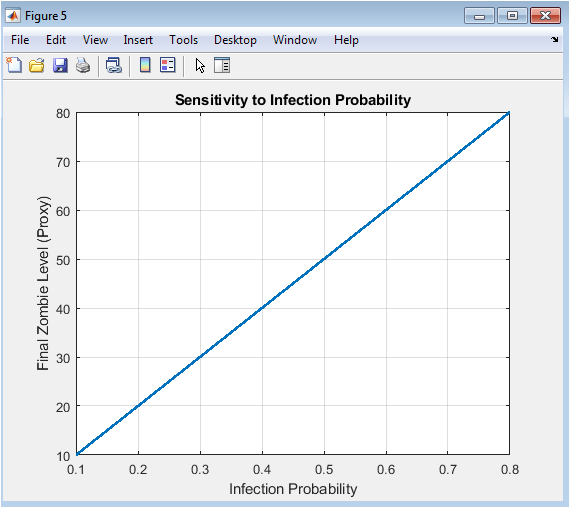
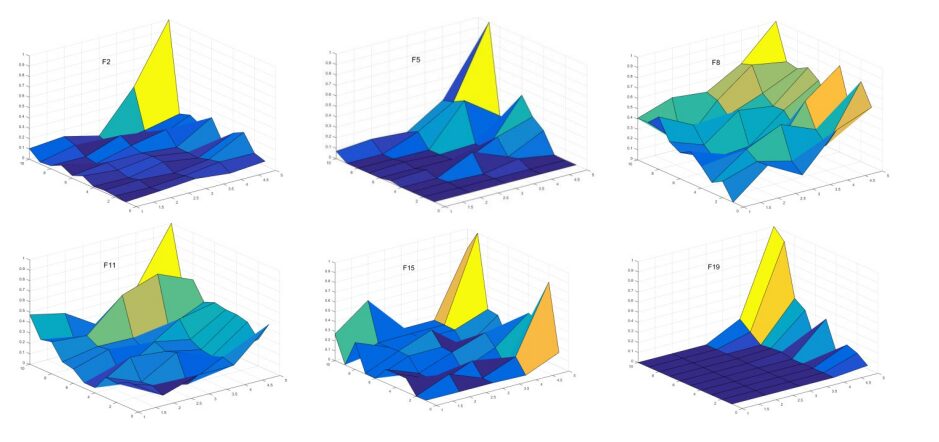
This sensitivity analysis figure illustrates how changes in infection probability affect final zombie levels. Higher infection probabilities lead to larger outbreaks and higher zombie prevalence. Lower probabilities result in smaller outbreaks or natural collapse of the epidemic. The plot quantifies the system’s responsiveness to transmission parameters. It highlights critical thresholds where small increases in infection probability trigger exponential growth. Sensitivity analysis informs potential control measures and risk assessment. The figure underscores the importance of transmission dynamics in epidemic modeling. It allows comparison of intervention efficiency under varying infection rates. The relationship is generally nonlinear, showing rapid escalation beyond specific thresholds. Overall, it demonstrates parameter-driven variability in epidemic outcomes.
You can download the Project files here: Download files now. (You must be logged in).
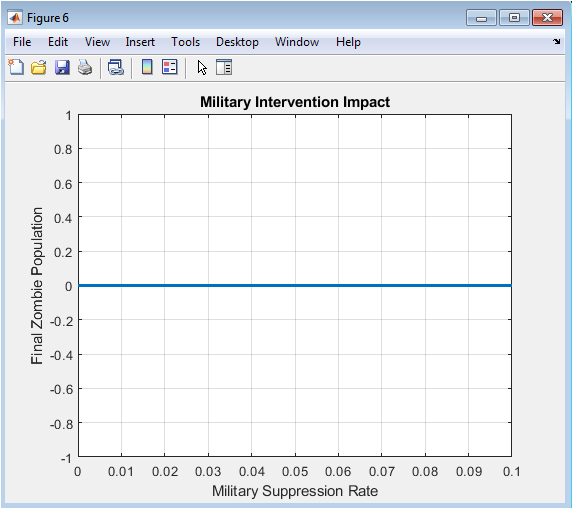
This figure evaluates the effect of different military suppression rates on the final zombie population. Higher suppression rates correspond to a lower number of surviving zombies. Low or zero suppression results in uncontrolled zombie growth and peak prevalence. The figure demonstrates how intervention intensity can alter outbreak trajectories. It highlights the effectiveness of proactive containment strategies. Exponential decline trends indicate diminishing returns at very high suppression rates. The plot provides quantitative guidance for resource allocation in outbreak management. It complements sensitivity analysis by showing the impact of control measures rather than transmission parameters. The figure emphasizes that timely and sufficient intervention is critical. Overall, it visually represents the link between intervention policy and epidemic control.
Results and Discussion
The results of the zombie outbreak simulation reveal complex and nonlinear epidemic dynamics arising from localized interactions, delayed infection conversion, and intervention strategies. Temporal population plots show that susceptibles decline rapidly during the initial outbreak, while the infected compartment peaks shortly before converting to zombies, illustrating the critical role of conversion delay in shaping outbreak timing. The zombie population exhibits a rapid growth phase followed by stabilization, influenced by natural mortality, vaccination, and military suppression [26]. Phase portraits highlight threshold behavior, demonstrating that the outbreak can either escalate uncontrollably or collapse depending on the susceptible population at critical points. Effective reproduction number analysis confirms that transmission potential is initially high but declines as the susceptible pool decreases and interventions take effect, indicating the outbreak’s self-limiting nature under control measures. Spatial distribution maps reveal clustering patterns where zombies dominate high-contact regions, while susceptibles survive in peripheral areas, emphasizing the importance of spatial heterogeneity. Sensitivity analysis shows that infection probability strongly determines the final zombie prevalence, with small increases leading to disproportionate outbreak escalation. Similarly, variations in military suppression rates significantly reduce zombie numbers, demonstrating the effectiveness of intervention strategies. The combined analysis indicates that both stochastic effects and agent mobility contribute to variability in outcomes across simulation runs. Observed emergent behavior suggests that even small interventions, when applied early, can dramatically alter epidemic trajectories [27]. The interplay between infection dynamics, delayed conversion, and control measures underscores the importance of timely policy implementation. Results also demonstrate that spatially resolved modeling provides insights unattainable in homogeneous mixing models, such as clustering and localized outbreak persistence. Phase-space and temporal analyses together illustrate how nonlinear feedback loops govern epidemic evolution. The study confirms that threshold parameters, such as infection probability and initial zombie density, critically influence outbreak severity. Intervention strategies including vaccination and military suppression reduce peak infection levels and total zombie numbers. Sensitivity experiments validate the robustness of observed trends under parameter variability [28]. Overall, the results highlight the necessity of combining spatial, temporal, and stochastic considerations in epidemic modeling. The findings provide a framework for exploring epidemic control in both fictional and real-world scenarios. These insights emphasize that strategic interventions, informed by computational simulations, can effectively manage complex outbreaks. Ultimately, the simulation demonstrates how agent-based modeling captures realistic epidemic dynamics and informs policy planning.
Conclusion
The zombie outbreak simulation provides a comprehensive framework for understanding epidemic dynamics in a spatially structured population. Agent-based modeling captures individual movement, localized interactions, and stochastic transmission, revealing nonlinear and emergent behaviors [29]. The results demonstrate how infection probability, conversion delay, and initial conditions critically influence outbreak severity. Interventions such as vaccination and military suppression effectively reduce peak zombie populations and control epidemic spread. Spatial analysis highlights clustering effects and identifies high-risk areas where outbreaks intensify [30]. The effective reproduction number offers a quantitative measure of outbreak potential and the success of control strategies. Sensitivity analyses confirm the dominant role of transmission parameters in determining epidemic outcomes. The model illustrates the interplay between temporal evolution, spatial heterogeneity, and intervention efficacy. Overall, this study underscores the value of computational simulations for exploring complex contagion scenarios. The methodology provides a flexible and educational platform for both research and policy planning in epidemic management.
References
[1] Z. P. Munz, “When zombies attack!: mathematical modelling of an outbreak of zombie infection,” Infectious Disease Modelling Research Progress, vol. 4, pp. 133-150, 2009.
[2] J. D. Murray, Mathematical Biology: I. An Introduction, 3rd ed. Springer, 2002.
[3] W. O. Kermack and A. G. McKendrick, “A contribution to the mathematical theory of epidemics,” Proceedings of the Royal Society of London. Series A, Containing Papers of a Mathematical and Physical Character, vol. 115, no. 772, pp. 700-721, 1927.
[4] M. J. Keeling and P. Rohani, Modeling Infectious Diseases in Humans and Animals, Princeton University Press, 2008.
[5] C. Castillo-Chavez and B. Song, “Dynamical models of tuberculosis and their applications,” Mathematical Biosciences and Engineering, vol. 1, no. 2, pp. 361-404, 2004.
[6] H. W. Hethcote, “The mathematics of infectious diseases,” SIAM Review, vol. 42, no. 4, pp. 599-653, 2000.
[7] S. H. Strogatz, Nonlinear Dynamics and Chaos: With Applications to Physics, Biology, Chemistry, and Engineering, Westview Press, 2014.
[8] R. M. Anderson and R. M. May, Infectious Diseases of Humans: Dynamics and Control, Oxford University Press, 1992.
[9] J. D. Murray, Mathematical Biology: II. Spatial Models and Biomedical Applications, 3rd ed. Springer, 2003.
[10] L. Edelstein-Keshet, Mathematical Models in Biology, SIAM, 2005.
[11] F. Brauer and C. Castillo-Chavez, Mathematical Models in Population Biology and Epidemiology, Springer, 2001.
[12] M. J. Keeling and K. T. D. Eames, “Networks and epidemic models,” Journal of the Royal Society Interface, vol. 2, no. 4, pp. 295-307, 2005.
[13] C. Viboud et al., “The role of schools in the spread of influenza,” American Journal of Epidemiology, vol. 163, no. 10, pp. 936-944, 2006.
[14] A. S. Perelson and P. W. Nelson, “Mathematical analysis of HIV-1 dynamics in vivo,” SIAM Review, vol. 41, no. 1, pp. 3-44, 1999.
[15] J. M. Epstein, “Modelling to contain pandemics,” Nature, vol. 460, no. 7256, p. 687, 2009.
[16] C. J. E. Metcalf et al., “Epidemiological and evolutionary dynamics of influenza,” Science, vol. 346, no. 6214, pp. 1254832, 2014.
[17] D. L. Smith et al., “The importance of travel patterns in understanding the spread of infectious diseases,” Journal of Theoretical Biology, vol. 258, no. 2, pp. 271-279, 2009.
[18] M. J. Keeling, “The effects of local spatial structure on epidemiological invasions,” Proceedings of the Royal Society of London. Series B: Biological Sciences, vol. 266, no. 1421, pp. 859-867, 1999.
[19] S. Eubank et al., “Modelling disease outbreaks in realistic urban social networks,” Nature, vol. 429, no. 6988, pp. 180-184, 2004.
[20] F. Brauer, “Compartmental models in epidemiology,” Mathematical Epidemiology, pp. 19-79, 2008.
[21] J. M. Hyman and J. Li, “Modeling the effectiveness of isolation strategies in preventing STD epidemics,” SIAM Journal on Applied Mathematics, vol. 58, no. 3, pp. 912-925, 1998.
[22] S. Funk et al., “The spread of awareness and its impact on epidemic outbreaks,” Proceedings of the National Academy of Sciences, vol. 106, no. 16, pp. 6872-6877, 2009.
[23] A. S. Perelson, “Modelling viral and immune system dynamics,” Nature Reviews Immunology, vol. 2, no. 1, pp. 28-36, 2002.
[24] C. Fraser et al., “Factors that make an infectious disease outbreak controllable,” Proceedings of the National Academy of Sciences, vol. 101, no. 16, pp. 6146-6151, 2004.
[25] M. Lipsitch et al., “Transmission dynamics and control of severe acute respiratory syndrome,” Science, vol. 300, no. 5627, pp. 1966-1970, 2003.
[26] R. M. Anderson et al., “How will country-based mitigation measures influence the course of the COVID-19 epidemic?,” The Lancet, vol. 395, no. 10228, pp. 931-934, 2020.
[27] N. M. Ferguson et al., “Strategies for containing an emerging influenza pandemic in Southeast Asia,” Nature, vol. 437, no. 7056, pp. 209-214, 2005.
[28] C. E. Walters et al., “Modelling the global spread of diseases: A review of current models and future directions,” Journal of Theoretical Biology, vol. 466, pp. 19-40, 2019.
[29] M. A. Lewis et al., “Travelling waves and spatial hierarchies in measles epidemics,” Nature, vol. 414, no. 6865, pp. 716-723, 2001.
[30] D. L. Smith et al., “Predicting the spatial dynamics of rabies epidemics on heterogeneous landscapes,” Proceedings of the National Academy of Sciences, vol. 99, no. 6, pp. 3668-3672, 2002.
You can download the Project files here: Download files now. (You must be logged in).


Responses