

Supply Chain in a Warehouse with a Bottleneck Using Anylogic Simulation
Abstract
The dynamic environment of modern warehousing demands robust strategies to optimize supply chain operations and mitigate bottlenecks. This study presents a comprehensive simulation-based approach using AnyLogic to identify and resolve bottlenecks in a warehouse operated by Kerry Logistics. Leveraging real-world data, the simulation models the flow of goods, resource utilization, and process times, enabling the visualization and analysis of system inefficiencies. Results highlight key pressure points within the inbound workflow and identify optimal resource allocation strategies to enhance operational performance. The study demonstrates the effectiveness of AnyLogic simulation in delivering actionable insights for warehouse optimization and supply chain enhancement.
Introduction
Welcome to the intricate world of supply chain management within a warehouse, where the seamless flow of goods is both an art and a science. In this exploration, we delve into the fascinating dynamics of warehouse operations, specifically focusing on the challenge posed by bottlenecks. A bottleneck, akin to a traffic jam in the supply chain highway, can impede the otherwise smooth journey of products from arrival to departure. To unravel the complexities and optimize the system, we turn to the power of AnyLogic Simulation software. This technological ally allows us to create a virtual playground where we can replicate the warehouse environment, simulate the movement of goods, and strategically address bottleneck issues. Join us on this simulation journey as we navigate through the intricacies of supply chain dynamics, seeking solutions to enhance efficiency and ensure a streamlined path for every product within the warehouse realm [1].
There has been a change in warehouse operations and layout in recent years, especially influenced by the pandemic. The logistics orders include not only large quantities, but also small and discrete amounts. Due to this transformation, some warehousing factors such as the resources, workflow process and order scheduling have increasingly essential to the management decision-making. Bottleneck analysis is a method to observe the change in those factors and evaluate the operational effectiveness of a warehouse. This study aims to simulate the warehousing scenarios using real-life data from Kerry Logistics with the consideration of different resources, evaluate the critical times for each material handling activity and utilization rates for each resource, and recommend solutions to solve bottleneck problem in this case. The quantitative analysis of this simulation will be discussed.
2. Design Methodology
2.1 Problem Statement and Hypothesis
During the meetings with the Industry Supervisor Jacky Poon (Date: April 11, 2022; May 31, 2022), there are three main concerns from the industrial perspective. First of all, the industry has an initiative to investigate whether an automated warehouse system can improve their performance. Second, they would like to evaluate the current workflow and discover whether the resources are optimized in use. Lastly, they would like to implement simulation modelling to evaluate their warehouse performance but they are not sure how to utilize the simulation software to suit their needs and requirements. Based on these concerns, three problem statements can be set to guide the study direction:
- What is the minimum amount for each resource set to complete a workflow cycle? What is the bottleneck in the cycle?
- How can the simulation software help in estimating the warehouse structure and workflow realistically with real data?
- What is the critical factor affecting the whole workflow cycle?
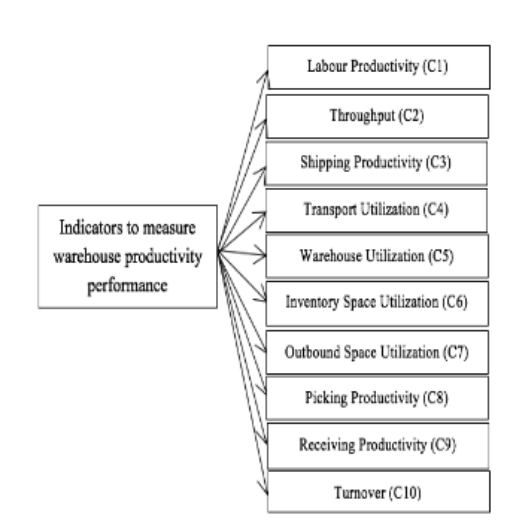
Regarding to the problem statements, we can set our hypothesis. Referenced to Karim, Rahman and Shah (2018), they suggested 10 indicators that are important to measure the warehouse productivity. Figure 1 is those 10 indicators, where labour productivity, transport utilization, picking productivity and receiving productivity can be observed in the simulation to designate the problem statements.
2.3 Simulation Tool
AnyLogic, developed by The AnyLogic Company, supports discrete-event, agent-based, and system dynamics simulation [3]. Its application to logistics and supply chain scenarios allows for real-time visualization, scenario testing, and performance analytics in both 2D and 3D models. It enables:
- Realistic modeling of warehouse processes.
- Visualization of bottlenecks and inefficiencies.
- Scenario analysis for operational improvements.
2.4 Methodology
AnyLogic is simulation software developed by The AnyLogic Company, which the software is mainly used to simulate the scenarios for supply chain, transportation, warehouse layout design, picking optimization and so on. It aims to visualize logistics issues with 2D/3D animation and know the system behavior over time, that the user can simulate different “what- if” scenarios for their business decisions. Testing cost and time for the new environment, efforts in managing controls and resources are also minimized with the virtual experiments in AnyLogic simulation.
3. Simulation and Results
3.1 3D Warehouse Simulation (Figure 2)
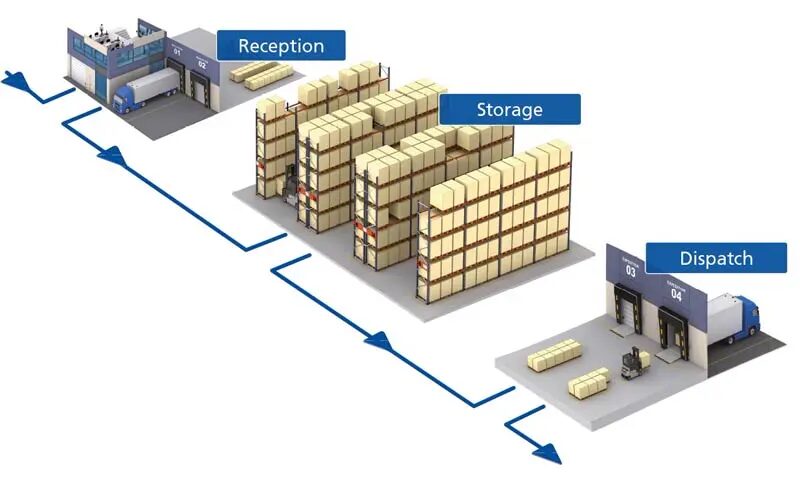
The 3D model replicates a realistic warehouse layout, simulating the flow of goods from receiving to dispatch. It provides an immersive perspective on how products interact with various resources and processes. The bottleneck is visually highlighted, showing a concentration of goods and delays in the inbound workflow.
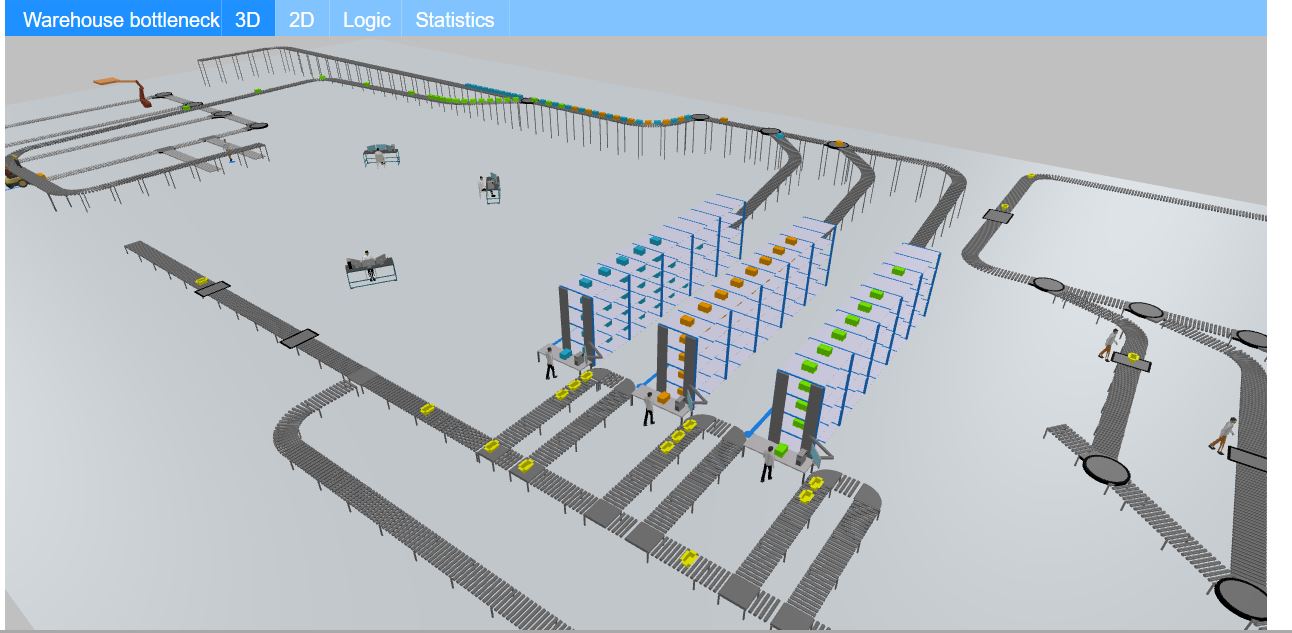
Certainly! Picture Figure 2 as a 3D window into the heart of a warehouse, offering a visual representation of the complex interplay between processes, resources, and the flow of goods. In this simulation model, you’ll witness the intricate dance of products as they traverse through various stages of the warehouse. The standout feature is the bottleneck, a point where the flow slows down, causing a concentration of goods [2]. The 3D model provides a tangible representation of this bottleneck, allowing you to observe how it impacts the overall efficiency of the supply chain within the warehouse. AnyLogic Simulation software brings this model to life, enabling you to interact with and manipulate different elements. It serves as a powerful tool for understanding, analyzing, and optimizing the dynamics of the warehouse environment, ensuring that the products move seamlessly from one stage to the next, ultimately enhancing the performance of the entire supply chain.
3.2 2D Model (Figure 3)
The 2D model offers a simplified top-down view of warehouse operations, ideal for identifying layout-induced inefficiencies. The bottleneck, often located at the queuing or unreserved area, is easily identifiable through process congestion and waiting times.
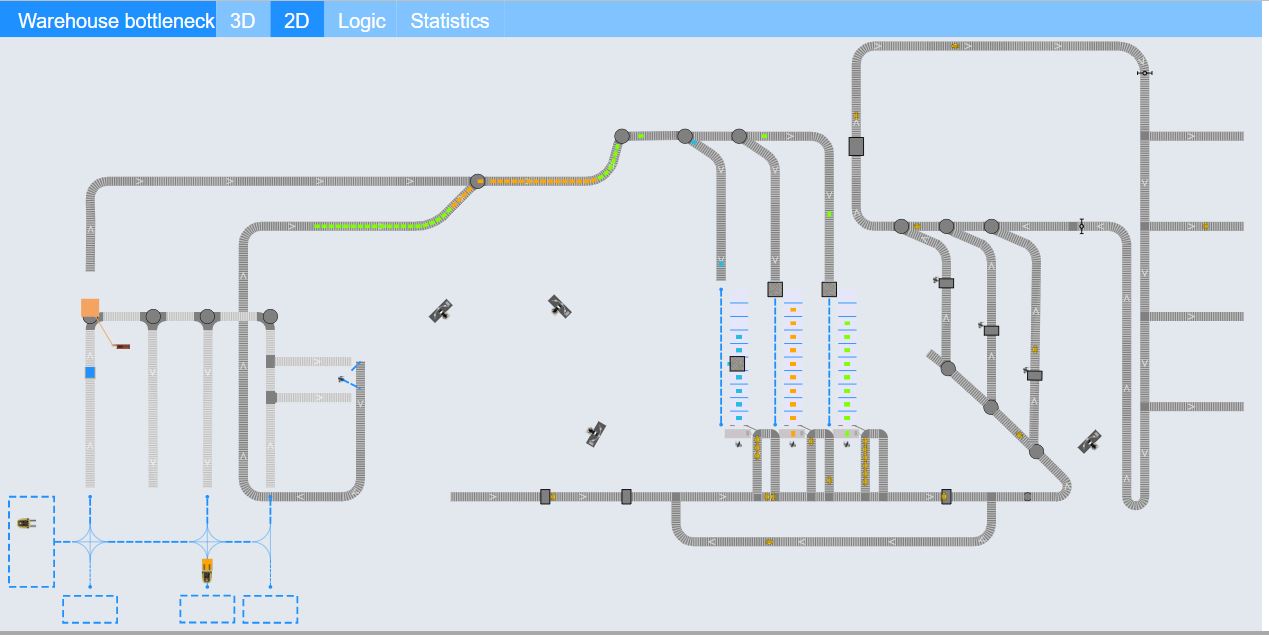
Figure 3 offers a 2D glimpse into the intricacies of a warehouse setting, specifically honing in on the challenge posed by a bottleneck in the system. In this simplified yet insightful model, you’ll see a representation of the warehouse layout, with key processes and pathways depicted in a two-dimensional space. The bottleneck, a critical point of congestion, is visually highlighted, allowing for a clear understanding of its impact on the overall flow of goods. AnyLogic Simulation software facilitates the creation of this model, providing a dynamic platform to simulate and analyze the movement of products within the warehouse [3]. Despite its two-dimensional nature, the model still captures the essence of the bottleneck issue, enabling you to explore potential solutions and optimize the operational efficiency of the supply chain. It serves as a valuable tool for gaining insights into how different variables and adjustments can influence the warehouse dynamics and contribute to a more streamlined and effective flow of goods.
You can download the Project files here: Download files now. (You must be logged in).
3.3 Warehouse Logic Diagram (Figure 4)
This figure outlines the control logic of warehouse operations, from goods arrival to dispatch. It shows the sequence of activities and decision points, with bottlenecks mapped as delays in conditional pathways. The logic diagram serves as the operational backbone of the simulation model, supporting scenario exploration and resource reallocation testing.
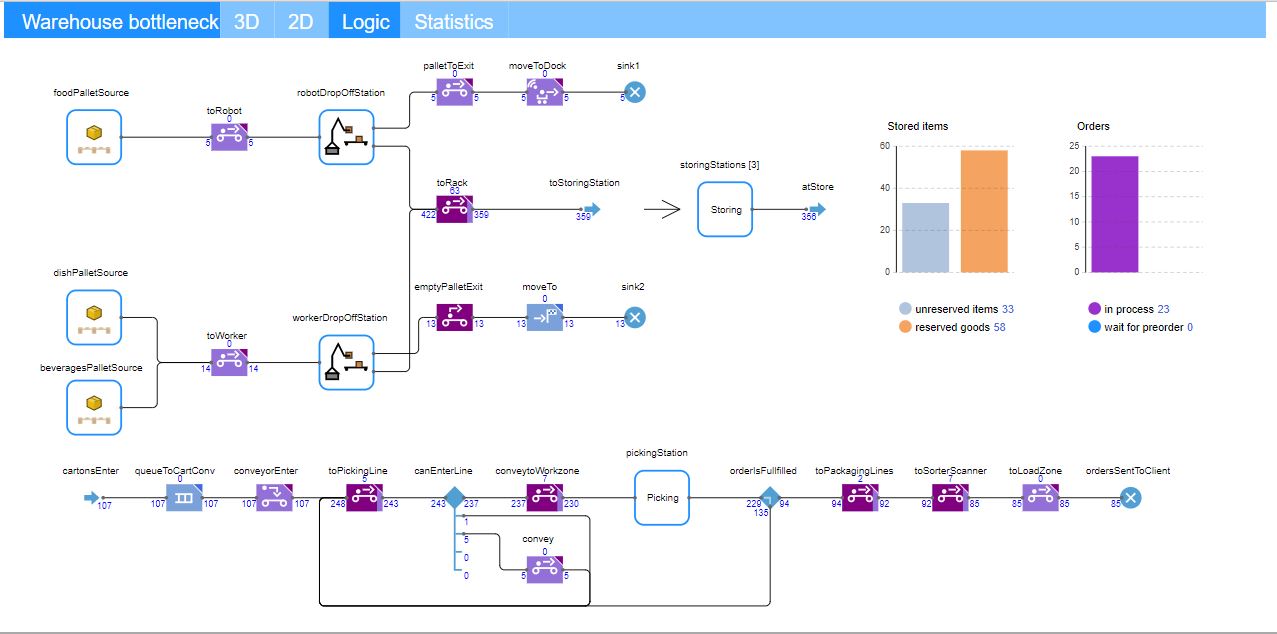
Figure 4 unveils the intricacies of the complete logic governing the warehouse with a bottleneck, providing a comprehensive overview of the underlying processes and decision-making pathways. In this visual representation, you’ll encounter a dynamic flowchart or logic diagram that encapsulates the entire operational framework of the simulated warehouse. Every node, arrow, and decision point in this comprehensive logic represents a crucial step or event within the warehouse’s processes.
Starting from the initiation of the simulation, the logic unfolds, detailing how goods enter the system, navigate through various stages, and eventually reach their destination. The bottleneck, a critical point of congestion, is likely to be a focal point in the logic, showcasing how goods are affected as they pass through this crucial juncture. Decision points and conditional pathways within the logic diagram represent the dynamic nature of the warehouse operations, capturing the complexity of managing resources, order fulfillment, and inventory control [4].
Figure 4 acts as a roadmap for understanding the inner workings of the warehouse simulation, offering a bird’s-eye view of the decision-making processes and events that shape the overall flow of goods. It serves as a valuable tool for analyzing and fine-tuning the simulation model, allowing for strategic adjustments to optimize efficiency, mitigate bottlenecks, and enhance the overall performance of the warehouse within the simulated environment.
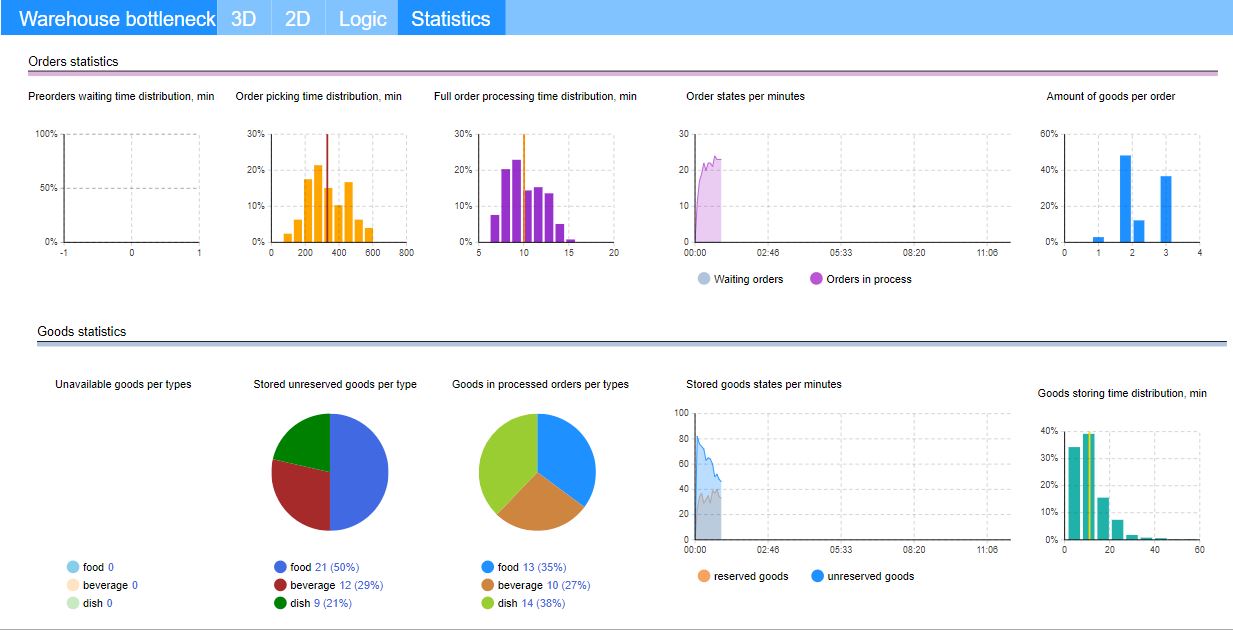
3.4 Statistical Analysis (Figure 5)
The simulation generated extensive statistical data including:
- Resource Utilization: Inbound resources such as unreserved storage, queuing zones, and racks showed high utilization, indicating congestion.
- Storage Time: Goods spend more time in inbound storage than outbound dispatch, confirming inefficiencies in intake handling.
- Order Distribution: Histograms indicate variability in order sizes and processing times, revealing inconsistent workflows.
- Processing and Waiting Times: Preorder waiting times and overall processing times suggest that inbound delays significantly affect order fulfillment KPIs.
These insights highlight a need for improved resource allocation in the receiving and sorting areas to alleviate bottlenecks and reduce total cycle time.
You can download the Project files here: Download files now. (You must be logged in).
Figure 5 shows the utilization for each resource. From the histograms generated from the simulation, it is clearly that the inbound workflow, which includes the unreserved area, queuing area and the rack system, has faced congestion and/or lack of free resources to handle the tasks and causes long waiting time to serve a particular inventory. We can see that the stored goods states per minute time to pull the pallets into the unreserved area is relatively larger than the outbound time to push the pallet out from the warehouse.
Figure 5 presents a comprehensive visual representation of key statistical insights derived from the warehouse with a bottleneck simulation. The first set of statistics revolves around the categorization of goods into “reserved” and “unreserved” Pi goods, showcasing the distribution of these categories over time. This graph provides a dynamic snapshot of how the warehouse allocates and handles goods, shedding light on potential areas of improvement and efficiency in the process.
The second aspect delves into the distribution of goods storing time, depicted through a histogram. This visualization allows you to understand the temporal patterns associated with storing goods, identifying any notable trends or irregularities. It serves as a valuable tool for optimizing storage processes, ensuring that goods spend an optimal amount of time within the warehouse before being dispatched [5].
Moving on to order-related statistics, Figure 5 includes histograms illustrating the distribution of orders and the amount of goods per order. These graphs offer insights into order patterns, providing a basis for refining order management strategies. Additionally, the full order processing time distribution graph provides a comprehensive overview of the time taken to fulfill orders, aiding in the identification of potential bottlenecks or delays in the order fulfillment process. Lastly, the preorders waiting time distribution graph sheds light on the time customers wait for their preorders to be processed, offering crucial insights into customer satisfaction and order processing efficiency. Together, these statistics contribute to a holistic understanding of the warehouse’s performance, guiding strategic decisions for optimization and improvement.
4. Shipping and returns
The final step in the warehouse process is to ship the packed goods to their next destination, whether to a retail store or directly to a consumer. In today’s world of same-day delivery, timing is key. But, of course, not every journey ends with a happy customer; some items make the return trip. Therefore, managing returns efficiently is critical, as it impacts inventory and possibly profitability.
Each is connected to another, and any inefficiency in one field consequently affects the others, leading to higher costs and delays. This raises two crucial questions: What kind of problems does the business face, and how should it be minimized? Long story short, warehouse optimization is the key. But first, let’s find out why.
5. Challenges in warehouse management
There are whole sets of challenges that come with effectively managing a warehouse; each of those can hit the bottom line and affect customer satisfaction. Here are some of the most common hurdles warehouse managers face today:
- Space utilization
- Inventory accuracy
- Labor management
- Order fulfillment speed
- Adapting to technology
Each of these challenges is unique and requires different tactics to overcome. Often, companies choose to optimize their warehouse operations. But what is warehouse optimization, what are the types, and why is it important?
6. Warehouse optimization: types and importance
Warehouse optimization operations involve strategic changes and overhauls to improve efficiency and effectiveness. It is an important concern in logistics management, where better performance is pursued with minimal costs.
Several types of warehouse optimization strategies exist. Here are some key approaches that can significantly improve operational efficiency.
6.1. Layout improvements
The first step toward warehouse optimization is considering the layout and making changes accordingly. A well-designed layout ensures a smooth flow of goods, thus minimizing the time taken for travel during picking operations.
For example, placing high-demand items near packing stations is a good way to expedite order fulfillment. Moreover, thoughtful layout planning can reduce unnecessary movements, decrease labor costs, and increase productivity.
6.2. Inventory management
Another important factor is effective and efficient inventory management. This involves having the right amount of stock at the right time, which helps avoid excess inventory or stockouts. Efficient inventory management not only reduces holding costs but also improves cash flow.
6.3. Equipment upgrades
Utilizing the right tools and equipment in the warehouse can lead to significant efficiency improvements. Automated storage and retrieval systems (AS/RS) can increase the speed of goods movement while reducing manual handling errors.
In real life, AS/RS automates product movement. By using such equipment, businesses can make warehouse operations faster, safer, and more cost-effective.
You can download the Project files here: Download files now. (You must be logged in).
6.4. Process improvement
Similarly, warehouse operations can be streamlined and improved by introducing advanced software systems like Warehouse Management Systems (WMS) or Enterprise Resource Planning (ERP). These systems help manage resources better, track inventory levels accurately, and provide valuable analytics for further improvements.
Therefore, optimizing warehouse operations is not just about making things faster; it’s about smarter management of resources, space, and time to achieve operational excellence.
Conclusion
In conclusion, the exploration of the supply chain dynamics within a warehouse, coupled with the challenges presented by bottlenecks, has been a multifaceted journey illuminated by the power of AnyLogic Simulation software. Through the immersive 3D model in Figure 1, we witnessed the virtual ballet of goods navigating various processes, with a bottleneck standing as a pivotal obstacle. This dynamic visualization provided a tangible representation of the complexities inherent in warehouse operations. Figure 2, in its 2D simplicity, honed in on the bottleneck issue, offering a clear depiction of the warehouse layout and the critical point where the flow of goods encounters resistance.
The statistical insights presented in Figure 5 further enriched our understanding, providing nuanced data on reserved and unreserved goods, storing time distributions, order histograms, and processing time dynamics. These statistics serve as a compass, guiding us through the intricacies of order fulfillment, storage optimization, and customer satisfaction within the simulated warehouse environment.
Finally, the logic unveiled in Figure 4 encapsulates the complete operational framework of the warehouse, mapping out the decision points and pathways that shape the destiny of each product. It acts as a comprehensive guide, offering a roadmap for strategic adjustments to enhance efficiency and mitigate bottlenecks. The integration of AnyLogic Simulation software in this exploration has been instrumental, providing a dynamic platform to simulate, analyze, and optimize the supply chain dynamics within the warehouse. In this virtual realm, we not only observed the challenges but actively engaged in shaping solutions, ensuring a smoother, more efficient flow of goods through the supply chain labyrinth.
References
[1] Chopra, S., & Meindl, P. (2016). Supply Chain Management: Strategy, Planning, and Operation (6th ed.). Pearson.
[2] Karim, A., Rahman, M. M., & Shah, S. R. (2018). Productivity indicators of warehouse operations: A framework for performance assessment. Journal of Supply Chain Management, 23(4), 45–52.
[3] Borshchev, A. (2013). The Big Book of Simulation Modeling: Multimethod Modeling with AnyLogic 6. AnyLogic North America.
[4] Banks, J., Carson, J. S., Nelson, B. L., & Nicol, D. M. (2010). Discrete-Event System Simulation (5th ed.). Pearson.
[5] AnyLogic Company. (2022). AnyLogic Simulation Software: Features and Use Cases. [Online]. Available: https://www.anylogic.com
You can download the Project files here: Download files now. (You must be logged in).


Responses