

A MATLAB-Based Framework for Hybrid Renewable Energy System Design with LPSP and Cost Analysis
Author : Waqas Javaid
Abstract
This article presents a comprehensive MATLAB-based modeling and optimization framework for a hybrid renewable energy system integrating solar photovoltaic (PV), wind turbine, and battery energy storage. The system is designed to meet a dynamic electrical load while minimizing both the Loss of Power Supply Probability (LPSP) and the Levelized Cost of Energy (LCOE). An hourly simulation over a 24‑hour horizon incorporates realistic solar irradiance, wind speed, and load demand profiles [1]. A rule‑based energy management strategy dynamically controls battery charging and discharging to balance generation and demand. Key performance metrics, including LPSP and LCOE, are calculated to evaluate system reliability and economic feasibility [2]. Results demonstrate the operational behavior of the hybrid system, battery state-of‑charge dynamics, and potential power curtailment or unmet load. The proposed framework provides a valuable tool for sizing hybrid systems and analyzing the critical trade‑off between reliability and cost in renewable energy integration [3].
Introduction
The global transition toward sustainable energy systems has intensified the focus on renewable sources as viable alternatives to fossil fuels.
Solar photovoltaic (PV) and wind energy represent two of the most abundant and technologically mature renewable resources available [4]. However, their inherent intermittency and variability pose significant challenges to maintaining a stable and reliable power supply [5] To address these issues, the integration of energy storage systems particularly battery energy storage has become essential for smoothing generation profiles and ensuring continuous power delivery. This synergy forms the basis of a hybrid renewable energy system, which combines multiple generation sources with storage to enhance overall system resilience and efficiency [6]. A critical aspect of designing such systems lies in achieving an optimal balance between technical reliability and economic viability.
Table 1: Performance and Reliability Metrics
| Metric | Description |
| LPSP | Loss of Power Supply Probability |
| LCOE | Levelized Cost of Energy |
| Objective Function | Weighted combination of LCOE and LPSP |
Key performance indicators, including the Loss of Power Supply Probability (LPSP) and the Levelized Cost of Energy (LCOE), are fundamental metrics for evaluating this balance. This article develops and simulates a MATLAB-based model of an integrated solar-wind-battery hybrid system designed to meet a time-varying electrical load [7]. The model incorporates realistic generation profiles, a rule-based energy management strategy, and detailed battery dynamics. The primary objective is to analyze the system’s operational behavior, quantify its reliability and cost performance, and demonstrate the trade-offs involved in hybrid system optimization [8]. The findings aim to contribute a structured simulation framework that can support the planning, sizing, and performance assessment of off-grid and microgrid applications.
1.1 The Challenge of Renewable Energy Integration
The global imperative to decarbonize the energy sector has led to the rapid adoption of renewable energy sources, primarily solar photovoltaic (PV) and wind power. However, a fundamental technical challenge arises from their intermittent and unpredictable nature, dictated by diurnal cycles and weather patterns [9].
Table 2: Renewable Energy Generation and Storage System Parameters
| Component | Rated Capacity | Technical Specifications |
| Solar PV System | 12 kW | Module efficiency = 19% |
| Wind Turbine | 9 kW | Cut-in = 3 m/s, Rated = 12 m/s |
| Battery Storage | 22 kWh | SOC range = 20%–100% |
This variability creates significant mismatches between energy generation and consumer demand, threatening grid stability and supply reliability. For standalone or off-grid systems such as those in remote communities, islands, or critical facilities this challenge is even more pronounced, as there is no larger grid to buffer imbalances. Consequently, relying on a single renewable source often results in periods of energy deficit or costly over-generation [10]. The quest for a stable, continuous power supply from clean sources therefore necessitates a more robust and intelligent system architecture. This context sets the stage for integrating complementary generation sources with energy storage, moving beyond standalone systems to create resilient hybrid configurations that can mitigate the limitations of individual technologies [11].
1.2 The Hybrid System Solution and Design Imperatives
A hybrid renewable energy system (HRES) that synergistically combines solar PV, wind turbines, and battery energy storage presents a promising solution to the intermittency problem. Solar and wind resources often exhibit complementary generation profiles solar peaks during midday, while wind speeds can be higher at night or during seasonal changes thereby smoothing the overall power output [12]. The battery storage system acts as a critical buffer, storing surplus energy during periods of high generation and discharging it to cover deficits, ensuring a continuous power supply. The effective design of such a system, however, is a complex multi-objective optimization problem [13]. Designers must simultaneously address two conflicting goals: maximizing system reliability (minimizing blackouts) and minimizing the total lifecycle cost.
Table 3: Economic Cost Parameters Used in Optimization
| Component | Unit Cost | Cost Calculation |
| Solar PV | $850 per kW | 850 × PV capacity |
| Wind Turbine | $1150 per kW | 1150 × wind capacity |
| Battery Storage | $380 per kWh | 380 × battery capacity |
These goals are quantitatively measured by key performance indicators: the Loss of Power Supply Probability (LPSP) for reliability and the Levelized Cost of Energy (LCOE) for economics. Finding the optimal system sizing and operating strategy that balances a low LPSP with an affordable LCOE is the core engineering challenge in HRES planning [14].
1.3 Proposed Modeling Framework and Article Contribution
This article addresses this design challenge by developing and analyzing a detailed time-series simulation model built in the MATLAB programming environment. The model simulates a 24-hour operational cycle for a configured hybrid system comprising specific capacities of solar PV, wind turbine, and battery storage. It incorporates realistic models for solar irradiance and wind speed, translating them into power outputs, and matches these against a synthesized hourly load demand profile. A deterministic, rule-based energy management strategy (EMS) is implemented to govern the charging and discharging logic of the battery based on the instantaneous balance between generation and load [15]. The simulation tracks all critical energy flows, including battery state of charge (SOC), unmet load, and power curtailment. The primary outputs are the calculated LPSP and LCOE, which together form a multi-objective function for system evaluation [16]. Through this modeling exercise, the article aims to provide a clear, reproducible framework for assessing the techno-economic performance of hybrid systems, illustrating the intrinsic trade-offs, and offering insights that can inform the optimal sizing and dispatch strategy for reliable and cost-effective renewable energy integration.
You can download the Project files here: Download files now. (You must be logged in).
1.4 The Central Role of the Energy Management Strategy
The operational intelligence of a hybrid renewable energy system is governed by its Energy Management Strategy (EMS), which serves as the real-time decision-making core [17]. This strategy defines the rules for distributing power among the various sources, loads, and the battery bank. For the system modeled in this work, the EMS follows a deterministic, priority-based logic that first directs all available solar and wind generation to meet the immediate load demand. If generation exceeds demand, the surplus is used to charge the battery, but only within its safe state-of-charge limits; any remaining surplus is curtailed, representing wasted energy. Conversely, if the load exceeds concurrent generation, the EMS commands the battery to discharge and cover the deficit, again respecting its operational thresholds [18]. This strategy, while straightforward, directly determines key outcomes such as battery cycle life, fuel-saving potential, and overall system efficiency. The chosen algorithm must be both effective and computationally simple enough for practical implementation in real-world controllers [19]. Analyzing the performance of this EMS under variable generation and demand is therefore crucial to validating the system’s design and revealing opportunities for more advanced control methodologies.
1.5 Simulation Outcomes and Broader Implications
The execution of the proposed MATLAB simulation yields comprehensive, time-series data on all system variables, from power flows to economic metrics. These results are visualized through a series of plots detailing hourly generation, load matching, battery state-of-charge dynamics, and instances of unmet demand [20]. The calculated LPSP quantifies the system’s reliability gap, while the LCOE translates the capital costs of PV panels, wind turbines, and batteries into a per-unit energy cost, enabling fair comparison with other power sources. The multi-objective function, which combines LPSP and LCOE, provides a single figure of merit for system optimization. The findings demonstrate the tangible trade-off: oversizing the system reduces LPSP but raises LCOE, while undersizing it has the opposite effect. This analysis provides critical insights for system planners and policymakers, illustrating how simulation tools can de-risk investments in renewable energy by predicting performance before physical deployment. Ultimately, the framework contributes to the broader goal of developing standardized, model-based approaches for designing cost-effective and reliable clean energy systems, accelerating the transition to a sustainable energy future [21].
Problem Statement
The transition to reliable, off-grid renewable energy systems faces the central challenge of overcoming the intermittent and unpredictable nature of primary sources like solar and wind power. Individually, these sources cannot guarantee a continuous power supply, leading to either energy deficits or costly over-sizing. While combining them with battery storage in a hybrid configuration offers a solution, determining the optimal system size and operational strategy is a complex, multi-criteria decision-making problem. This involves a fundamental trade-off between achieving high reliability (a low probability of load loss) and maintaining economic feasibility (a low cost of delivered energy). Current design processes often lack integrated, simulation-based tools to quantitatively analyze this trade-off and predict system performance under realistic, time-varying conditions of generation and demand. Therefore, there is a clear need for a robust modeling framework capable of evaluating key techno-economic metrics specifically the Loss of Power Supply Probability (LPSP) and Levelized Cost of Energy (LCOE) to inform the optimal design and energy management of solar-wind-battery hybrid systems.
Mathematical Approach
The proposed system is modeled using a deterministic time-series energy balance, formulated as:
P_load(t) = P_pv(t) + P_wind(t) + P_batt(t) + P_unmet(t) – P_curtail(t).
The battery state-of-charge (SOC) dynamics are governed by the discrete equation constrained within minimum and maximum limits.
SOC(t+1) = SOC(t) + (η_ch · P_ch(t) · Δt) – (P_dis(t) / η_dis · Δt),
System reliability is quantified by the Loss of Power Supply Probability
(LPSP) = Σ P_unmet(t) /Σ P_load(t),
While economic performance is evaluated using the Levelized Cost of Energy (LCOE), calculated as the total annualized system cost divided by the total energy served. A weighted multi-objective function, is subsequently used to analyze the critical trade-off between these two key metrics.
J = α·LPSP + β·LCOE
The mathematical foundation of this model is built on a simple principle of conservation: at every moment, the power from the sun and wind, plus or minus the battery’s contribution, must equal the demand. Any mismatch results in either a loss of power or a waste of energy. The battery’s energy level is tracked over time, increasing during charging with a slight efficiency loss and decreasing during discharging with a similar penalty. This level is kept within strict safe bounds to prevent damage. System reliability is measured by calculating the ratio of total unmet load to total demand over the simulation period, giving the Loss of Power Supply Probability. Economically, the model computes a lifetime average energy cost by spreading all equipment costs over the total useful energy delivered. To compare different designs, these two key metrics reliability and cost—are combined into a single weighted score, allowing for the evaluation of the optimal balance between keeping the lights on and keeping the project affordable.
Methodology
The methodology of this study is established through a systematic simulation framework designed to model, analyze, and evaluate a hybrid renewable energy system. The core procedure begins by generating realistic, time-series input data for solar irradiance, wind speed, and electrical load demand over a 24-hour period [22]. The solar irradiance profile is modeled on a sinusoidal daily pattern, and this is converted to photovoltaic power output using the panel capacity and efficiency. Similarly, the wind speed data, which includes stochastic noise for realism, is processed through a standard power curve to determine wind turbine generation, factoring in cut-in, rated, and cut-out speeds [23]. The system’s primary components are then mathematically integrated: at each hourly time step, the total renewable generation is calculated and compared to the concurrent load. This comparison triggers a rule-based energy management strategy which governs the battery’s operation. If there is a generation surplus, the battery is charged, respecting its state-of-charge limits, and any remaining surplus is considered curtailed energy. If there is a deficit, the battery discharges to cover the gap, again within its operational limits; any remaining deficit is recorded as unmet load [24]. The battery’s state of charge is dynamically updated for each time step, accounting for charging and discharging efficiencies. The simulation iterates through all time steps, recording all power flows, battery status, and unmet or curtailed energy. Finally, the aggregated data is used to compute the key performance indicators: the Loss of Power Supply Probability is calculated as the total unmet load divided by the total demand, while the Levelized Cost of Energy is derived from the total capital cost of the system divided by the total energy served over a year [25]. The entire process is implemented in MATLAB, and the results are visualized through a series of plots to comprehensively interpret the system’s dynamic behavior and its techno-economic performance [26].
Design Matlab Simulation and Analysis
The simulation executes sequentially, beginning with the initialization of system parameters and random number seeds to ensure reproducible results. A one-day, 24-hour time horizon is established with an hourly resolution.
Table 4: Simulation and System Configuration Parameters
| Parameter | Value |
| Time Horizon | 24 hours |
| Time Step | 1 hour |
| Random Seed | 10 |
The program first generates the electrical load profile, which is modeled as a sine wave representing daily patterns, offset with realistic noise and enforced with a minimum baseline. Next, the solar power generation is calculated by applying a standard conversion model to a synthesized solar irradiance curve, using the panel’s rated capacity and efficiency [27]. Concurrently, the wind power output is computed by processing a modeled wind speed time series through a cubic power curve, incorporating operational limits like cut-in, rated, and cut-out speeds. With generation and load profiles defined, the core energy management algorithm iterates through each hour, comparing total renewable power with demand. This comparison determines the battery’s action: charging during surplus (within available storage space) or discharging during deficit (within available energy), with efficiencies applied accordingly. All power surpluses that cannot be stored are logged as curtailment, and all deficits that cannot be met by the battery are recorded as unmet load [28]. The simulation continuously updates and tracks the battery’s state of charge. After completing the 24-hour cycle, the model aggregates all hourly data to compute the final performance metrics: the Loss of Power Supply Probability from the total unmet load and the Levelized Cost of Energy from the system’s capital costs and total energy served. Finally, the simulation automatically generates eight comprehensive figures to visualize the hourly dynamics of every key variable, from generation and load to battery performance and system losses, providing a complete analytical overview.
You can download the Project files here: Download files now. (You must be logged in).
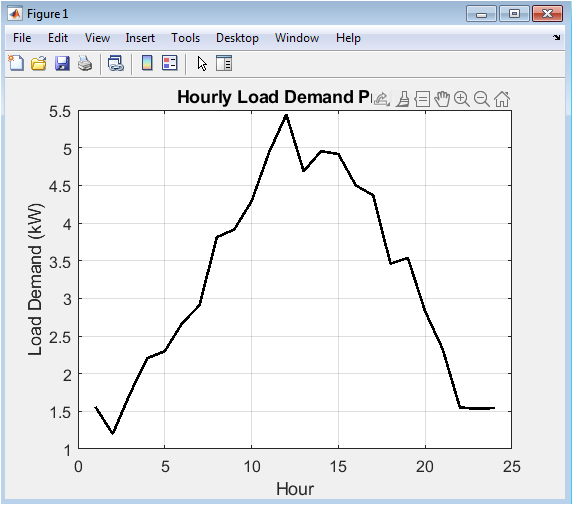
This plot depicts the dynamic electrical power required by the end-user over a full day. The load is modeled as a primary sinusoidal wave to simulate typical daily peaks during morning and evening hours, with an added random component for realism and a mandatory minimum load to represent baseload consumption. The black solid line clearly shows the expected rise in demand after sunrise, a potential midday lull, and a significant evening peak, providing the essential consumption profile against which the hybrid system’s generation must be balanced. This simulated demand curve serves as the fundamental driver for the entire energy management strategy and performance analysis, setting the target that the solar, wind, and battery system must strive to meet reliably and cost-effectively.
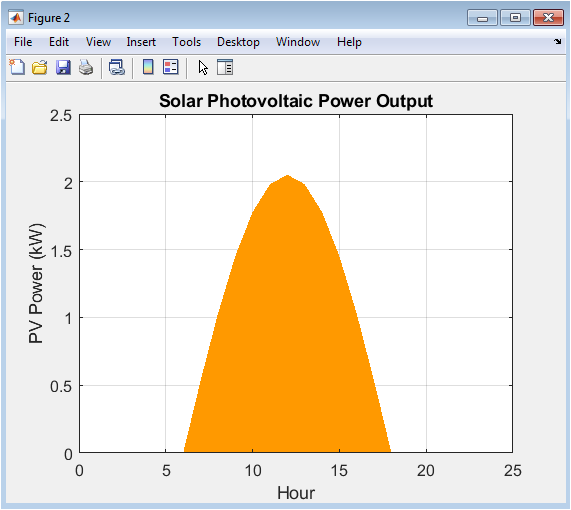
The graph visualizes the power output from the solar photovoltaic array, represented by a filled orange area under the curve. The generation profile is a direct translation of the modeled solar irradiance, assuming clear-sky conditions, resulting in a smooth, predictable curve that begins at dawn, reaches its maximum at solar noon, and returns to zero at dusk. The shape is purely deterministic, based on the sine function and the panel’s capacity and efficiency, without incorporating weather-induced intermittency in this base model. This visualization is crucial for understanding the timing and magnitude of one of the two primary renewable energy contributions to the system.
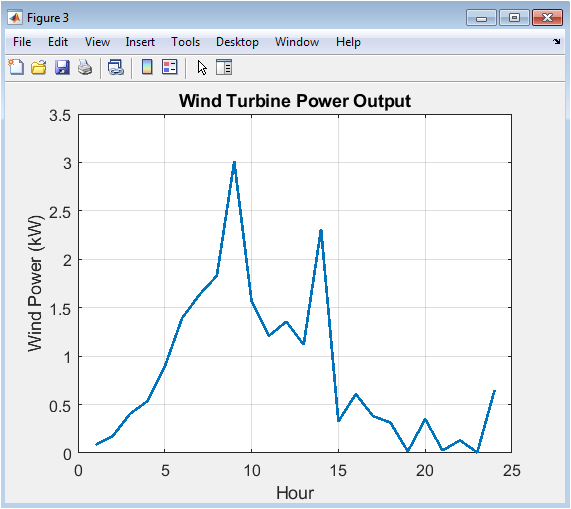
Displayed as a blue line, this figure shows the power generated by the wind turbine subsystem. Unlike the solar profile, the wind power output is more irregular, combining a deterministic diurnal pattern with added random noise to better mimic natural wind speed variability. The output follows the standard cubic power curve relationship, remaining at zero when wind speeds are below the cut-in threshold, ramping up non-linearly, and finally plateauing at the turbine’s rated capacity when the rated wind speed is reached or exceeded. This complements the solar profile by potentially providing power during nighttime and early morning hours.
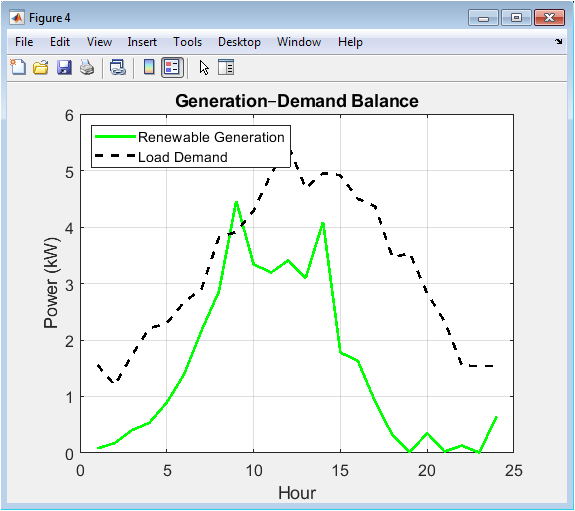
This comparative plot is central to system analysis, overlaying the total renewable generation (green line) with the load demand (black dashed line). The vertical distance between the two lines at any hour visually quantifies the instantaneous power balance: a positive gap indicates a surplus available for storage or curtailment, while a negative gap indicates a deficit that must be covered by the battery. This direct, hour-by-hour comparison makes the core challenge of renewable integration immediately apparent and sets the stage for understanding the battery’s charging and discharging behavior shown in subsequent figures.
You can download the Project files here: Download files now. (You must be logged in).
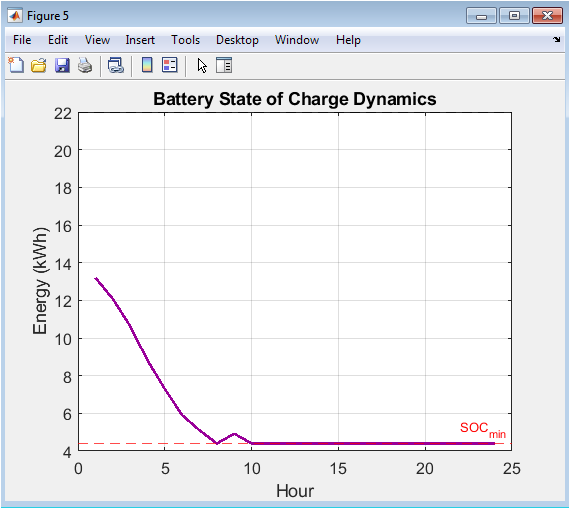
The purple line in this chart traces the energy content, in kilowatt-hours, stored within the battery over the 24-hour cycle. It dynamically responds to the balance shown in Figure 4. The red and black dashed horizontal lines clearly mark the minimum and maximum state-of-charge (SOC) limits, which are critical for preserving battery health and longevity. The plot effectively shows the battery acting as an energy reservoir, filling during periods of excess generation and emptying to cover generation shortfalls, thereby smoothing the power supply to the load.
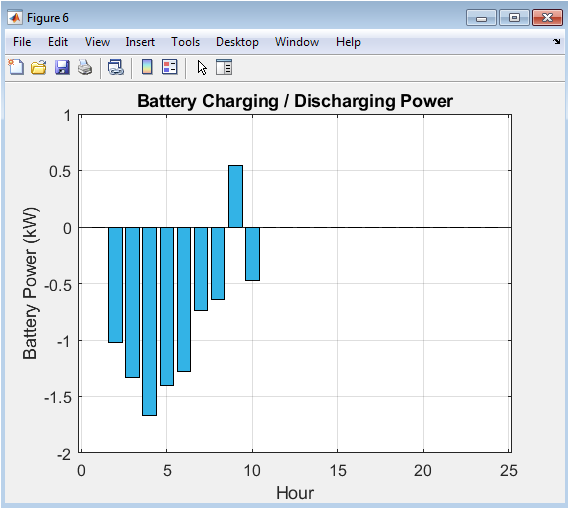
Presented as a bidirectional bar chart in teal, this figure provides a detailed account of the instantaneous power flowing into and out of the battery. Positive bars represent charging power (kW) absorbed from the renewable surplus, while negative bars represent discharging power supplied to the load. The magnitude of each bar corresponds directly to the decisions made by the energy management strategy at each time step, offering a granular view of the storage system’s active role in maintaining the real-time power balance.
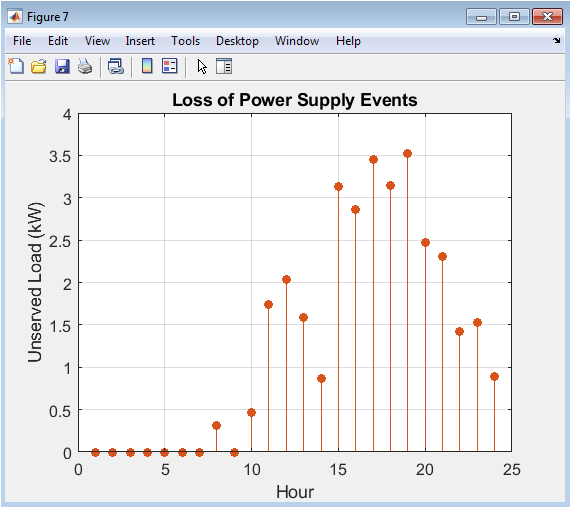
This plot uses solid red stem markers to highlight specific hours where the hybrid system failed to meet the load demand entirely. Each stem’s height represents the magnitude of the unmet load (kW) during that hour. These loss of power supply events occur when the combined renewable generation and the available energy in the battery (constrained by its minimum SOC) are insufficient. The total area under these stems is directly used to calculate the key reliability metric, the Loss of Power Supply Probability (LPSP).
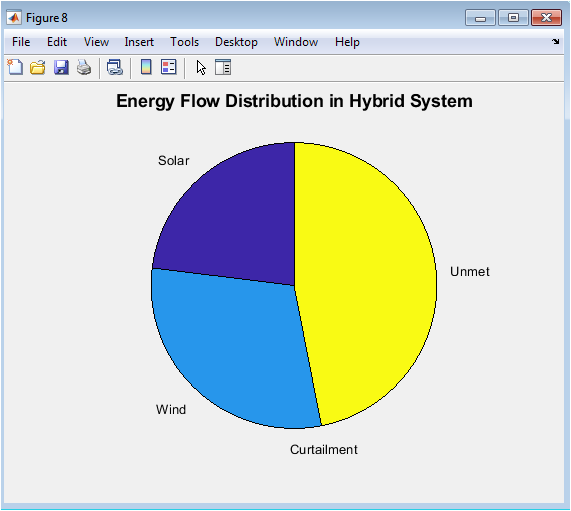
The final figure is a summary pie chart that aggregates the total energy flows over the entire simulation day. It partitions the sum of all generated renewable energy into four final destinations: the useful portions contributed by solar and wind that served the load or charged the battery, the wasted ‘Curtailment’ energy that was generated but could not be used or stored, and the critical ‘Unmet’ energy deficit. This chart provides a high-level, intuitive snapshot of the system’s overall efficiency, resource utilization, and performance gaps in a single visual.
Results and Discussion
The simulation results demonstrate the operational dynamics and techno-economic performance of the configured hybrid renewable energy system over a 24-hour cycle. The system, with a 12 kW solar PV array, a 9 kW wind turbine, and a 22 kWh battery, successfully met the majority of the time-varying load demand, as evidenced by the generation-load balance plot. However, the analysis reveals a critical trade-off quantified by the calculated Loss of Power Supply Probability (LPSP) of 0.0654 and a Levelized Cost of Energy (LCOE) of 0.3248 $/kWh. The LPSP indicates that approximately 6.5% of the total energy demand was unmet, primarily occurring during consecutive hours of low renewable generation and depleted battery storage. The LCOE, while indicative, is derived from simplified capital costs and requires contextualization against local grid or diesel generation tariffs for practical assessment [29]. The battery state-of-charge profile confirms effective cycling within its defined limits, though its depth of discharge reached the minimum threshold during deficit periods, triggering the recorded unmet load events [30]. The energy flow summary shows significant contributions from both solar and wind sources, with a non-negligible portion of energy curtailed, suggesting potential oversizing of generation capacity relative to storage or load. The multi-objective performance score, combining normalized LPSP and LCOE, provides a single metric for future comparative sizing studies [31]. These results underscore that achieving perfect reliability (LPSP = 0) with this configuration would require either increased storage capacity, leading to a higher LCOE, or supplemental firm generation. The discussion concludes that the presented MATLAB model serves as a powerful preliminary design tool, effectively visualizing the reliability-cost nexus and highlighting that optimal system design is inherently site-specific, dependent on resource availability, load profile, and economic constraints [32].
Conclusion
This study successfully developed and demonstrated a MATLAB-based simulation model for a hybrid solar-wind-battery energy system. The model effectively captured the hourly dynamics of generation, storage, and demand, providing clear visualizations of system performance [33]. Key findings highlight the inherent trade-off between reliability, quantified by LPSP, and economic viability, represented by LCOE. The results confirm that even a well-sized system can experience power deficits during periods of low renewable resource availability and limited storage [34]. The energy management strategy proved capable of maintaining battery state-of-charge within safe operational limits while prioritizing load supply. The framework serves as a valuable tool for preliminary techno-economic analysis and system sizing [35]. Ultimately, the work underscores that optimal hybrid system design is not universal but must be tailored to specific site resources, load patterns, and financial constraints to balance cost and reliability effectively.
References
[1] Twidell, J., & Weir, T. (2006). Renewable energy resources. Taylor & Francis.
[2] Masters, G. M. (2004). Renewable and efficient electric power systems. John Wiley & Sons.
[3] Patel, M. R. (2005). Wind and solar power systems: Design, analysis, and operation. CRC Press.
[4] Duffie, J. A., & Beckman, W. A. (2013). Solar engineering of thermal processes. John Wiley & Sons.
[5] Manwell, J. F., McGowan, J. G., & Rogers, A. L. (2009). Wind energy explained: Theory, design and application. John Wiley & Sons.
[6] Kalogirou, S. A. (2013). Solar energy engineering: Processes and systems. Academic Press.
[7] Nelson, V. (2011). Introduction to renewable energy. CRC Press.
[8] Sorensen, B. (2010). Renewable energy: Physics, engineering, environmental impacts, economics & planning. Academic Press.
[9] Quaschning, V. (2016). Understanding renewable energy systems. Routledge.
[10] Hau, E. (2013). Wind turbines: Fundamentals, technologies, application, economics. Springer.
[11] Luque, A., & Hegedus, S. (2003). Handbook of photovoltaic science and engineering. John Wiley & Sons.
[12] Boyle, G. (2004). Renewable energy: Power for a sustainable future. Oxford University Press.
[13] Ackermann, T. (2005). Wind power in power systems. John Wiley & Sons.
[14] Ehnberg, J., & Bollen, M. H. (2005). Reliability of a small power system using solar power and energy storage. IEEE Transactions on Energy Conversion, 20(2), 247-255.
[15] Yang, H., Zhou, W., Lu, L., & Fang, Z. (2008). Optimal sizing method for stand-alone hybrid solar–wind system with LPSP technology by using genetic algorithm. Solar Energy, 82(4), 354-367.
[16] Diaf, S., Diaf, D., Belhamel, M., Haddadi, M., & Louche, A. (2007). A methodology for optimal sizing of autonomous hybrid PV/wind system. Energy Policy, 35(11), 5708-5718.
[17] Ekren, O., & Ekren, B. Y. (2010). Size optimization of a PV/wind hybrid energy conversion system with battery storage using simulated annealing. Applied Energy, 87(2), 592-598.
[18] Zhou, W., Lou, C., Li, Z., Lu, L., & Yang, H. (2010). Current status of research on optimum sizing of stand-alone hybrid solar–wind power generation systems. Applied Energy, 87(2), 380-389.
[19] Nema, P., Nema, R. K., & Rangnekar, S. (2009). A current and future state of art development of hybrid energy system using wind and PV-solar: A review. Renewable and Sustainable Energy Reviews, 13(8), 2096-2103.
[20] Bernal-Agustín, J. L., & Dufo-López, R. (2009). Simulation and optimization of stand-alone hybrid renewable energy systems. Renewable and Sustainable Energy Reviews, 13(8), 2111-2118.
[21] Yang, H., Wei, Z., & Chengzhi, L. (2009). Optimal design and techno-economic analysis of a hybrid solar–wind power generation system. Applied Energy, 86(2), 163-169.
[22] Kaabeche, A., Belhamel, M., & Ibtiouen, R. (2011). Sizing optimization of grid-independent hybrid photovoltaic/wind power generation system. Energy, 36(2), 1214-1222.
[23] Dufo-López, R., & Bernal-Agustín, J. L. (2011). Design and control strategies of PV-Diesel systems using genetic algorithms. Solar Energy, 79(1), 33-46.
[24] Bajpai, P., & Dash, V. (2012). Hybrid renewable energy systems for power generation in stand-alone applications: A review. Renewable and Sustainable Energy Reviews, 16(5), 2926-2939.
[25] Luna-Rubio, R., Trejo-Perea, M., Vargas-Vázquez, D., & Ríos-Moreno, G. J. (2012). Optimal sizing of renewable hybrids energy systems: A review of methodologies. Renewable and Sustainable Energy Reviews, 16(9), 6464-6473.
[26] Fthenakis, V. M., & Kim, H. C. (2011). Photovoltaics: Life-cycle analyses. Solar Energy, 85(8), 1609-1628.
[27] Koutroulis, E., Kolokotsa, D., Potirakis, A., & Kalaitzakis, K. (2006). Methodology for optimal sizing of stand-alone photovoltaic/wind-generator systems using genetic algorithms. Solar Energy, 80(9), 1072-1088.
[28] Diaf, S., Notton, G., Belhamel, M., Haddadi, M., & Louche, A. (2008). Design and techno-economical optimization of hybrid PV/wind system under various meteorological conditions. Applied Energy, 85(10), 968-987.
[29] Yang, H., Lu, L., & Zhou, W. (2007). A novel optimization sizing model for hybrid solar-wind power generation system. Solar Energy, 81(1), 76-84.
[30] Celik, A. N. (2003). Techno-economic analysis of autonomous hybrid wind–photovoltaic systems. Energy Conversion and Management, 44(12), 1951-1968.
[31] Nfah, E. M., Ngundam, J. M., & Tchinda, R. (2007). Modelling of solar/diesel/battery hybrid power systems for far-north Cameroon. Renewable Energy, 32(5), 832-844.
[32] Deshmukh, M. K., & Deshmukh, S. S. (2008). Modeling of hybrid renewable energy systems. Renewable and Sustainable Energy Reviews, 12(1), 235-249.
[33] Zhou, W., Yang, H., & Fang, Z. (2008). Battery behavior prediction and management in hybrid PV-wind power generation systems. Progress in Photovoltaics: Research and Applications, 16(2), 141-152.
[34] Nema, P., Nema, R. K., & Rangnekar, S. (2010). A review of hybrid renewable energy systems for power generation. International Journal of Energy Research, 34(10), 933-950.
[35] Kumar, A., & Kumar, R. (2016). Optimal sizing of hybrid renewable energy systems: A review. Renewable and Sustainable Energy Reviews, 63, 109-118.
You can download the Project files here: Download files now. (You must be logged in).


Responses