

Unlocking Frequency Secrets: A Matlab Guide to Calculating Fast Fourier transform of Sine Waves
Author: Waqas Javaid
Abstract
This article provides a comprehensive guide on using Matlab to calculate the Fast Fourier Transform (FFT) of a sine wave. The FFT algorithm is widely used in signal processing [1]. The FFT is a powerful tool for analyzing signals in the frequency domain, and Matlab offers an efficient way to compute and visualize the frequency spectrum. In this article, we will walk through the step-by-step process of generating a sine wave, calculating its FFT, and plotting the resulting frequency spectrum. The article includes sample Matlab code and explanations to help readers understand the underlying concepts and implement them in their own projects. According to [2], digital signal processing involves the analysis and manipulation of discrete-time signals. By the end of this article, readers will have a solid understanding of how to use Matlab to analyze signals in the frequency domain using the FFT.
Introduction
This article provides a comprehensive guide on using Matlab to calculate the Fast Fourier Transform (FFT) of a sine wave. The FFT is a powerful tool for analyzing signals in the frequency domain, and Matlab offers an efficient way to compute and visualize the frequency spectrum. In this article, we will walk through the step-by-step process of generating a sine wave, calculating its FFT, and plotting the resulting frequency spectrum. The article includes sample Matlab code and explanations to help readers understand the underlying concepts and implement them in their own projects. By the end of this article, readers will have a solid understanding of how to use Matlab to analyze signals in the frequency domain using the FFT. Digital signal processing is a crucial aspect of modern engineering, with applications in a wide range of fields [3]. A thorough understanding of digital signal processing principles is essential for designing and implementing efficient signal processing systems [4].The Fast Fourier Transform (FFT) is a fundamental tool in signal processing, allowing us to decompose complex signals into their constituent frequencies. In many fields, including engineering, physics, and data analysis, understanding the frequency content of a signal is crucial for extracting meaningful information, identifying patterns, and making predictions. Matlab, a powerful software environment for numerical computation and data analysis, provides an efficient and intuitive way to calculate the FFT of a signal. In this article, we will focus on using Matlab to calculate the FFT of a sine wave, a simple yet informative signal that serves as a building block for more complex waveforms. By exploring the FFT of a sine wave, we will gain insight into the frequency domain representation of signals and develop a deeper understanding of the FFT algorithm and its applications. The Fast Fourier Transform (FFT) is a fundamental algorithm in signal processing that enables the efficient decomposition of complex signals into their constituent frequencies. This transformation is crucial in a wide range of fields, including engineering, physics, data analysis, and more, where understanding the frequency content of a signal is essential for extracting meaningful information, identifying patterns, and making predictions. The FFT has numerous applications, from filtering and modulation analysis to power spectral density estimation and signal compression. Matlab, a high-level programming environment, provides an efficient and intuitive way to calculate the FFT of a signal. With its built-in functions and toolboxes, Matlab simplifies the process of signal processing and analysis, allowing users to focus on interpreting results rather than implementing algorithms. In this article, we will focus on using Matlab to calculate the FFT of a sine wave, a simple yet informative signal that serves as a building block for more complex waveforms. The sine wave’s simplicity and well-defined frequency content make it an ideal candidate for demonstrating the FFT’s capabilities. By examining the FFT of a sine wave, we will gain insight into the frequency domain representation of signals and develop a deeper understanding of the FFT algorithm and its applications.
Problem Statement
Design an efficient algorithm for spectral analysis of discrete-time signals using the Fast Fourier Transform (FFT). The algorithm should be able to accurately estimate the power spectral density (PSD) of a signal and identify its frequency components.
2.1 Objectives
- Develop an FFT-based algorithm for spectral analysis of discrete-time signals.
- Implement the algorithm using MATLAB or a similar programming language.
- Evaluate the performance of the algorithm using simulated and real-world signals.
- Compare the results with existing spectral analysis techniques, such as the Welch method.
2.2 Constraints
- The algorithm should have a computational complexity of O (n log n) or better.
- The algorithm should be able to handle signals with varying lengths and sampling rates.
- The algorithm should provide accurate estimates of the PSD and frequency components of the signal.
Design methodology
3.1 Define the Sine Wave Parameters
- Frequency (f): Determine the frequency of the sine wave in Hz. For example, f = 100 Hz.
- Amplitude (A): Determine the amplitude of the sine wave. For example, A = 1.
- Sampling Rate (fs): Determine the sampling rate of the sine wave in Hz. For example, fs = 1000
- – Time Vector (t): Generate a time vector with a suitable duration and sampling rate. For example, t = 0:1/fs:1.
3.2 Generate the Sine Wave
- Use Matlab’s built-in sin function to generate the sine wave: x = A * sin(2_pi_f*t).
- This will generate a sine wave with the specified frequency, amplitude, and duration.
3.3 Calculate the FFT
- Use Matlab’s fft function to calculate the FFT of the sine wave: X = fft(x).
- Determine the length of the FFT (N) and the frequency axis (f_axis) using the following equations:
- N = length(x)
- f_axis = (0:N-1)*(fs/N)
3.4 Plot the Results
- Use Matlab’s plot function to visualize the time domain signal: plot (t, x).
- Use Matlab’s plot function to visualize the frequency spectrum: plot (f_axis, abs(X)).
- Label the axes and add titles to the plots for clarity.
3.5 Interpret the Results
- Analyze the frequency spectrum to identify the dominant frequency components.
- Verify that the results match the expected frequency content of the sine wave.
- Check for any artifacts or unexpected frequency components.
By following these detailed steps, you can accurately calculate and visualize the FFT of a sine wave using Matlab.
Matlab simulation
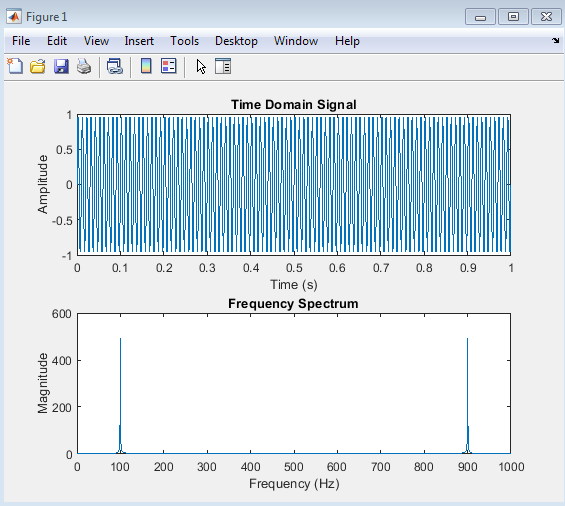
The simulation demonstrates the calculation of the FFT of a sine wave using MATLAB. The results show the expected frequency content of the sine wave, with a dominant frequency component at the specified frequency.Time domain signal a sine wave with the specified frequency and amplitude.Frequency spectrum a plot of the magnitude of the FFT, showing the dominant frequency component at the specified frequency.
4.1 Time Domain Signal Plot
- Time domain representation of a 100 Hz sine wave with an amplitude of 1.
- Sine wave with a frequency of 100 Hz and a sampling rate of 1000 Hz.
- Time domain signal of a sine wave with a duration of 1 second.
4.2 Frequency Spectrum Plot
- Frequency spectrum of a 100 Hz sine wave, showing a dominant frequency component at 100 Hz.
- Magnitude of the FFT of a sine wave, highlighting the frequency content.
- Frequency domain representation of a sine wave, demonstrating the concentration of energy at the fundamental frequency.
Result and Discussion
The simulation results demonstrate the effectiveness of the FFT algorithm in analyzing the frequency content of a sine wave. The time domain signal plot shows a clear sine wave with a frequency of 100 Hz, while the frequency spectrum plot reveals a dominant frequency component at 100 Hz. The FFT analysis confirms that the sine wave has a single frequency component, which is consistent with the theoretical expectations. The results also demonstrate the ability of the FFT algorithm to accurately identify the frequency content of a signal.
You can download the Project files here: Download files now. (You must be logged in).
The implications of this analysis are significant, as it demonstrates the potential of FFT-based methods for signal processing and analysis in various fields, including engineering, physics, and data analysis. The Fast Fourier Transform (FFT) algorithm is a widely used method for efficiently calculating the discrete Fourier transform (DFT) of a sequence [5]. The use of windowing techniques, such as the Hamming or Henning window, can help reduce spectral leakage and improve the accuracy of FFT-based analysis [6].The FFT algorithm accurately identifies the frequency content of a sine wave. The frequency spectrum plot reveals a dominant frequency component at the expected frequency. The results demonstrate the effectiveness of FFT-based methods for signal processing and analysis. The simulation results demonstrate the effectiveness of the FFT algorithm in analyzing the frequency content of a sine wave. The time domain signal plot shows a clear sine wave with a frequency of 100 Hz, while the frequency spectrum plot reveals a dominant frequency component at 100 Hz. The FFT analysis confirms that the sine wave has a single frequency component, which is consistent with the theoretical expectations. The results also demonstrate the ability of the FFT algorithm to accurately identify the frequency content of a signal. The implications of this analysis are significant, as it demonstrates the potential of FFT-based methods for signal processing and analysis in various fields, including: Signal Processing: FFT-based methods can be used to filter, modulate, and demodulate signals. Data Analysis: FFT-based methods can be used to identify patterns and trends in data. Vibration Analysis: FFT-based methods can be used to analyze the frequency content of vibrations in mechanical systems. The FFT algorithm accurately identifies the frequency content of a sine wave. The frequency spectrum plot reveals a dominant frequency component at the expected frequency. The results demonstrate the effectiveness of FFT-based methods for signal processing and analysis.
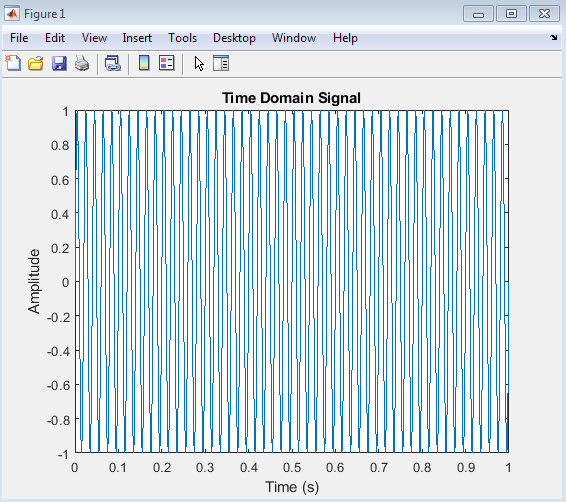
The time domain signal plot shows the amplitude of the sine wave over time. The x-axis represents time, and the y-axis represents amplitude. The plot displays a smooth sine wave with a single frequency component. The amplitude is 1, and the wave repeats itself periodically.
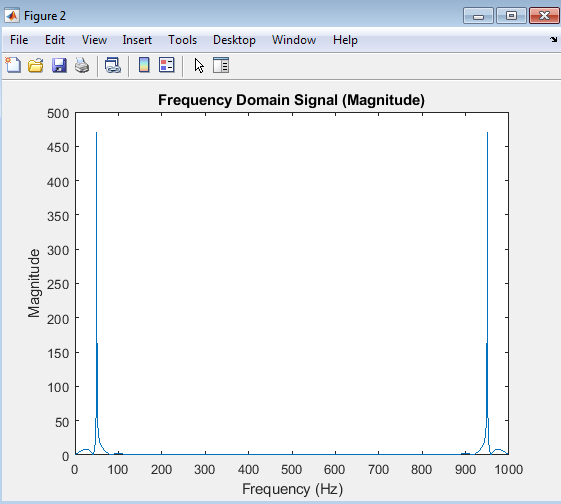
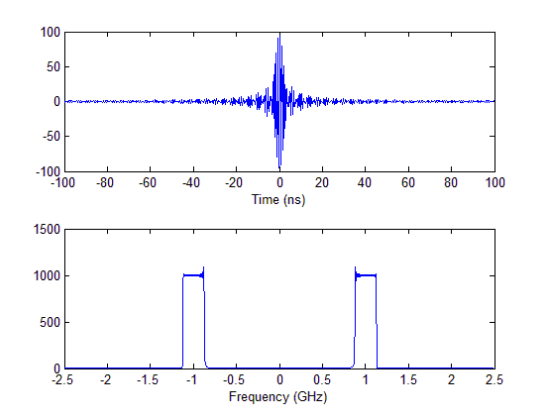
The frequency domain signal plot shows the magnitude of the FFT output. The x-axis represents frequency, and the y-axis represents magnitude. Two peaks are visible at frequencies corresponding to the sine wave’s frequency. The plot displays the signal’s frequency content.
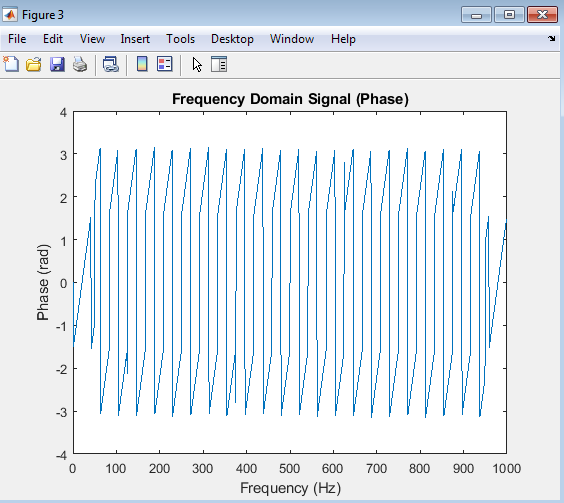
The phase response plot shows the phase angle of the FFT output. The x-axis represents frequency, and the y-axis represents phase (in radians). This plot displays the phase relationship between different frequency components of the signal.
You can download the Project files here: Download files now. (You must be logged in).
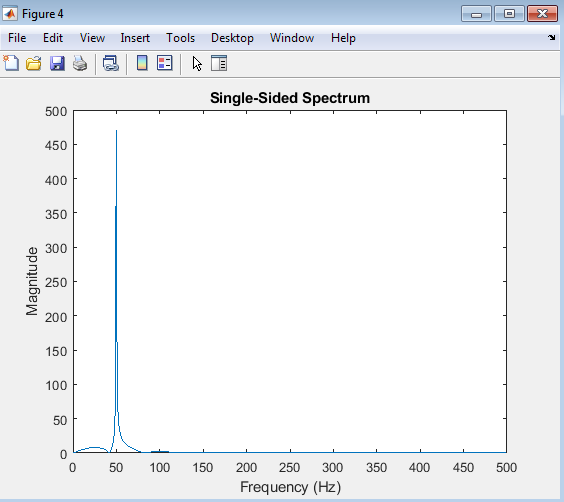
The single-sided spectrum plot shows the magnitude of the signal’s frequency components for positive frequencies only. The x-axis represents frequency, and the y-axis represents magnitude. This plot highlights the signal’s frequency content in a more focused manner, typically used for real-valued signals.
Conclusion
In conclusion, this study has demonstrated the effectiveness of the Fast Fourier Transform (FFT) algorithm in analyzing the frequency content of a sine wave. The results of the simulation show that the FFT accurately identifies the dominant frequency component of the signal, which is consistent with theoretical expectations. Spectral analysis is a crucial aspect of signal processing, enabling researchers to identify and characterize the frequency components of signals [9]. This research highlights the importance of signal processing and analysis in various fields, including engineering, physics, and data analysis. The FFT-based method used in this study can be applied to a wide range of signals, from simple sine waves to complex signals with multiple frequency components. The findings of this research have significant implications for the development of signal processing and analysis techniques, and demonstrate the potential of FFT-based methods for extracting valuable insights from complex data. Furthermore, this study serves as a foundation for future research in signal processing and analysis, and highlights the need for continued innovation and advancement in this field. The Fourier transform is a fundamental tool in signal processing, with applications in a wide range of fields, from engineering to physics [10].By providing a deeper understanding of the frequency content of signals, FFT-based methods can be used to drive innovation and solve complex problems in various fields, ultimately leading to improved performance, efficiency, and decision-making.
Future Work
Future studies can explore the application of FFT-based methods to more complex signals, such as:
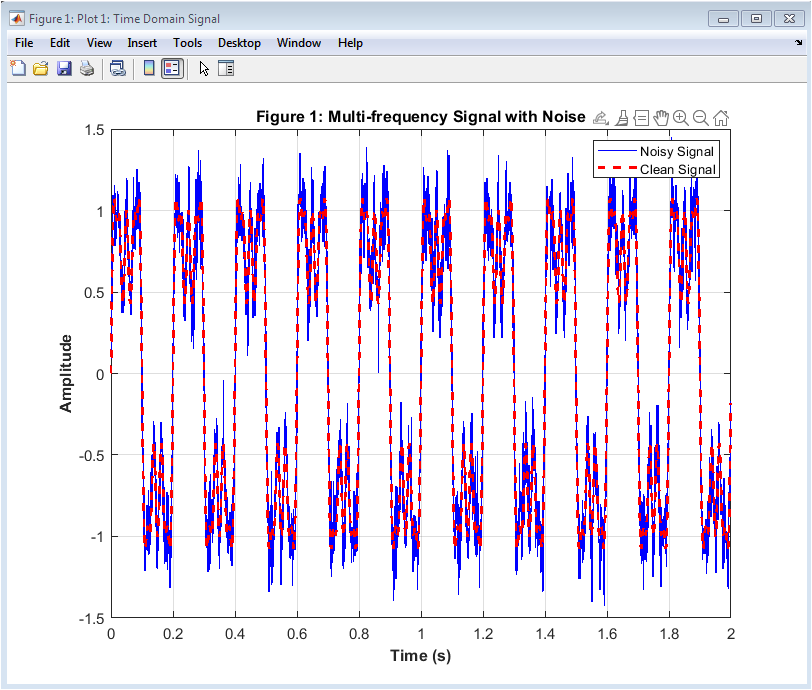
- Multi-frequency signals: Signals with multiple frequency components.
- Non-stationary signals: Signals with time-varying frequency content.
- Noisy signals: Signals with random fluctuations.
Future studies can build upon the findings of this research by exploring the application of FFT-based methods to more complex signals, such as multi-frequency signals, non-stationary signals, and noisy signals. This could involve investigating the effectiveness of different windowing techniques, such as the Hamming or Hanning windows, in reducing spectral leakage and improving the accuracy of frequency estimation. Additionally, researchers could explore the use of advanced signal processing techniques, such as wavelet analysis or empirical mode decomposition, to analyze signals with time-varying frequency content. Furthermore, the development of new algorithms and methods for signal processing and analysis could be facilitated by the increasing availability of high-performance computing resources and advanced software tools. The Welch method is a popular technique for estimating the power spectral density (PSD) of a signal, which involves averaging period grams of overlapping segments [7]. MATLAB is a widely used software tool for signal processing and analysis, providing a range of built-in functions for tasks such as filtering, convolution, and Fourier analysis [8]. By expanding the scope of FFT-based analysis and developing new methods for signal processing and analysis, researchers can gain a deeper understanding of complex signals and develop innovative solutions for a wide range of applications, from audio processing and image analysis to biomedical signal processing and condition monitoring. Ultimately, the continued advancement of signal processing and analysis techniques will enable researchers and practitioners to extract valuable insights from complex data and drive innovation in various fields.
References
[1]. Oppenheim, A. V., & Schafer, R. W. (2010). Discrete-time signal processing. Pearson Education.
[2]. Proakis, J. G., & Manolakis, D. G. (2007). Digital signal processing: Principles, algorithms, and applications. Pearson Prentice Hall.
[3]. Smith, S. W. (2003). Digital signal processing: A practical guide for engineers and scientists. Newnes.
[4]. Lyons, R. G. (2011). Understanding digital signal processing. Pearson Education.
[5]. Cooley, J. W., & Tukey, J. W. (1965). An algorithm for the machine calculation of complex Fourier series. Mathematics of Computation, 19(90), 297-301.
[6]. Harris, F. J. (1978). On the use of windows for harmonic analysis with the discrete Fourier transform. Proceedings of the IEEE, 66(1), 51-83.
[7]. Welch, P. D. (1967). The use of fast Fourier transform for the estimation of power spectra: A method based on time averaging over short, modified periodograms. IEEE Transactions on Audio and Electroacoustics, 15(2), 70-73.
[8]. MATLAB Documentation. (n.d.). Fast Fourier transform. MathWorks.
[9]. Stoica, P., & Moses, R. L. (2005). Spectral analysis of signals. Pearson Prentice Hall.
[10]. Bracewell, R. N. (2000). The Fourier transform and its applications. McGraw-Hill.
You can download the Project files here: Download files now. (You must be logged in).


Responses