

Drinking-Water Chlorine CT and Contact Tank Calculator
Calculate chlorine CT, T10 from a baffling factor, required contact-tank volume and maximum flow. Compare a Giardia log target with EPA tables and explore an illustrative tracer response.

Calculate drinking-water disinfection contact time and size a chlorine contact tank using the US EPA CT method. This tool is for water-treatment engineers, operators studying certification math, and students checking how flow, storage and baffling affect Giardia inactivation. It follows the June 2020 EPA Disinfection Profiling and Benchmarking Technical Guidance Manual and the free-chlorine tables in 40 CFR 141.74, checked on 29 October 2026.
Inputs accept explicit units such as 300000 gal and 5000 gal/min. US mode converts volume and temperature; flow stays labeled in m³/h, with a separate US gal/min result.
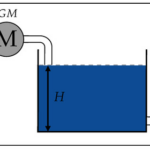
Start with the actual water volume at the tank’s minimum operating level and the peak flow through that disinfection segment. Select the EPA baffling classification accepted for the tank, or enter a site-approved factor derived from a tracer study. The nominal detention time is volume divided by flow. Multiplying it by the baffling factor gives T10, the effective disinfection contact time used in the CT calculation. Internal walls alone do not establish a factor: inlet distribution, outlet collection and short-circuiting matter too.
Enter the measured free-chlorine residual at the segment outlet, together with water temperature and pH for the condition being assessed. The residual is the disinfectant remaining after demand and decay; it is not the applied chlorine dose or total chlorine. Choose the Giardia log inactivation allocated to this segment after any regulator-approved removal credits. Three log means 99.9% inactivation; the calculator does not assign filtration credits.
The lookup offers linear interpolation in residual, pH and temperature, or conservative selection using the next colder temperature, higher pH and higher residual. It covers free residuals up to 3 mg/L and pH up to 9. The first residual row applies at or below 0.4 mg/L, the first pH column at or below 6, and the boundary temperature tables at or below 0.5°C and at or above 25°C. No values are extrapolated beyond the implemented limits.
Read achieved CT, required CT and their ratio together. A ratio of one means the entered numerical CT target is reached. Required water volume and maximum flow hold the entered outlet residual and baffling factor constant; changing the operating flow may change both in a real plant. The flow chart makes that sensitivity visible.
Press play on the tracer illustration to see a hypothetical step-tracer response and the 10% breakthrough concept. Its curve is constructed to match the selected T10 and mean detention time; it is not measured data or a prediction of this tank’s hydraulics. Use an approved tracer study to establish site performance.
This chlorine CT calculation addresses a single segment and Giardia only. It does not determine virus credit, Cryptosporidium control, chlorine dose, disinfection by-products or complete treatment compliance. Regulators decide compliance and must accept the operating assumptions.
How it is calculated
For one free-chlorine disinfection segment, use the water volume at minimum operating level and the peak flow through that segment. US EPA 815-R-20-003 (June 2020), Chapter 4 and Appendix G, gives the hydraulic method:
The outlet free residual represents disinfectant remaining after demand and decay, not the applied dose. Time is converted explicitly to minutes.
Required CT. Table B-1 (attached source s1, PDF page 88, printed B-2) supplies all 588 CT values for 3-log Giardia inactivation by free chlorine. Values were compared entry by entry with 40 CFR 141.74 Tables 1.1–1.6 on 29 October 2026; all matched. Linear mode interpolates successively in pH, temperature and residual without intermediate rounding, following Appendix H, Example H-2. Conservative mode selects the colder temperature, higher pH and higher residual. Use the first residual row for C ≤0.4 mg/L, first pH column for pH ≤6, coldest table for temperature ≤0.5°C, and 25°C table for warmer water.
The Chapter 5 log-ratio method gives:
The displayed Giardia estimate is ; no credit above the 3-log table basis is asserted. R compares the entered target only. It does not include filtration or other treatment credits.
Sizing at fixed residual and factor.
The required volume is operating water volume; structural/freeboard volume is outside this calculation.
Tracer illustration. For a step injection, normalized outlet tracer concentration is the residence-time cumulative distribution. A constructed lognormal curve has mean normalized time 1 and 10th percentile BF. With , and , its response is for . At BF=1 it becomes an ideal plug-flow step. This statistical illustration is derived here and supplies no hydraulic evidence. CT and sizing do not read the playing input.
Assumptions
- Single segment, steady peak flow, available operating water volume, and representative co-located outlet residual, pH and temperature.
- Disinfectant is free chlorine and the organism calculation is Giardia. Total chlorine, chloramines, ozone and chlorine dioxide require different CT methods.
- EPA baffling factors are approximate: unbaffled 0.1, poor 0.3, average 0.5, superior 0.7 and ideal plug flow 1.0 (Table G-1, attached s1, PDF page 144, printed G-2). Inlet and outlet design matter; the schematic does not determine a factor.
- The log target is the regulator-assigned inactivation needed in this segment after approved removal credits. It is not automatically the total treatment requirement.
- Required volume, limiting flow and the flow sweep hold residual and baffling factor fixed. Real changes in flow or tank operation may change residual, temperature, hydraulics and the accepted factor.
- A baffling factor and volume do not uniquely determine a tracer response. The animated curve is a hypothetical step response, not measured data, CFD, a pulse-injection concentration curve or proof of compliance.
Where it applies
Implements the US EPA Surface Water Treatment Rule CT method using EPA 815-R-20-003, June 2020, and the free-chlorine/Giardia tables in 40 CFR 141.74(b)(3), accessed 29 October 2026 (eCFR displayed Title 40 current through 23 October 2026). Check against the rules in force and the primacy agency's approved practice.
Implemented input range: water temperature 0–30°C, pH 5–9, outlet free chlorine >0 to 3 mg/L, segment target 0.5–3 log, and factor >0 to 1. Boundary table rules are stated under Method. This is not a basis for credit beyond 3 log, chlorine-dose selection, virus or Cryptosporidium credit, disinfection-by-product assessment, multi-segment credit summation, or acceptance of storage/parallel paths.
Confirm the usable volume and flow condition, monitoring locations, tracer-study applicability and factor with the regulator. Tank, baffle and chemical-feed installation or alteration belongs to qualified personnel.
References
- [US EPA, Disinfection Profiling and Benchmarking Technical Guidance Manual, EPA 815-R-20-003, June 2020](https://www.epa.gov/sites/default/files/2020-06/documents/disprof_bench_3rules_final_508.pdf). Chapters 4–5; Table B-1; Appendices D, G and H. Attached source s1.
- [40 CFR 141.74, Analytical and monitoring requirements](https://www.ecfr.gov/current/title-40/chapter-I/subchapter-D/part-141/subpart-H/section-141.74). Paragraph (b)(3), Tables 1.1–1.6; accessed 29 October 2026. Attached source s2. Federal table data are public domain.
Inputs
| Input | Symbol | Unit | Default |
|---|---|---|---|
| Water volume at minimum operating level Use actual water volume at minimum operating level; exclude displacement and unavailable storage. You may type an explicit unit, e.g. 300000 gal (US gallons). The global US switch displays volume in ft³. | V_water | m^3 | 1000 |
| Peak flow through this tank Use peak hourly flow through this segment. You may type an explicit US unit, e.g. 5000 gal/min; it converts to m³/h. The viewer's global US switch leaves flow in m³/h, so a US gal/min result is also provided. | Q_peak | m^3/h | 300 |
| Baffling classification EPA 2020 Table G-1 estimates. Class depends on inlet, outlet and internal flow distribution, not the count of drawn baffles. Obtain regulator acceptance. | baffle_class | Superior — 0.7 | |
| Site-approved baffling factor T10 / TDT Enter the factor accepted for this tank and flow condition. A factor alone cannot determine a tracer curve. | B_site | 0.7 | |
| Outlet free-chlorine residual Measured free residual at the end of this segment during peak flow, not applied dose or total chlorine. EPA lookup is limited to 3 mg/L. | C_out | mg/L | 1 |
| Water temperature Use the representative cold condition. Values ≤0.5°C use the coldest table; values above 25°C use 25°C conservatively. | T_water | °C | 10 |
| Water pH EPA table applies at pH ≤6 through 9. Values below 6 use the pH6 column; do not extrapolate above 9. | pH_water | 7 | |
| Required Giardia log inactivation in this segment Use the disinfection log target allocated by the regulator after approved removal credits. 0.5 log ≈68.4%; 1 log=90%; 3 log=99.9%. | L_target | 3 | |
| EPA CT table selection Conservative: round temperature down, pH and residual up. Interpolation is linear in all three table variables; retain regulator-approved practice. | lookup_mode | Linear interpolation (EPA Appendix H) | |
| Illustrative tracer elapsed time / nominal time Press ▶ to follow a hypothetical step-tracer response. This animation has no effect on CT or sizing and is not a tracer test. | theta | 0.7 |
Results
With the default inputs above, the calc gives:
| Result | Value |
|---|---|
| Effective contact time T10 | 140 min |
| Achieved chlorine CT | 140 mg·min/L |
| CT required for entered Giardia target | 112 mg·min/L |
| Achieved / required CT | 1.25 |
| Required operating water volume | 800 m³ |
| Maximum flow at fixed residual and factor | 375 m³/h |
| Giardia log estimate (capped at 3) | 3 |
| Maximum flow — US gallons per minute | 1,651.08 gal/min |
Checked against sources
Each case below was calculated by this calc and agrees with the value from its source (within the tolerance where one is shown).
EPA D-1: clearwell contact time and Giardia inactivation
Source: US EPA 815-R-20-003, June 2020, Example D-1, printed D-2 to D-4 (PDF 104–106): 300,000 US gal and 5,000 US gpm. Values converted exactly to m³ and m³/h; the printed geometric volume was rounded before this example's detention calculation.
Inputs: Water volume at minimum operating level = 1,136 m³; Peak flow through this tank = 1,136 m³/h; Water pH = 6; Baffling classification = Average — 0.5; the others as above.
| Result | Source | This calc |
|---|---|---|
| Nominal detention time at peak flow | 60 min | 60 min |
| Effective contact time T10 | 30 min | 30 min |
| Achieved chlorine CT | 30 mg·min/L | 30 mg·min/L |
| EPA CT for 3-log Giardia inactivation | 79 mg·min/L | 79 mg·min/L |
| Giardia log estimate (capped at 3) | 1.14 ± 0.002 | 1.139 |
| Peak flow in US gallons per minute | 5,000 gal/min | 5,000 gal/min |
EPA H-2: CT interpolated across pH, temperature and residual
Source: US EPA 815-R-20-003, Example H-2, printed H-3 to H-8 (PDF 155–160). Published answer 126.5 min·mg/L rounds intermediate results; full precision trilinear interpolation gives 126.52. Tolerance allows only published rounding.
Inputs: Outlet free-chlorine residual = 0.9 mg/L; Water temperature = 6 °C; Water pH = 6.7; the others as above.
| Result | Source | This calc |
|---|---|---|
| EPA CT for 3-log Giardia inactivation | 126.5 mg·min/L | 126.5 mg·min/L |
| CT required for entered Giardia target | 126.5 mg·min/L | 126.5 mg·min/L |
EPA H-1: conservative CT selection
Source: US EPA 815-R-20-003, Example H-1 and comparison in H-2: use 5°C, pH7 and 1.0mg/L to obtain149 min·mg/L.
Inputs: Outlet free-chlorine residual = 0.9 mg/L; Water temperature = 6 °C; Water pH = 6.7; EPA CT table selection = Conservative next table cell; the others as above.
| Result | Source | This calc |
|---|---|---|
| EPA CT for 3-log Giardia inactivation | 149 mg·min/L | 149 mg·min/L |
EPA Table B-1: cold/high-pH/high-residual corner
Source: US EPA 2020 Table B-1, printed B-2,0.5°C block,3mg/L row,pH9 column. Also40 CFR141.74 Table1.1.
Inputs: Outlet free-chlorine residual = 3 mg/L; Water temperature = 0.5 °C; Water pH = 9; the others as above.
| Result | Source | This calc |
|---|---|---|
| EPA CT for 3-log Giardia inactivation | 552 mg·min/L | 552 mg·min/L |
EPA Table B-1: warm/low-pH/low-residual corner
Source: US EPA 2020 Table B-1, printed B-2,25°C block,≤0.4mg/L row,pH≤6 column. Also40 CFR141.74 Table1.6.
Inputs: Outlet free-chlorine residual = 0.4 mg/L; Water temperature = 25 °C; Water pH = 6; the others as above.
| Result | Source | This calc |
|---|---|---|
| EPA CT for 3-log Giardia inactivation | 24 mg·min/L | 24 mg·min/L |





Responses