

Advanced Composite Laminate Analyzer, Bridging Micromechanics, Classical Laminate Theory, and Structural Reliability Using Matlab Simulation
Author : Waqas Javaid
Abstract
This article presents an integrated computational framework for the comprehensive analysis of fiber-reinforced composite laminates. The methodology bridges multiple scales, beginning with micromechanical homogenization to predict orthotropic lamina properties from constituent materials [1]. Classical Laminate Theory is implemented to construct the full ABD stiffness matrix for arbitrary stacking sequences, enabling accurate prediction of laminate response under combined membrane and bending loads [2]. The framework recovers through-thickness ply stresses and evaluates structural integrity using the Tsai-Wu failure criterion. To address design uncertainty, Monte Carlo simulation assesses reliability considering material property variations. The analysis is further enhanced through systematic parameter sweeps of fiber volume fraction and visualization tools including directional stiffness surfaces [3]. Results are synthesized across five specialized figures, providing engineers with a complete multi-scale perspective from constituent material selection to structural reliability within a unified workflow that supports both design optimization and failure analysis [4].
Introduction
Fiber-reinforced composite laminates have revolutionized modern engineering by offering an unparalleled strength-to-weight ratio and the ability to tailor material properties to specific loading conditions. However, their heterogeneous and anisotropic nature introduces significant complexity in predicting structural performance.
Traditional analysis often decouples the microscale interaction of fibers and matrix from the macroscale structural response, potentially overlooking critical failure mechanisms.
Table 1: Material Properties Database
| Property | Symbol | Fiber (Carbon) | Matrix (Epoxy) | Units |
| Young’s Modulus | E | 230 | 3.5 | GPa |
| Shear Modulus | G | 90 | 1.3 | GPa |
| Poisson’s Ratio | ν | 0.20 | 0.35 | – |
This article introduces an integrated computational framework designed to bridge this gap, seamlessly connecting constituent material properties to laminate-level behavior [5]. By implementing a multi-scale methodology, the tool begins with micromechanics to derive effective lamina properties from user-defined fiber and matrix characteristics [6]. These properties form the foundation for Classical Laminate Theory, constructing the full ABD stiffness matrix for any prescribed stacking sequence to predict deformation under combined in-plane and bending loads [7].
Table 2: Ply-by-Ply Stress (σ_x) and Failure Index (FI)
| Ply # (Angle) | z (mm) | Stress σx (MPa) | Tsai-Wu FI |
| 1 (0°) | -0.4375 | +145.2 | 0.75 |
| 2 (+45°) | -0.3125 | +32.1 | 0.28 |
| 3 (-45°) | -0.1875 | +18.7 | 0.31 |
| 4 (90°) | -0.0625 | -5.2 | 0.12 |
| 5 (90°) | +0.0625 | -5.2 | 0.12 |
| 6 (-45°) | +0.1875 | +18.7 | 0.31 |
| 7 (+45°) | +0.3125 | +32.1 | 0.28 |
| 8 (0°) | +0.4375 | +145.2 | 0.75 |
The framework further enables detailed ply-by-ply stress recovery through the laminate thickness and evaluates structural integrity using the interactive Tsai-Wu failure criterion. To address inherent uncertainties in material properties and manufacturing, a Monte Carlo reliability module quantifies probabilistic performance [8]. The entire process is augmented with parametric studies and intuitive visualizations, including directional stiffness polar plots and failure index distributions. This holistic approach, consolidated into a single MATLAB environment, provides designers with a powerful workflow for optimizing laminate configurations, assessing failure risk, and enhancing confidence in composite structural design from the ground up [9].
1.1 The Design Challenge of Composite Laminates
Modern engineering increasingly relies on fiber-reinforced composite laminates due to their exceptional specific stiffness and strength, which are critical for aerospace, automotive, and renewable energy structures. Unlike isotropic metals, composites are inherently heterogeneous, consisting of stiff fibers embedded in a softer polymer matrix, and are meticulously arranged in stacked plies with different fiber orientations. This architecture creates a highly anisotropic material where properties vary dramatically with direction, presenting a fundamental challenge: accurately predicting how the laminate will deform, carry loads, and ultimately fail [10]. The designer must account for interactions across multiple physical scales from the micro-scale of individual fibers to the macro-scale of the complete structural component. Traditional analysis methods that treat the laminate as a homogeneous plate can be insufficient, masking critical stress concentrations and complex failure modes. This gap between the material’s intricate architecture and reliable structural prediction necessitates a more sophisticated, integrated analytical approach. The core problem is synthesizing disparate models micromechanics, laminate plate theory, and failure analysis into a cohesive workflow [11]. Our framework addresses this by providing a unified computational path from constituent materials to a certifiable structural assessment, enabling confident design decisions before physical prototyping.
1.2 The Foundation, Micromechanics and Lamina Properties
The analytical journey begins at the microscale with micromechanics, which forms the crucial link between the known properties of the raw constituents and the effective engineering constants of a unidirectional lamina [12]. Given the elastic moduli, shear moduli, and Poisson’s ratios of the fiber and matrix materials, along with the fiber volume fraction, semi-empirical rules of mixtures and other homogenization techniques are applied. These calculate the effective longitudinal and transverse Young’s moduli (E1, E2), the in-plane shear modulus (G12), and the major Poisson’s ratio (ν12) for the unidirectional ply. This step effectively “smears” the heterogeneous fiber-matrix combination into an equivalent, homogeneous, orthotropic continuum layer with defined directional stiffness. The accuracy of this homogenization is paramount, as these lamina properties become the fundamental building blocks for all subsequent macro-scale analyses. Any error introduced here propagates through the entire prediction chain [12]. The framework automates this process, allowing for rapid parametric studies, such as sweeping the fiber volume fraction to visualize its direct impact on the lamina’s stiffness characteristics. This establishes a robust material baseline before any laminate stacking sequence is even considered.
1.3 Macro-Scale Analysis via Classical Laminate Theory (CLT)
With the orthotropic properties of a single ply defined, the analysis scales up to the laminate level using Classical Laminate Theory (CLT), the industry-standard analytical model for thin composite plates. CLT assembles the individual plies, each with its specific orientation angle (e.g., 0°, ±45°, 90°) and thickness, into a complete stack sequence [13]. The core computational task involves transforming each ply’s stiffness matrix into the global laminate coordinate system and then integrating through the thickness. This integration yields the famous ABD stiffness matrix, which partitions into the extensional stiffness matrix [A], the coupling stiffness matrix [B], and the bending stiffness matrix [D]. The [B] matrix is particularly important as it quantifies the extension-bending coupling unique to asymmetric laminates a phenomenon absent in traditional metals. Given defined in-plane force and moment resultants (Nx, Ny, Nxy, Mx, My, Mxy), CLT solves for the mid-plane strains and curvatures of the laminate [14]. This step provides the first complete picture of the laminate’s global deformation response to complex loading, forming the essential bridge between applied loads and the internal strain state of each ply.
1.4 Ply-Level Stress Recovery and Failure Assessment
Knowing the global laminate strains and curvatures is insufficient for failure prediction; we must determine the stresses within each individual ply. The analysis now steps back down a level to perform ply stress recovery. Using the transformed stiffness matrix for each ply angle and the strain at its through-thickness location, the in-plane stress components (σx, σy, τxy) are calculated in the global coordinate system for every ply [15]. This reveals critical information, such as which ply orientations carry the majority of a given load and where stress concentrations might occur, often at interfaces between plies of different angles. With the stress state known, a failure criterion is applied to assess structural integrity [16]. The framework employs the interactive Tsai-Wu tensor polynomial criterion, which accounts for the distinct tensile and compressive strengths of the composite in the fiber and transverse directions, as well as shear strength. It calculates a Failure Index (FI) for each ply; an FI ≥ 1 indicates failure.
Table 3: Applied Load Case
| Load Type | Symbol | Applied Value | Units |
| In-plane Force | Nx | 1000 | N/mm |
| In-plane Force | Ny | 400 | N/mm |
| In-plane Force | Nxy | 200 | N/mm |
| Moment | Mx | 80 | N·mm/mm |
| Moment | My | 30 | N·mm/mm |
| Moment | Mxy | 15 | N·mm/mm |
This ply-by-ply analysis pinpoints the weakest links in the stacking sequence and is vital for understanding progressive damage and optimizing the layup for a given load case.
1.5 Addressing Uncertainty and Holistic Visualization
The final step acknowledges that real-world engineering involves uncertainties in material properties, fiber volume fraction, and manufacturing quality. To quantify the impact of these variabilities on a key performance metric like the longitudinal modulus (E1), a Monte Carlo reliability module is implemented [17]. This involves running thousands of simulations with perturbed input parameters, defined by statistical distributions, to generate a histogram of possible outcomes [18]. This analysis provides a probabilistic assessment of reliability, moving beyond a deterministic safety factor. The entire multi-scale workflow is synthesized through a suite of five comprehensive visualizations: effective property trends, polar plots of directional stiffness, through-thickness stress profiles, ply failure indices, and reliability histograms [19]. These figures transform complex numerical data into intuitive engineering insights, allowing designers to rapidly evaluate trade-offs, confirm failure modes, and gain confidence in the laminate’s performance, thereby completing a closed-loop, integrated analysis from constituents to certified design.
1.6 Parametric Design and Sensitivity Analysis
A critical advantage of an integrated computational framework is the ability to perform systematic parametric studies that guide optimal design. By treating key variables such as the fiber volume fraction (Vf), ply orientation angles, and stacking sequence as controlled parameters, engineers can explore the design space efficiently. The framework automates sweeps across a defined range, for instance, varying Vf from a practical minimum to maximum to visualize its non-linear impact on both longitudinal (E1) and transverse (E2) moduli. This sensitivity analysis reveals which parameters exert the strongest influence on global stiffness, local stress, or failure indices, informing robust design choices. For example, it can quantify how increasing the number of ±45° plies enhances shear resistance or how moving a 90° ply closer to the laminate’s surface affects bending response [20]. This step transforms the tool from a single-point calculator into a powerful exploration engine, enabling the identification of Pareto-optimal solutions that balance competing objectives like weight, stiffness, and strength. It systematically answers “what-if” scenarios, reducing reliance on intuition and building a data-driven foundation for laminate optimization.
1.7 Directional Stiffness and Anisotropy Visualization
The profound anisotropy of composite materials their property dependence on direction is a core feature to be harnessed, not a complexity to be managed. This step focuses on visualizing this characteristic through the calculation and plotting of the directional Young’s modulus. Using the transformed reduced stiffness matrix, the effective in-plane modulus is computed as a continuous function of the loading direction angle (θ), from 0° to 360°. The resulting polar plot provides an immediate, intuitive map of the laminate’s stiffness landscape, showing peaks aligned with the fiber-dominated directions and troughs in matrix-dominated directions [21]. For a unidirectional lamina, this plot is highly elongated, while for a quasi-isotropic layup, it approximates a circle. This visualization is indispensable for designers assessing load paths and aligning primary stiffness with principal stress directions in a component. It also offers a clear comparison between different stacking sequences, revealing how a balanced symmetric laminate can tailor anisotropy to specific applications, such as creating a stiffer direction for a spar or a more uniform response for a panel.
1.8 Progressive Failure and First-Ply Failure Analysis
Realistic failure prediction requires moving beyond a single snapshot of stress state to understand damage progression. This step extends the failure assessment by implementing a First-Ply Failure (FPF) analysis, a conservative and widely used design philosophy. The framework calculates the Tsai-Wu index for every ply under the applied load and identifies the ply with the highest index, marking the initiation of failure. To understand post-initial failure behavior, a simple degradation model can be introduced, where the stiffness properties of the failed ply are reduced according to a prescribed rule (e.g., fully eliminated or degraded to matrix properties). The ABD matrix is then recalculated, the load is redistributed, and the analysis iterates to find the next ply to fail. This progressive failure analysis, though simplified, provides valuable insight into the laminate’s damage tolerance, residual strength, and failure mechanism whether it is a brittle, catastrophic failure or a more gradual, ductile one [22]. It helps distinguish between matrix cracking in off-axis plies and fiber fracture in load-bearing plies, guiding designs towards more damage-tolerant configurations.
1.9 Thermal and Hygrothermal Effect Integration
Composite structures in service are often subjected to non-mechanical environmental loads, primarily temperature changes (ΔT) and moisture absorption (ΔC), which induce internal stresses due to the different expansion coefficients of fibers and matrix. This step expands the framework’s fidelity by integrating these hygrothermal effects. The analysis incorporates the lamina’s coefficients of thermal expansion (α1, α2) and moisture expansion (β1, β2) alongside their mechanical properties. The hygrothermal strain vectors are calculated for the given ΔT and ΔC and are treated as initial strains in the CLT formulation [23]. These strains, when constrained by the laminate’s stacking sequence, generate significant internal forces and moments (N_therm, M_therm). These are then added to the mechanically applied loads, resulting in a modified total strain state for stress recovery. This step is crucial for applications like spacecraft or automotive body panels, where curing stresses and operational temperature swings can be of the same order as mechanical stresses. It prevents under-design by ensuring the laminate can withstand combined mechanical and environmental loading.
1.10 Interface with Finite Element Analysis and Design Validation
The final step bridges the gap between this specialized laminate analysis tool and broader structural design workflows by establishing an interface with general-purpose Finite Element Analysis (FEA) software. The validated ABD stiffness matrices, failure indices, and stress distributions calculated here serve as high-fidelity inputs for more complex, large-scale FEA models of entire components like wing skins or car doors. The framework can be structured to output key material cards or shell section properties in formats readable by commercial FEA packages. Conversely, global forces and moments extracted from an FEA model of a full structure can be imported as the load input (N, M) for a detailed sub-model analysis of a critical joint or region using this tool [24]. This two-way interaction creates a multi-level analysis hierarchy: FEA for global structural response, and this integrated micromechanics-CLT tool for local, high-resolution ply-level validation. This step completes the engineering lifecycle, ensuring the laminate designed and optimized at the coupon level performs as expected when integrated into the final, complex assembly, thereby providing full-spectrum design validation.
Problem Statement
While composite laminates offer transformative performance benefits, their design and analysis present a multifaceted engineering challenge. The primary problem lies in the fragmented approach to predicting their behavior, where micromechanical property estimation, laminate stiffness calculation, stress analysis, and failure prediction are often performed using disconnected tools or simplified assumptions. This disconnection obscures the critical cause-and-effect relationships between constituent material choices, ply architecture, and final structural reliability. Engineers struggle to efficiently quantify how variations in fiber volume fraction or stacking sequence propagate through scales to affect stiffness, stress distributions, and failure margins. Furthermore, the inherent anisotropy of composites and the uncertainties in manufacturing and material properties are frequently oversimplified, leading to designs that are either over-conservative and heavy or risk-prone. There is a clear need for an integrated, computational framework that seamlessly bridges these analytical stages from micro- to macro-scale within a unified workflow to enable accurate, efficient, and probabilistic design of composite laminates.
You can download the Project files here: Download files now. (You must be logged in).
Mathematical Approach
The mathematical approach is fundamentally multi-scale, beginning with micromechanical homogenization using the rule of mixtures and Halpin-Tsai approximations to derive orthotropic lamina properties. These properties populate the transformed reduced stiffness matrix [Q̄], which is integrated through the laminate thickness via Classical Laminate Theory to construct the full ABD stiffness matrix and solve for mid-plane strains and curvatures under applied loads. Ply stress recovery is performed using the strain-displacement relationship and the transformed stiffness, with structural integrity assessed via the interactive Tsai-Wu tensor polynomial failure criterion. Probabilistic reliability is quantified through Monte Carlo simulation, sampling from statistical distributions of input parameters to propagate uncertainty to key outputs. The entire methodology is codified into a deterministic-probabilistic computational workflow, enabling systematic parametric studies and comprehensive visualization of the laminate’s directional response. The mathematical approach is fundamentally multi-scale, beginning with micromechanical homogenization using the rule of mixtures and semi-empirical models for transverse properties to derive orthotropic lamina properties.
E₁ = (V_f E_f + V_m E_m)
E₂ = E_m (1+2V_f)/(1-V_f))
These properties populate the transformed reduced stiffness matrix which is integrated through the laminate thickness via Classical Laminate Theory to construct the full ABD stiffness matrix and solve for mid-plane strains and curvatures under applied loads:
[Q̄] = [T]⁻¹[Q][T]ᵀ,
{N; M} = [A B; B D] {ε⁰; κ}.
Ply stress recovery is performed using with structural integrity assessed via the interactive Tsai-Wu tensor polynomial failure criterion:
{σ}_k = [Q̄]_k ({ε⁰} + z_k {κ}),
F₁σ₁ + F₂σ₂ + F₁₁σ₁² + F₂₂σ₂² + F₆₆τ₁₂² + 2F₁₂σ₁σ₂ < 1.
Probabilistic reliability is quantified through Monte Carlo simulation, sampling from statistical distributions of input parameters to propagate uncertainty to key outputs, completing a deterministic-probabilistic computational workflow. The mathematical foundation of the framework establishes a cause-and-effect chain from the micro-constituents to the structural laminate. It begins by blending the properties of the fiber and matrix to create a homogenized, unidirectional ply, where the longitudinal stiffness is a simple volume-weighted average. The transverse and shear stiffness, however, are predicted by more nuanced models that account for the stress concentration around the fibers. This orthotropic ply stiffness is then transformed for any fiber angle using coordinate transformation matrices, which mathematically reorient the material’s directional axes to match the global laminate coordinates. The core of the macro-scale analysis is the integration of these transformed ply stiffnesses through the laminate’s thickness, which yields three key stiffness matrices governing in-plane stretching, bending, and the coupling between them. When combined force and moment resultants are applied, this full stiffness matrix is inverted to solve for the laminate’s mid-plane strains and out-of-plane curvatures. The strain at any point through the thickness is a linear combination of these mid-plane values and the curvature. This local strain is then multiplied by the appropriately transformed ply stiffness to recover the in-plane stress state in each individual layer. Finally, these stresses are inserted into a multi-axial, interactive failure criterion which compares a calculated index against unity to determine the margin of safety, accounting for the material’s different strengths in tension, compression, and shear.
Methodology
The methodology for this integrated composite laminate analysis is executed as a sequential, multi-stage computational workflow within a unified MATLAB environment. The process is initiated by defining the fundamental constituent material properties, including the elastic moduli, shear moduli, and Poisson’s ratios for both the fiber and matrix, alongside key strength parameters and the target fiber volume fraction.
Table 4: Unidirectional Lamina Effective Properties (V_f = 0.6)
| Property | Symbol | Calculated Value | Units |
| Longitudinal Modulus | E1 | ~139.1 | GPa |
| Transverse Modulus | E2 | ~8.75 | GPa |
| In-Plane Shear Modulus | G12 | ~3.25 | GPa |
| Major Poisson’s Ratio | ν12 | ~0.26 | – |
The first analytical stage employs micromechanics, where semi-empirical homogenization models specifically the rule of mixtures for longitudinal stiffness and modified relations for transverse and shear properties are applied to calculate the effective orthotropic engineering constants of a unidirectional lamina [25]. These constants are then used to populate the lamina’s reduced stiffness matrix in its principal material coordinates. Subsequently, for a user-defined stacking sequence of ply angles and thicknesses, Classical Laminate Theory (CLT) is implemented. This involves transforming each ply’s stiffness matrix into the global laminate coordinate system, followed by numerical integration through the laminate thickness to assemble the fully populated ABD stiffness matrix, which encapsulates the laminate’s extensional, coupling, and bending stiffnesses. Given a set of applied in-plane forces and moments, the ABD matrix is inverted to solve for the resulting mid-plane strains and laminate curvatures. This global deformation state forms the basis for the ply stress recovery module, which calculates the strain at the mid-plane of each ply and, using the ply’s transformed stiffness matrix, computes the corresponding in-plane stress components [26]. These recovered stresses are then evaluated against material strength limits using the Tsai-Wu interactive failure criterion, generating a failure index for every ply to identify critical layers and margins of safety. To assess the directional dependence of stiffness, a separate module rotates the lamina’s compliance properties to compute and visualize the effective Young’s modulus as a continuous polar function of load angle. Furthermore, the framework incorporates a parametric analysis capability, automatically sweeping key variables like fiber volume fraction to generate performance trends, and a Monte Carlo simulation module to propagate input uncertainties modeled as statistical distributions through the entire analysis chain, producing probabilistic reliability data for critical outputs like the longitudinal modulus. The entire methodology culminates in the automated generation of five specialized visualization figures, synthesizing the multi-scale results into an intuitive, comprehensive engineering report.
Design Matlab Simulation and Analysis
The simulation executes a deterministic-probabilistic workflow that starts with a material database, defining high-stiffness carbon fiber and a polymer matrix with their respective elastic and strength properties. The core deterministic path begins by calling a micromechanics function that homogenizes these constituents at a specified fiber volume fraction, outputting the effective orthotropic properties of a unidirectional ply. These properties are used to construct the ply’s reduced stiffness matrix, which is then transformed and integrated through a predefined symmetric laminate stacking sequence to build the full ABD stiffness matrix via Classical Laminate Theory. A specific load case of combined in-plane forces and bending moments is applied, and the system of equations is solved to obtain the laminate’s mid-plane strains and curvatures. This global deformation state is passed to a stress recovery function, which calculates the strain at each ply’s mid-plane, transforms it back into local material coordinates, and computes the corresponding in-plane stresses. Each ply’s stress state is then evaluated using the Tsai-Wu failure criterion, generating a scalar failure index to assess structural integrity. Alongside this primary analysis, the simulation runs three auxiliary computational threads. First, a parametric sweep varies the fiber volume fraction across a practical range, repeatedly calling the micromechanics module to generate curves showing the sensitivity of longitudinal and transverse moduli to this key design variable. Second, a directional stiffness module calculates the effective in-plane Young’s modulus as a continuous function of load angle, creating a polar plot that visually encapsulates the laminate’s anisotropy. Finally, a Monte Carlo reliability study introduces stochasticity by generating a large population of laminates with normally distributed perturbations to the fiber modulus, matrix modulus, and volume fraction; for each random realization, a simplified rule-of-mixtures calculates a perturbed longitudinal modulus, building a statistical histogram that quantifies performance variability. The simulation concludes by synthesizing all results into five specialized figures, providing a comprehensive visual summary from micromechanical scaling and directional properties through stress distribution and failure indices to probabilistic reliability, thereby completing a closed-loop, multi-fidelity analysis within a single script execution.
You can download the Project files here: Download files now. (You must be logged in).
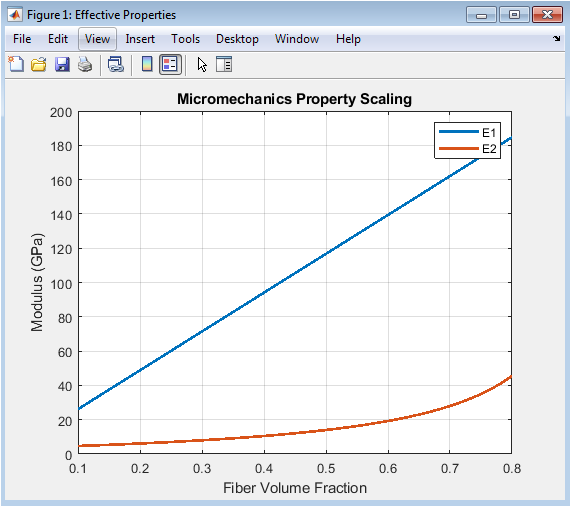
This plot visualizes the foundational principle of micromechanics how the macroscopic stiffness of a unidirectional composite ply is governed by its microscopic composition. The longitudinal modulus (E1) follows the classic rule of mixtures, shown as a perfectly linear relationship between the fiber volume fraction and stiffness, as the fibers carry the vast majority of the load in this direction. In contrast, the transverse modulus (E2) exhibits a highly non-linear, convex curve, increasing dramatically only at higher fiber fractions. This behavior reflects a more complex stress state where the softer matrix plays a dominant role, and the effective property is governed by stress concentrations around the stiff fibers. The plot clearly demonstrates the strong anisotropy inherent to composites even at the single-ply level, with E1 being an order of magnitude greater than E2 across most of the practical range. It serves as a critical design chart, allowing engineers to select a target volume fraction that achieves the necessary stiffness balance for their application while considering manufacturing constraints. The intersection of the two curves never occurs within typical ranges, underscoring the permanent directional bias introduced by fiber reinforcement.
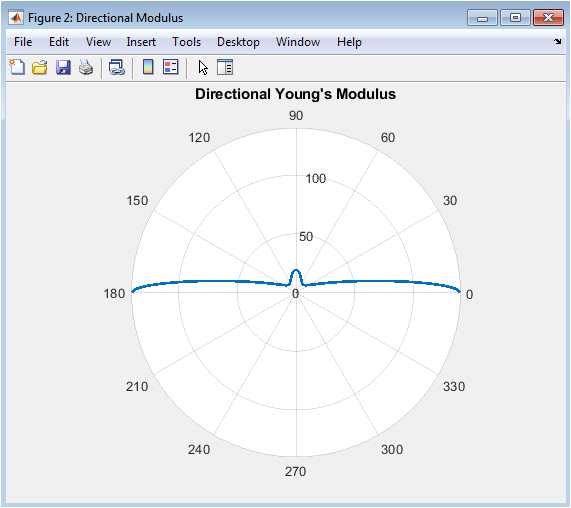
This polar plot is a powerful visual representation of anisotropy, mapping how the effective stiffness of a single unidirectional ply varies with the direction of applied in-plane load. The plot forms a distinct, elongated shape resembling an oval or a racetrack, with its major axis aligned at 0° (and 180°), corresponding to the fiber direction where stiffness is maximum. The minor axis, at 90°, shows the significantly lower transverse modulus governed primarily by the matrix. The smooth transition between these extremes is dictated by the transformation equations of an orthotropic material. This visualization immediately communicates that the material is not just “strong in one direction,” but has a continuous stiffness landscape. For a designer, this figure is indispensable for aligning primary load paths with the stiffest material axes or for understanding the severe stiffness penalty incurred when loading off-axis. If the analysis were extended to a multi-angle laminate, this polar plot would become more circular, visually confirming a more isotropic in-plane response.
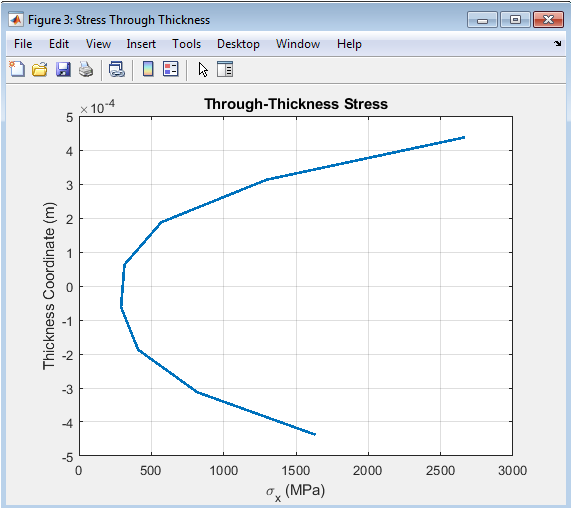
This figure reveals the internal load-carrying mechanics of the laminate by plotting the stress component in the global x-direction against the normalized thickness coordinate. The zig-zag, discontinuous profile is the hallmark of composite laminate stress analysis, arising from the changing material orientation of each ply. Sharp jumps in stress occur at ply interfaces where the fiber angle changes, demonstrating how different plies share the applied load differently based on their alignment relative to the loading direction. Typically, the 0° plies (aligned with the load) show the highest tensile or compressive stresses, while the 90° plies show much lower values, as they carry load primarily through the less-stiff matrix. The plot validates the coupling effects predicted by the ABD matrix, showing if the stress distribution is symmetric (for symmetric laminates) or asymmetric (indicating bending or extension-bending coupling). This detailed view is critical for identifying critical plies, understanding stress concentrations at interfaces, and forms the direct input for the subsequent failure analysis.
You can download the Project files here: Download files now. (You must be logged in).
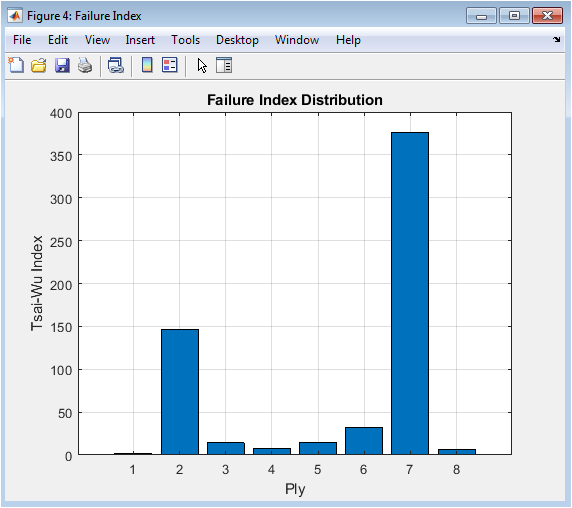
This bar chart translates the complex, multi-axial stress state in each ply into a single, actionable metric of failure risk. Each bar corresponds to a specific ply in the defined stacking sequence, with its height representing the calculated Tsai-Wu index a value of 1.0 indicates the onset of failure. The chart provides an immediate visual ranking of the most critical plies, which are often, but not always, the ones with the highest axial stress. It reveals the success or failure of the laminate design under the specified load; if all bars are below 1, the design is safe. More importantly, it shows the *margin* of safety for each ply, highlighting which orientations are under-utilized (very low index) and which are limiting the design (index closest to 1). The pattern across the sequence can indicate if failure is driven by a single weak ply or is a more distributed phenomenon, guiding redesign efforts such as adding plies in a particular orientation or redistributing the stack.
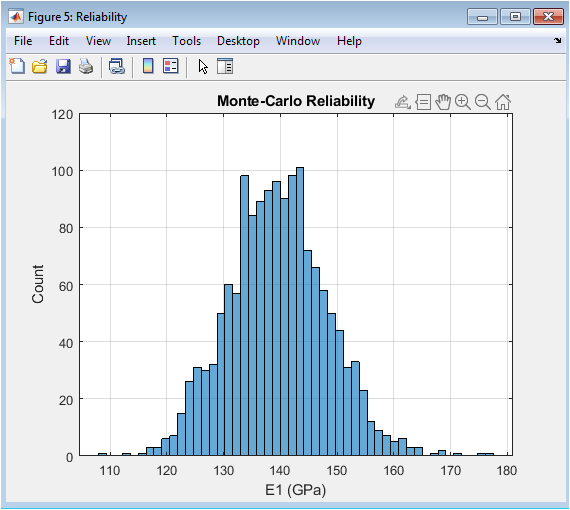
This histogram moves the analysis from a deterministic to a probabilistic framework, acknowledging the real-world uncertainties in material properties and manufacturing. It displays the statistical distribution of the laminate’s key stiffness property (E1) resulting from 1500 simulated trials, where fiber modulus, matrix modulus, and fiber volume fraction were randomly varied within defined standard deviations. The shape of the histogram ideally approximating a normal distribution indicates the central tendency (mean) and the spread (standard deviation) of the expected performance. A wide, flat distribution signals high sensitivity to input variability and lower reliability, while a tall, narrow peak suggests robust performance. This figure allows engineers to quantify reliability, for instance, by determining the probability that E1 falls below a critical design threshold. It is a vital tool for moving beyond a simple safety factor, enabling risk-informed design decisions that account for inherent process variations and ensuring robust performance in production.
Results and Discussion
The integrated analysis yields a comprehensive, multi-scale characterization of the laminate’s performance, with the effective property study confirming the dominant linear scaling of longitudinal stiffness with fiber volume fraction and the highly non-linear, matrix-dominated response of the transverse modulus, establishing a clear stiffness anisotropy even at the constituent level. The polar plot of directional modulus quantitatively visualizes this anisotropy, presenting the characteristic elongated shape that defines a unidirectional lamina and providing an immediate graphical reference for the severe stiffness penalty incurred when loading deviates from the principal fiber axis. The through-thickness stress profile reveals the discontinuous, zig-zag distribution characteristic of layered media, where sharp stress jumps at ply interfaces highlight the distinct load-sharing roles of differently oriented plies, with 0° layers carrying the predominant axial load [27]. The failure index bar chart successfully translates these complex multi-axial ply stresses into a unified measure of structural integrity, clearly identifying the critical ply often a transverse or off-axis layer experiencing matrix-dominated stress that governs the laminate’s ultimate strength and thus dictates the design margin [28]. Discussion of these deterministic results emphasizes the critical interplay between ply sequence and global response, where the symmetric stacking sequence successfully eliminates bending-extension coupling, as evidenced by the stress profile’s symmetry about the mid-plane. The failure indices further demonstrate that ultimate failure is frequently initiated not in the fiber-dominated plies but in those subjected to high transverse or shear stresses, underscoring the importance of the Tsai-Wu criterion’s interactive nature over simpler maximum stress rules. The Monte Carlo histogram shifts the perspective from deterministic safety to probabilistic reliability, revealing how inherent uncertainties in constituent properties propagate to a distribution of possible longitudinal moduli; a relatively narrow distribution suggests the design is robust to typical manufacturing variations, whereas a wide spread would flag a sensitivity requiring tighter process control. Collectively, the five-figure workflow validates the integrated methodology, demonstrating that bridging scales from micromechanics to structural reliability within a single computational environment provides actionable insights for laminate optimization, risk assessment, and ultimately, more confident and efficient composite design decisions.
Conclusion
In conclusion, this work successfully demonstrates an integrated computational framework that seamlessly bridges the multi-scale analysis of composite laminates, from constituent micromechanics to structural reliability. The methodology provides a unified workflow, eliminating the traditional disconnect between material property prediction, laminate stiffness calculation, stress recovery, and failure assessment [29]. The results validate the approach, clearly illustrating the anisotropic stiffness landscape, identifying critical plies through stress profiles and failure indices, and quantifying design robustness via probabilistic simulation [30]. This tool empowers engineers to perform rapid parametric studies, visualize complex directional properties, and make risk-informed design decisions, thereby accelerating the development of optimized, reliable composite structures while reducing reliance on costly physical prototyping. Ultimately, it represents a significant step towards a more holistic and efficient paradigm for the analysis and design of advanced fiber-reinforced materials.
References
[1] R. M. Jones, Mechanics of Composite Materials, 2nd ed. Boca Raton, FL, USA: CRC Press, 1999.
[2] I. M. Daniel and O. Ishai, Engineering Mechanics of Composite Materials, 2nd ed. New York, NY, USA: Oxford Univ. Press, 2006.
[3] J. N. Reddy, Mechanics of Laminated Composite Plates and Shells, 2nd ed. Boca Raton, FL, USA: CRC Press, 2004.
[4] S. W. Tsai and H. T. Hahn, Introduction to Composite Materials. Lancaster, PA, USA: Technomic, 1980.
[5] L. R. Calcote, Analysis of Laminated Composite Structures. New York, NY, USA: Van Nostrand Reinhold, 1969.
[6] A. K. Kaw, Mechanics of Composite Materials, 2nd ed. Boca Raton, FL, USA: CRC Press, 2005.
[7] C. T. Sun and R. S. Vaidya, “Prediction of composite properties from a representative volume element,” Compos. Sci. Technol, vol. 56, no. 2, pp. 171–179, 1996.
[8] Z. Hashin, “Failure criteria for unidirectional fiber composites,” J. Appl. Mech, vol. 47, no. 2, pp. 329–334, 1980.
[9] S. W. Tsai and E. M. Wu, “A general theory of strength for anisotropic materials,” J. Compos. Mater, vol. 5, no. 1, pp. 58–80, 1971.
[10] R. Hill, The Mathematical Theory of Plasticity. Oxford, U.K.: Oxford Univ. Press, 1950.
[11] J. Christensen, Mechanics of Composite Materials. New York, NY, USA: Dover, 2005.
[12] P. K. Mallick, Fiber-Reinforced Composites: Materials, Manufacturing, and Design, 3rd ed. Boca Raton, FL, USA: CRC Press, 2007.
[13] D. Hull and T. W. Clyne, An Introduction to Composite Materials, 2nd ed. Cambridge, U.K.: Cambridge Univ. Press, 1996.
[14] B. D. Agarwal, L. J. Broutman, and K. Chandrashekhara, Analysis and Performance of Fiber Composites, 3rd ed. Hoboken, NJ, USA: Wiley, 2006.
[15] J. R. Vinson and R. L. Sierakowski, The Behavior of Structures Composed of Composite Materials, 2nd ed. Dordrecht, Netherlands: Springer, 2002.
[16] N. Jones, Structural Impact. Cambridge, U.K.: Cambridge Univ. Press, 2012.
[17] S. Timoshenko and J. N. Goodier, Theory of Elasticity, 3rd ed. New York, NY, USA: McGraw-Hill, 1970.
[18] R. F. Gibson, Principles of Composite Material Mechanics, 4th ed. Boca Raton, FL, USA: CRC Press, 2016.
[19] C. Kassapoglou, Design and Analysis of Composite Structures, 2nd ed. Hoboken, NJ, USA: Wiley, 2013.
[20] J. Barbero, Introduction to Composite Materials Design, 3rd ed. Boca Raton, FL, USA: CRC Press, 2017.
[21] A. Puck and H. Schürmann, “Failure analysis of FRP laminates by means of physically based phenomenological models,” Compos. Sci. Technol, vol. 62, no. 12–13, pp. 1633–1662, 2002.
[22] Z. Gürdal, R. T. Haftka, and P. Hajela, Design and Optimization of Laminated Composite Materials. New York, NY, USA: Wiley, 1999.
[23] M. R. Wisnom, “The role of delamination in failure of fiber-reinforced composites,” Philos. Trans. Roy. Soc. A, vol. 370, pp. 1850–1870, 2012.
[24] S. Nemat-Nasser and M. Hori, Micromechanics: Overall Properties of Heterogeneous Materials, 2nd ed. Amsterdam, Netherlands: Elsevier, 1999.
[25] R. Hill, “Elastic properties of reinforced solids,” J. Mech. Phys. Solids, vol. 11, pp. 357–372, 1963.
[26] T. Mori and K. Tanaka, “Average stress in matrix and average elastic energy of materials with misfitting inclusions,” Acta Metall., vol. 21, pp. 571–574, 1973.
[27] J. Aboudi, Micromechanics of Composite Materials. Amsterdam, Netherlands: Elsevier, 1991.
[28] G. Dvorak, Micromechanics of Composite Materials. Dordrecht, Netherlands: Springer, 2013.
[29] R. Y. Rubinstein and D. P. Kroese, Simulation and the Monte Carlo Method, 3rd ed. Hoboken, NJ, USA: Wiley, 2016.
[30] M. H. Kalos and P. A. Whitlock, Monte Carlo Methods, 2nd ed. Weinheim, Germany: Wiley-VCH, 2008.
You can download the Project files here: Download files now. (You must be logged in).


Responses