Standstill Frequency Response Test for Obtaining Parameters of Six Phase Double Delta Salient-Pole Synchronous Machine on Example of Claw-Pole Alternator

Abstract—
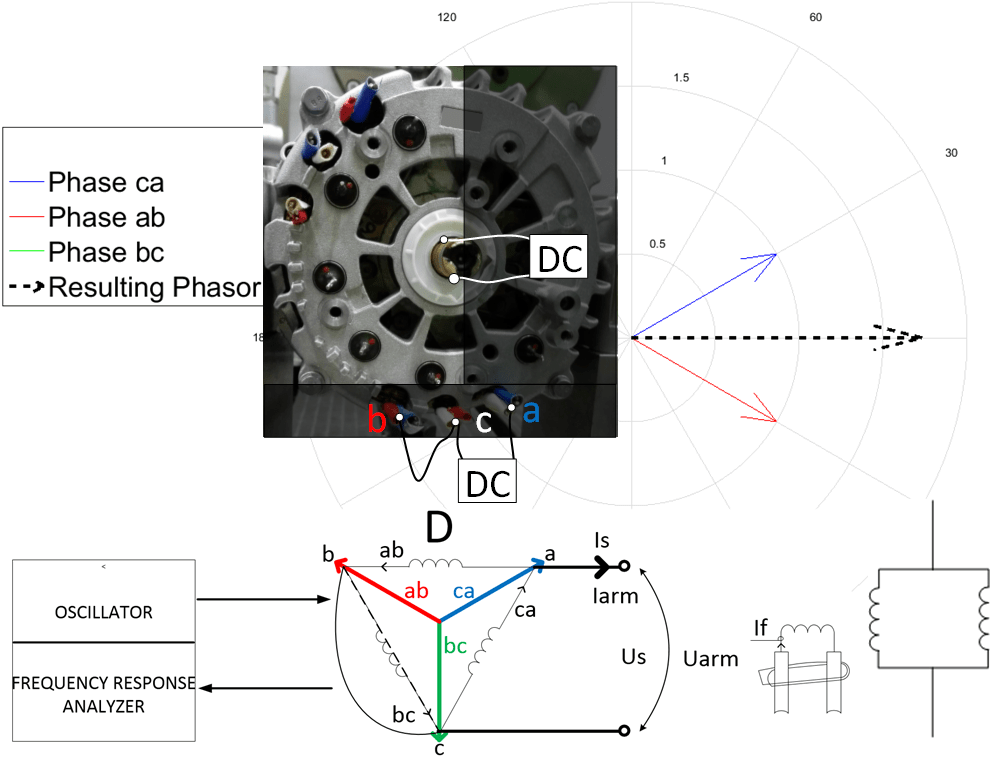
The current publication introduces an approach for obtaining parameters of a six phase double delta salient-pole synchronous machine, based on the standstill frequency response test. The described approach was verified by measurements on a automotive claw-pole alternator, done in a laboratory on a test bench.

Dr. Dimitri Weiss, Electrical Drives and Actuators, Munich, Germany

e-mail: info@wiredwhite.com

I. Introduction

Accurate machine data are very essential for the development of modern control algorithms [1], [2]. There are several approaches for obtaining parameters of electrical machines. Many of them are compared and described in the literature [1], [3], [4]. There are some publications considering specifically the standstill frequency response test (SSFRT) for obtaining the parameters of mainly star connected electrical machines [5]-[9]. The subsequently described approach is based on the SSFRT, which requires the mechanical alignment of the rotor with d-axis and q-axis positions. One of the most essential advantages of the chosen SSFR test for obtaining parameters of electrical machine is the fact that parameter identification of both axes may be carried out separately without interaction between the direct and quadrature axis [10]. For alignment the rotor with d-axis and q-axis the different from described in [5] approach was used. The reason for that is that even the smallest error in the mechanical alignment results in the significant error in the electrical degree by machines with a high number of pairs of poles [11]. The method described in [5] provides that a stator winding must be supplied with AC current and the induced rotor voltage must be measured with oscilloscope, while rotating the rotor. Once the value of the induced rotor voltage, while rotating the rotor, reaches zero, the d-axis position is achieved. Since the incorrect read off of the oscilloscope measured values, due to an observational error, and fluctuations of shaft and rotor may occur before fixation of rotor in a desired position, another method is proposed by authors. The suggested approach for the aforementioned alignment is verified analytically as well as based on the MATLAB model. The described approach in this publication specifies step by step application of the SSFR test for six phase double delta salient-pole synchronous machines on example of the claw-pole alternator.

II. SSFRT of Six Phase Salient-Pole Double Delta Machine

Standstill Frequency Response Test: d-axis orientation of resultant phasor of six phase salient-pole double delta machine
Fig. 1. d-axis orientation of resultant phasor of six phase salient-pole double delta machine

The final intention is to use results from this publication to build a decoupled model of the six phase double delta machine with two independent dq frames. For this reason each delta connection of the six phase double delta machine will be handled independently. To benefit from the SSFR test the resultant phasor aligned with d-axis and q-axis must be built with the sum of the voltage phasors. Fig. 1 shows the d-axis orientation of the resultant phasor.

Fig. 2 shows the q-axis orientation of the resultant phasor. For this purpose the phases of the salient-pole machine were supplied with DC, as showed in Fig. 3.

To verify the theory, the MATLAB models (showed in Fig. 4 and Fig. 5) have been developed, which confirm the accuracy of the polar plots that are introduced in Fig. 1 and Fig. 2. Following, the functioning principles based on example of one program cycle will be explained. When the program is started, the first selection screen appears where user is prompted for the desired winding topology (s. Fig. 6). The program provides possibility to observe phasor diagrams for a wye connection, as well as phasors in intermediate states when deriving phasors for a delta connection. When the fifth choice is selected (“case 5 only delta” in Fig. 6), then the user will be asked for which magnetic axis d or q the alignment should be performed. Hereby, the selection will be produced based on the second selection mask for alignment (s. Fig. 7). After the entire selection process is finished, the Simulink/MATLAB model, which simulates and then plots the magnetic axes orientation, will be utilized.

Standstill Frequency Response Test: Fig. 2. q-axis orientation of resultant phasor of six phase salient-pole double delta machine

Fig. 2. q-axis orientation of resultant phasor of six phase salient-pole double delta machine

Standstill Frequency Response Test: Fig. 3. For d-axis (left) and q-axis (right) orientations necessary connections of stator and rotor windings

Fig. 3. For d-axis (left) and q-axis (right) orientations necessary connections of stator and rotor windings

Fig. 4. Model for d-axis orientation of resultant phasor of six phase salient-pole double delta machine

Fig. 5. Model for q-axis orientation of resultant phasor of six phase salient-pole double delta machine

Fig. 6. Selection mask for winding

Fig. 7. Selection mask for alignment

A. Alignment of Rotor

The suggested method for alignment of two magnetic axes is based on the application of DC voltage to both windings (stator and rotor) at the same time. Herewith, the unnecessary “read off” errors, based on observational error, can be eliminated. With other words the rotor reaches the desired alignment position by itself due to the produced magnetic forces, independently from observed by test engineer information from oscilloscope. Whereas, the necessary current values should be applied in order to achieve the rotor rotation due to the alignment of the magnetic axes.

B. SSFRT Calculations

After the rotor was located in the d-position, it should be mechanically fixed for both measurement series of complex impedances and . Subsequently the d- and q-tests have to be performed by oscillating stator windings as showed in Fig. 8 for the d-test and in Fig. 9 for the q-test respectively. It is worth to mention, that there is an alternative way for performing the measurements by positioning the rotor in q-axis, fixing it and performing the measurements for d- and q-axis, whereby in this case d-axis becomes q-axis and v.v. This alternative method is very similar to the main one and will be considered closely in the separate section. All calculations that will be presented in the following section are theoretical and presented in qualitative form. The equations are considered based on four data points, which are not the complete measurement results that will be introduced in the succeeding section in this publication. The main objective of this section is to explain the applied SSFRT method step by step and to understand the basics of the calculations. By means of the measurement results, the and are calculated using (1) and (2). Fig. 10 shows the Bode magnitude plot and Bode phase plot for and correspondingly. The direct and quadrature axis impedances are calculated by multiplying and by 2 and 3/2 accordingly (s. (1) and (2)). The multiplication factors 2 and 3/2 are due to the parallel (in case of d-axis measurements) and series-parallel (in case of q-axis measurements) connections of the stator windings. From Fig. 11 can be observed that one stator phase (named “bc”) is remaining short-circuited throughout the entire d-axis test and the remaining two stator phases of delta connection are being excited in parallel. In the case of q-axis tests, two phase connections have been supplied with a DC source without short-circuiting any of stator phases. This results in a series-parallel connection of all three stator phases of the delta connection (s. Fig. 12).

Z a r m d ( s ) = Δ u a r m ( s ) Δ i a r m ( s ) Z d ( s ) = 2 Z a r m d ( s ) ( 1 ) L d ( s ) = z d ( s ) R a s R a = 2 lim s 0 ( Z a r m d ( s ) ) Z a r m d ( s )  – measured by d-axis test complex impedance u a r m ( s )  – voltage measured during SSFRT i a r m ( s )  – current measured during SSFRT Z d ( s )  – complex impedance of d-axis L d ( s )  – d-axis inductance R a  – armature resistance s  – complex frequency (Laplace operator)

Equations (1) and (2) show that for the calculations of and the value of is necessary that can be expressed as the function of d- and q-axis impedance as tends to zero.

Z a r m q ( s ) = Δ u a r m ( s ) Δ i a r m ( s ) Z q ( s ) = 3 2 Z a r m q ( s ) ( 2 ) L q ( s ) = Z q ( s ) R a s R a = 3 2 lim s 0 ( Z a r m q ( s ) )

To implement the function, curve fitting algorithms for the real part of impedance have been implemented. Such curve fitting algorithms as “polyfit”, “linear interp” and “power2” have been analyzed and tested using MATLAB scripts developed by the author. How each curve fitting algorithm or function operates is described in help documents of MATLAB [12]. The comparison of the algorithms has shown that the “power2” curve fitting algorithm provides the best results and it has been used in this publication. Fig. 13 demonstrates the satisfactory match between measured data points and the fitted curve. Subsequently using (1) and (2) the desired and were calculated (s. Fig. 14).

III. Test Bench Description and Measurements

Fig. 15 shows the test bench setup that has been used for measurement data acquisition and verification of the described approach and built based on the test bench described in [13]. Measurements should be performed with such devices as transfer function analyzer, frequency response analyzer, Fourier analyzer, digital signal analyzer or other functionally equivalent devices. Such measurement devices or analyzers measure magnitude and relative phase angle between two signals and extract only a fundamental component of a signal. For these purposes, such device as “Bode 100” by Omicron Lab has been used. Utilizing the device, all data have been obtained and stored in a separate Excel table. Besides the vector network analyzer (VNA) “Bode 100”, the test bench includes a converter that creates sinusoidal oscillations of

Fig. 8. Setup and connections for d-axis test

Fig. 8. Setup and connections for d-axis test

Fig. 9. Setup and connections for q-axis test

Fig. 9. Setup and connections for q-axis test

Fig. 10. Bode magnitude plot and Bode phase plot for (left) and (right)

Fig. 10. Bode magnitude plot and Bode phase plot for (left) and (right)

Fig. 11. Parallel connections of stator windings by SSFRT for d-axis

Fig. 11. Parallel connections of stator windings by SSFRT for d-axis

Fig. 12. Series-parallel connections of stator windings by SSFRT for q-axis

Fig. 12. Series-parallel connections of stator windings by SSFRT for q-axis

Fig. 13. Real part of (left) and (right), plotted based on data points (red line) and based on fitted curve (blue line)

Fig. 13. Real part of (left) and (right), plotted based on data points (red line) and based on fitted curve (blue line)

Fig. 14. Bode magnitude plot and Bode phase plot for (left) and (right)

Fig. 14. Bode magnitude plot and Bode phase plot for (left) and (right)

different frequencies and amplitudes, as well as current and voltage measurement devices. Frequency and phase shift between current and voltage have been measured with an oscilloscope and a precision power analyzer. The investigations have been carried out on an automotive typical claw-pole alternator that is built based on a multi-phase delta connected high speed salient-pole synchronous machine. During the measurements, the magnitudes and phase angles of the fundamental components of the AC signals have been obtained in the frequency range logarithmically spaced between 1 Hz and 4000 Hz. After the data were obtained, the post processing algorithms using MATLAB have been implemented. Fig. 16 shows the Bode magnitude plot and the Bode phase plot for measured and . Using (1) and (2), the and of the investigated in the laboratory claw-pole machine have been defined (s. Fig. 17).

Fig. 15. Test bench setup, used for measurement data acquisition

Fig. 15. Test bench setup, used for measurement data acquisition

Besides the inductances, other machine parameters, such as the armature to field transfer impedance and the mutual inductance between the field and armature windings, can be determined based on SSFRT. The advantage of SSFRT in determining the armature to field transfer impedance is the fact that this may be done the same throughout the d-axis tests with the open field winding. The armature to field transfer impedance is necessary if an accurate modeling of the field circuit is required [5]. To calculate the armature to field transfer impedance (3) is used.

Z a f 0 ( s ) = Δ e f d ( s ) Δ i d ( s ) = 3 ( Δ e f d ( s ) Δ i a r m ( s ) ) ( 3 )

From the armature to field transfer impedance, the armature to field turns ratio, and then the value of the field resistance, referred to the armature winding can be calculated, which are well described in [5] and are not considered in this section hereinafter. To calculate the the mutual inductance between the field and armature windings (4) is used.

L a f d = lim s 0 [ ( 1 s ) Z a f 0 ( s ) ] ( 4 )

Equation (3) reflects the ratio between the measured armature current and the d-current , required for the calculation of the , that is reproduced in (5).

Δ i a r m ( s ) = 3 Δ i d ( s ) ( 5 )
Fig. 16. Bode magnitude plot and Bode phase plot for measured (left) and (right)

Fig. 16. Bode magnitude plot and Bode phase plot for measured (left) and (right)

Fig. 17. Bode magnitude plot and Bode phase plot for measured (left) and (right)

Fig. 17. Bode magnitude plot and Bode phase plot for measured (left) and (right)

The calculation of the d-current for a wye connection was described in [6]. In [6] another factor between the d-current and the armature current , due to the differences in winding topology and in the positioning of the magnetic axes of the individual phases was used. How the factor has been derived in the present work, is explained in the following.
Fig. 18 shows the most significant highlights that should be taken into account during the alignment of the rotor with the d-axis and during the d-axis tests. In performing the d-axis tests the currents and are flowing through the armature winding, while the current is null (since the phase “bc” is shorted at the d-axis tests). The logical conjunction in (6) applies.

{ I c a I a b ( 6 ) I b c = 0

From (7) the ratio between the amplitude value of the armature current (also referred to as in Fig. 18 and called as “conductor current”) and the respective phase currents and that are flowing parallel at the d-axis test follows.

I a r m 2 = I c a = I a b ( 7 ) I a r m = 2 I c a = 2 ( I a b )

Based on (8), the d-current is calculated. First, a general notation for the dq transformation is shown and then the derived for the described specific case notation. The factor of 2/3 is the peak-value scaling coefficient in the dq transformation [14]. Thus, the derivation of the factor for (5) is explained in (8).

I d = 2 3 ( I c a cos ( Θ ) + I a b cos ( Θ + 120 ) + + I b c cos ( Θ + 240 ) ) = = 2 3 ( I c a cos ( 30 ) I a b cos ( 150 ) ) = ( 8 ) = 2 3 ( I a r m 2 cos ( 30 ) I a r m 2 cos ( 150 ) ) = = 1 3 I a r m
Fig. 18. Highlights for alignment with d-axis and d-axis tests

Fig. 18. Highlights for alignment with d-axis and d-axis tests

IV. Alternative Method

As mentioned before, there is the alternative way for performing the measurements. In the alternative method, the rotor must be aligned with the magnetic axis, which was named in the main method as “q-axis” and after alignment it must be mechanically fixed in this position. The measurements for d- and q-axes have to be performed, but in this case, the magnetic axis initially indicated as “d-axis” become “q-axis” and v.v. Fig. 19 shows the most significant highlights that should be taken into account during the alignment of the rotor with the q-axis. If after alignment and mechanical fixation of the rotor with the q-axis the measurements from Fig. 8 will be completed, then the results that will be observed will be valid for the q-axis, since the rotor is no longer aligned with d-axis, but is fixed perpendicular to d-axis now. Therefore, as mentioned above, d-axis becomes q-axis and v.v. This method, despite all the details, can be very well implemented. Fig. 20 and Fig. 21 show the setup and connections for tests for d- and q-axes correspondingly. By means of the measurement results and using (9) the has been calculated.

Z a r m q ( s ) = Δ u a r m ( s ) Δ i a r m ( s ) Z d ( s ) = 3 2 Z a r m d ( s ) ( 9 ) L d ( s ) = Z d ( s ) R a s R a = 3 2 lim s 0 ( Z a r m d ( s ) )
Fig. 19. Highlights for alignment with q-axis

Fig. 19. Highlights for alignment with q-axis

Fig. 20. Setup and connections for d-axis alternative test

Fig. 20. Setup and connections for d-axis alternative test

Fig. 21. Setup and connections for q-axis alternative test

Fig. 21. Setup and connections for q-axis alternative test

By means of the measurement results and using (10), the has been calculated.

Z a r m q ( s ) = Δ u a r m ( s ) Δ i a r m ( s ) Z q ( s ) = 2 Z a r m q ( s ) ( 10 ) L q ( s ) = Z q ( s ) R a s R a = 2 lim s 0 ( Z a r m q ( s ) )

V. Inductance in Intermediate Rotor Positions between d-axis and q-axis

Additionally to the measurements in d- and q-positions, measurements in intermediate positions of the rotor have been performed. The mean values of the inductances at all frequencies for each position of the rotor have been calculated. The inductance versus rotor position curves that have been obtained during the d-axis and q-axis tests are shown in
Fig. 22. The rotor position dependence of the inductance can be observed, which is analyzed and considered in the separate author’s publication in detail.

VI. Conclusion

This publication represents the know-how for the SSFR test for six phase double delta salient-pole synchronous machines, done on example of the claw-pole alternator. The application was described step by step and explained in detail. The new alignment process for the delta connected windings has been proposed and implemented. The SFFR test has been verified on the test bench and delivered the desired and values, among the other essential electrical machine parameters for required model control (, , et al.).

Fig. 22. Calculated inductances in intermediate positions, measured during execution of d- and q-axis tests

Fig. 22. Calculated inductances in intermediate positions, measured during execution of d- and q-axis tests

References

  1. M. Ghomi, Y.N. Sarem: „Review of synchronous generator parameters estimation and model identification“, Islamic Azad University of Toyserkan, Iran, Universities Power Engineering Conference, 2007. UPEC 2007. 42nd International, 4-6 Sept. 2007, Brighton, [Online]. Available:
    http://ieeexplore.ieee.org/xpls/abs_all.jsp?arnumber=4468951, accessed on 10.02.2015.
  2. R. Grune, H. Einfeld, U. Schäfer: „Standstill frequency response tests for model identification of a synchronous machine“, Electrical Machines (ICEM), 2010 XIX International Conference on, 6-8 Sept. 2010, Rome, [Online]. Available:
    http://ieeexplore.ieee.org/xpl/articleDetails.jsp?tp=&arnumber=5608076, accessed on 19.02.2015.
  3. I.M. Canay: „Determination of model parameters of synchronous machines“, Brown, Boveri and Co. Ltd., Birr, Switzerland, Electric Power Applications, IEE Proceedings B (Volume:130 , Issue: 2 ), 86 – 94, March 1983, [Online]. Available:
    http://ieeexplore.ieee.org/xpls/abs_all.jsp?arnumber=4643591, accessed on 11.02.2015.
  4. I.M. Canay: „Determination of the model parameters of machines from the reactance operators xd(p), xq(p) (evaluation of standstill frequency response test)“, ABB Power Generation Ltd., Baden, Switzerland, IEEE Transactions on Energy Conversion (Volume:8 , Issue: 2 ), 272 – 279, Jun 1993, [Online]. Available:
    http://ieeexplore.ieee.org/xpl/articleDetails.jsp?tp=&arnumber=222718, accessed on 11.02.2015.
  5. IEEE Standard Procedures for Obtaining Synchronous Machine Parameters by Standstill Frequency Response Testing (Supplement to ANSI/IEEE Std 115-1983, IEEE Guide: Test Procedures for Synchronous Machines), IEEE, IEEE Std 115A-1987, 1987, [Online]. Available: http://ieeexplore.ieee.org/xpl/articleDetails.jsp?arnumber=26557, accessed on 24.11.2014.
  6. M. E. Coultes, W. Watson: „Synchronous machine models by standstill frequency response tests“, Ontario Hydro Research Division, Toronto, Ontario, Canada, Power Apparatus and Systems, IEEE Transactions on (Volume:PAS-100 , Issue: 4 ), 1480 – 1489, April 1981, [Online]. Available:
    http://ieeexplore.ieee.org/xpls/abs_all.jsp?arnumber=4110757&tag=1, accessed on 02.02.2015.
  7. F. P. de Mello, L. N. Hannett, J. R. Willis: „Determination of synchronous machine stator and field leakage inductances from standstill frequency response tests“, Power Technol. Inc., Schenectady, NY, USA, IEEE Transactions on Power Systems (Volume:3 , Issue: 4 ), 1625 – 1632, Nov 1988, [Online]. Available:
    http://ieeexplore.ieee.org/xpl/articleDetails.jsp?arnumber=192973, accessed on 10.02.2015.
  8. F. P. de Mello, L. N. Hannett: „Determination of synchronous machine electrical characteristics by test“, Power Technol. Inc., Schenectady, NY, USAIEEE Transactions on Power Apparatus and Systems (Volume:PAS-102 , Issue: 12 ), 3810 – 3815, Dec. 1983, [Online]. Available:
    http://ieeexplore.ieee.org/xpls/abs_all.jsp?arnumber=4111906, accessed on 10.02.2015.
  9. G. Shackshaft, A. T. Poray: „Implementation of new approach to determination of synchronous-machine parameters from tests“, CEGB, System Technical Branch, Planning Department, London, UK, Electrical Engineers, Proceedings of the Institution of (Volume:124 , Issue: 12 ), 1170 – 1178, December 1977, [Online]. Available:
    http://ieeexplore.ieee.org/xpl/articleDetails.jsp?arnumber=5253464, accessed on 09.02.2015.
  10. M. Hasni, O. Touhami, R. Ibtiouen, M. Fadel, S. Caux: „Synchronous machine parameter estimation by standstill frequency response tests“, Laboratoire de Recherche en Electrotechnique — Ecole Nationale Polytechnique 10, Av. Pasteur, El Harrach, Algiers, Algeria, Journal of electrical engineering vol. 59, no. 2, 2008, 75–80, 2008, [Online]. Available:
    http://www.researchgate.net/profile/R_Ibtiouen/publication/224327783_Estimation_of_synchronous_machine_parameter_by_standstill_frequency_response_tests/links/0fcfd5063773766346000000.pdf, accessed on 02.02.2015.
  11. Ed. C. Bortoni, J. A. Jardini: „A standstill frequency response method for large salient pole synchronous machines“, Fed. Univ. of Itajuba, Brazil, Energy Conversion, IEEE Transactions on (Volume:19 , Issue: 4 ), 687 – 691, Dec. 2004, [Online]. Available:
    http://ieeexplore.ieee.org/xpl/articleDetails.jsp?arnumber=1359947, accessed on 04.03.2015.
  12. www.mathworks.de, accessed on 01.01.2014.
  13. D. Bilyi, D. Gerling: „New test bench for vehicle power network with outstanding accuracy, resolution and data rate“, FEAAM GmbH, D- 85577 Neubiberg, Germany, EVS28 KINTEX, Korea, May 3-6, 2015, [Online]. Available:
    https://www.unibw.de/rz/dokumente/getFILE?fid=9293569&fd=kein, accessed on 01.06.2015.
  14. S. Kallio: „Modeling and parameter estimation of double-star permanent magnet synchronous machines“, Doctoral thesis, Lappeenranta University of Technology Acta Universitatis Lappeenrantaensis 570, National Library of Finland National Library Network Services PL 26 (Kaikukatu 4) 00014 University of Helsinki, 2014, Lappeenranta, Finland, [Online]. Available:
    http://www.doria.fi/bitstream/handle/10024/94622/isbn9789522655646.pdf?sequence=2, accessed on 18.02.2015.

Related Articles

Obtaining the Inductance with Dependence on Frequency and Amplitude of the Applied Alternating Current via Measurements and Validation of Considered Non-linearity and Saturation Effects with Lumped Parameter Model

This publication provides the process for obtaining of a self-inductance of electrical machines with a dependence on frequency and amplitude of an applied alternating current and consideration of a non-linearity and saturation effects in the equivalent circuit lumped parameter model that would have the same frequency and time domain characteristic as some desired investigated electrical machine. The values of inductances were calculated from measured impedances for wide ranges of frequencies and currents according to the theory of a complex inductance and iron losses. The measured data were analyzed and summarized in a table and then used for modeling of a automotive alternator. The model was supplied with curve fitted data. The simulation of a common automotive test case was obtained and compared with measurements. Good match between the theory and measurements and reasonability of the suggested approach were confirmed.

Flux Barrier Design Method for Torque Ripple Reduction in Synchronous Reluctance Machines

Abstract—The current publication introduces the flux barrier design method and the concrete design of the synchronous reluctance machine with the reduced torque pulsations. The reviewed method provides the accelerated approach for designing of rotor flux barriers, based on Fast Fourier transforms and simple mathematical expressions. The proposed method has been utilized in the rotor design of synchronous reluctance machine and has shown desired results in reduced torque ripple. The innovative nonsymmetrical geometries for rotor flux barriers created on the basis of proposed flux barrier design method have been implemented and proved as beneficial. Keywords—Flux barriers; torque ripple reduction; FEM; synchronous reluctance machines.

Responses

Deine E-Mail-Adresse wird nicht veröffentlicht. Erforderliche Felder sind mit * markiert