Obtaining the Inductance with Dependence on Frequency and Amplitude of the Applied Alternating Current via Measurements and Validation of Considered Non-linearity and Saturation Effects with Lumped Parameter Model

Abstract — 
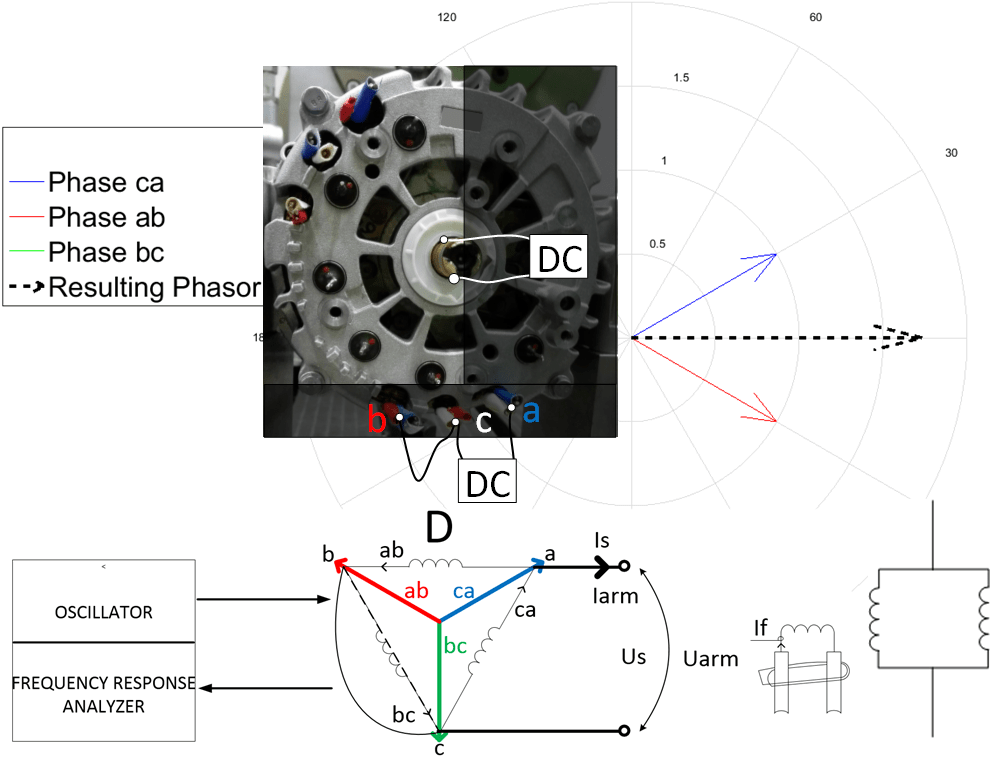
This publication provides the process for obtaining of a self-inductance of electrical machines with a dependence on frequency and amplitude of an applied alternating current and consideration of a non-linearity and saturation effects in the equivalent circuit lumped parameter model that would have the same frequency and time domain characteristic as some desired investigated electrical machine. The values of inductances were calculated from measured impedances for wide ranges of frequencies and currents according to the theory of a complex inductance and iron losses. The measured data were analyzed and summarized in a table and then used for modeling of a automotive alternator. The model was supplied with curve fitted data. The simulation of a common automotive test case was obtained and compared with measurements. Good match between the theory and measurements and reasonability of the suggested approach were confirmed.

Dr. Dimitri Weiss, Munich, Germany

e-mail: info@wiredwhite.com

I. Introduction

High frequency effects occur at high rotational speeds and in many cases cannot be ignored. Reference [1] describes the dependency of synchronous machine inductances from the frequency. It is also known that saturation reduces the inductance of iron core devices at high flux densities, which leads to the necessity to take those factors – in the context of the model developing of electrical machines – into account. Investigations made on permeability of ferromagnetic materials at saturation confirm the importance of studying this topic since with the change of permeability the value of the stator self-inductance also changes.

At this point it should be clarified that the term self-inductance refers to the so-called “operational inductance”. References [2]-[4] describe the nonlinearity of ferromagnetic materials based on the Stoletov curve (s. Fig. 1). The Stoletov curve says that when the intensity of the magnetic field increases, the value of the permeability rapidly increases until it reaches its maximum, and then slowly decreases to a

H

Fig. 1. Permeability of ferromagnetic materials with saturation

very small value. Consequently, model developers should consider, that the inductance of the electrical machine changes (decreases) with the saturation of the magnetic core (stator) and the value of the self-inductance should be adapted to the value of electric current of the stator phase.

There is a definition that magnetic permeability is a generic term that represents a number of different measured properties also called as specific quotient B/H [5], [6]. Because of the nonlinearity of magnetic materials the relative permeability strongly differs depending also on the type of material [5]. References [5], [6] describe many characteristic data and main properties of different types of alloys of magnetic materials, as well as measurement methods for obtaining parameters, testing and verification of properties of the electrical steel.

The complex permeability is the elegant way to take high frequency magnetic effects into consideration. Although, at low frequencies in a linear material the magnetic field strength H and the magnetic flux density B are proportional to each other through some scalar permeability, at high frequencies B and H will react to each other with some phase shift, so the permeability becomes a complex number [7]-[10].

Magnetization lags behind in phase from the magnetic field as well. This phenomenon is called paramagnetic relaxation that affects the loss factor tan δ that depends on the frequency [9], [11].

The ratio of the imaginary to the real part of the complex permeability corresponds to the loss factor tan δ [9].

At high frequencies a reduction of the permeability can occur correlated with an increase of the loss factor [9].

Correlation between losses, complex permeability and electron diffusion in power ferrites are well described in [12].

Thus, increasing the frequency results in different types of losses, like hysteresis loss (also called remagnetizing losses), which occurs based on movement of domain walls, changing of magnetic dipole moment orientation between two Bloch walls a.o. related magnetic effects, Eddy-current loss, which is proportional to ω2 and magnetic after-effect loss, which occurs due to the relaxation time phenomenon [9], [11], [13].

All those losses that are correlated to the frequency, can be considered based on the complex permeability, which is correlated to the inductance in the investigated lumped model.

Several different methods of calculating iron losses from e.g. finite element flux density plots are provided in [14]. Numerical calculations of iron losses are described in [15] and demonstrate the increase of iron losses with the frequency. The solid overview and comparison of iron loss models for electrical machines is described in [16].

In this case the lumped element model of the inductance includes a lossless ideal inductance in series with the equivalent series resistance, which represents losses in the inductance and depends on the angular frequency of the applied AC and on the complex permittivity, which in its case is usually a complicated function of the frequency, as well. Accordingly, the equivalent series resistance represents quantity of the loss due to the dielectric’s conduction electrons as well as due to the bound dipole relaxation [13]. Thus, the lumped element model of the inductance is applied as a complex inductance.

For the developing of valid control algorithms for electrical machines, accurate obtained machine parameters play a major role. In case of HF injection control method, as well as in case of control algorithms based on model predictions, the nonlinearity of inductances is essential and should be considered by e.g. frequency response analysis of inductances [17].

II. Obtaining of Inductance

For obtaining the nonlinearity of the stator self-inductance the impedance was measured for different frequencies and currents. Fig. 2 shows the exploded view of the investigated claw pole alternator. For the test case, all alternator phases were disconnected, to avoid undesirable coupling effects. For calculation of the self-inductance of the stator, one phase of the stator winding was supplied with different AC-voltages. Current, voltage, frequency and the phase shift were measured.

A. Measurements on test bench

Fig. 3 shows a photo of the built test bench that was used for measurements of complex impedances and acquisition of the inductance values. The test bench consists of a power converter that was producing the sinusoidal oscillations of different frequencies and amplitudes and current and voltage sensing devices. The frequency and the phase shift between

Fig. 2. Exploded view of the investigated claw pole alternator

Fig. 3. Photo of test bench used for measurements

current and voltage were measured with an oscilloscope and a high performance power analyzer.

From Table I it can be observed which frequencies were oscillated. For each frequency the currents 10 A, 25 A, 40 A and 80 A were measured.

B. Phasor diagram for test case

For better explanation and interpretation of the measurements, the phasor diagram during the measurement of stator self-inductance must be considered. From the literature it is known that an inductance and an ohmic resistance are parts of a complex impedance and ideally build the right triangle in a polar coordinate system [18], [19].

Fig. 4 demonstrates the described relationship qualitative on the complex plane. It can be seen that the complex reactance X can be calculated from measured complex impedance Z, and it is known that the self-inductance can be calculated from the complex reactance X [19].

Fig. 4. Phasor diagram during the measurement of stator self-inductance in complex plane (qualitative theoretical presentation)

C. Equivalent circuit diagram for test case

Fig. 5 shows the equivalent circuit diagram of tested electrical machine for the performed test case. It consists of the stator self-inductance L_self, stator leakage inductance L_σs, stator ohmic resistance R_s and resistance R_FE that represents iron losses.

From the literature, as said before, it is well known that iron losses depend on the current and frequency [20]. Due to the fact that iron losses, represented as a ohmic resistance, are included in the measured complex impedance Z, the variable Z also changes with the frequency.

D. Calculation of inductance and post-processing

For obtaining of self-inductance values two different sets of equations were applied.

Equation (1) describes the procedure of calculation of the complex inductance. For this approach the phase angles of the complex current and voltage are required [19].

Z = U I = U ˆ e j ( ω t + φ u ) I ˆ e j ( ω t + φ i ) = R + j X = R + j ω L ( 1 )

The final expression for calculating the stator self-inductance is shown in (2):

L = Z R j ω ( 2 )

After the complex impedance Z and complex reactance X were calculated for each frequency the phasor diagrams in complex plane were verified using MATLAB. Fig. 6 shows the phasor diagram created for one specific frequency. It can be seen that on low frequencies the angle between the complex reactance and the ohmic resistance is near by 90 deg.

Fig. 7 shows the phasor diagram created for a one single high frequency 1292 Hz. This time the angle between the phasors X and R is less than 90 deg. The complex reactance X includes iron losses.

This approach is used to create an equivalent circuit lumped parameter model, that would have the same frequency and time domain characteristic as the investigated electrical machine [1]. Resistive component R of the measured impedance Z also changes with the frequency, but for the equivalent circuit only the value of R at low frequency is valid [1]. Thus, all nonlinear effects and effects related to losses were taken into account inside the reactance X.

Fig. 8 shows Bode magnitude plot and Bode phase plot for the stator self-inductance measured at current 25 A. This figure demonstrates the measurement results and verifies the frequency dependence of the stator self-inductance.

Fig. 5. Equivalent circuit diagram of tested electrical machine

Fig. 6. MATLAB verified phasor diagrams during the measurement of stator self-inductance for low frequencies

Fig. 7. MATLAB verified phasor diagrams during the measurement of stator self-inductance for high frequencies

Fig. 8. Bode magnitude plot and Bode phase plot for stator self-inductance measured at current 25 A

If measurements of the current and voltage phase angles are difficult or if the desired equipment is missing, the self-inductance can be calculated with (3)-(5) [19]:

Z = R 2 + X 2 = U r m s I r m s ( 3 ) | X | = Z 2 R 2 = ω L ( 4 ) L = Z 2 R 2 ω ( 5 )

The downside of the approach with this set of equations is that the complex AC circuit analysis cannot be performed without the measured phase angles.

Table I provides the measurement results for the stator self-inductance, calculated on the complex plane and as the real number, as well as the mean absolute percentage error between the magnitudes.

TABLE I Self-Inductance Calculated in Complex Form and as Real Number

After measurements were performed, the inductance was modeled as a lookup table block. For modeling the frequency beyond the measured range the measurement data were interpolated and curve fitted. Fig. 9 shows interpolated and fitted curves of frequency versus self-inductance measured at current 25 A.

Fig. 10 shows fitted curves of frequency versus self-inductance measured at all currents. Due to the permeability of ferromagnetic materials the value of the self-inductance increases first and then decreases.

III. Validation within Model and Measurements

After the nonlinearities, saturation and frequency dependencies were measured and considered in the automotive power network model, the simulations were performed and modeling results were obtained. Fig. 11 shows model of the six-phase alternator, parameters of which were measured. For proper operation of the model the vehicle excitation current circuit with control was additionally modeled (s. Fig. 12). Fig. 13 introduces the equivalent circuit diagram of modeled vehicle power network. It consists of a model of the six-phase generator (claw-pole alternator), a model of the excitation current control, models of two parallel passive rectifier bridges, a current-controlled load, a resistive-inductive load, a resistive load, a block for a nickel-

Fig. 9. Interpolated and fitted curves of frequency versus self-inductance measured at current 25 A

Fig. 10. Fitted curves of frequency versus self-inductance measured at all currents

metal hydride battery, various current and voltage sensors and numerous oscilloscopes for monitoring of all important parameters of the vehicle power network. After the accuracy of the model has been proved, a simulation of automotive-typical test case called “influence of alternator on start performance of ICE” (ICE stays for “internal combustion engine”) was accomplished (s. Fig. 14).

What is exactly referred to the test case “influence of alternator on start performance of ICE” has no significance on this publication and because of lack of space, this will be explained in detail in a separate publication in the future. Nevertheless, the simulation results were verified on the test bench that was previously built, tested and described in other author’s publication in [21]. Fig. 15 shows the measurement

Fig. 11. Model of the six-phase alternator

Fig. 12. Model of vehicle excitation current circuit with control

Fig. 13. Model / equivalent circuit diagram of vehicle power network

Fig. 14. Simulation of automotive-typical test case called “influence of alternator on start performance of ICE”

results of the equivalent automotive-typical test case “influence of alternator on start performance of ICE”, simulated previously. The solid qualitative match between the measurements and simulation can be observed.

Fig. 15. Measurement results of automotive-typical test case called “influence of alternator on start performance of ICE” taken from [21]

IV. Conclusion

In this publication the inductance dependency on frequency and amplitude of the applied AC voltage, as desired object of investigation, was studied. The high frequency effect on the inductance was investigated and approved as essential. The measured values were fed into the simulation, which demonstrated very satisfying correlation between the simulated model with obtained parameters and the measurements.

V. References

[1]   IEEE Standards Board: „IEEE Standard Procedures for Obtaining Synchronous Machine Parameters by Standstill Frequency Response Testing (Supplement to ANSI/IEEE Std 115-1983, IEEE Guide: Test Procedures for Synchronous Machines)“, IEEE, IEEE Std 115A-1987.

[2]   J.C. Poggendorff: „Annalen der Physik und Chemie“, Dr. A. Stoletow, Ueber die Magnetisirungsfunction des weichen Eisens, insbesondere bei schwächeren Scheidungskräften, 1872, [Online]. Available: http://onlinelibrary.wiley.com/doi/10.1002/andp.18722220706/abstract, (in German), accessed on 04.02.2016.

[3]   G.S. Krinchik: „Physics of Magnetic Phenomena“, Moscow State University Press, 1976, Moscow, (in Russian), accessed on 04.02.2016.

[4]   S. Vonsovsky: „Magnetism“, Nauka, 1971, Moscow, (in Russian), accessed on 04.02.2016.

[5]   C. Moosbrugger, F. Cverna: „Electrical and Magnetic Properties of Metals“, ASM International, December 2000.

[6]   P. Beckley: „Electrical Steels for Rotating Machines“, Institution of Engineering & T, 2002.

[7]   N. Bowler: „Frequency-Dependence of Relative Permeability in Steel“, Iowa State University, Center for Nondestructive Evaluation, Applied Sciences Complex II, 1915 Scholl Road, Ames, IA 50011, USA.

[8]   R. Sato Turtelli, R. Groessinger, C. Kussbach: „Study of frequency dependencies of the complex magnetic ac-permeability aftereffect in amorphous Fe64Co21B15 and Fe8Co77B15 alloys“, Institut fuer Experimentalphysik, Technische Universitaet Wien, Wiedner Hauptstrasse 8-10, A-1040 Vienna, Austria, 1998, [Online]. Available: http://www.if.ufrj.br/~jps/jps/PDF/Study%20of%20frequency%20dependencies%20of%20the%20complex%20magnetic%20ac-permeability%20aftereffect%20in%20amorphous%20Fe64Co21B15%20and%20Fe8Co77B15%20alloys.pdf, accessed on 18.02.2016.

[9]   M. Getzlaff: „Fundamentals of Magnetism“, Springer Berlin Heidelberg; Auflage: 1 (20. September 2007).

[10]   J. Chang-Jun, F. Xiao-Long, X. De-Sheng: „High frequency magnetic properties of ferromagnetic thin films and magnetization dynamics of coherent precession“, Key Lab for Magnetism and Magnetic Materials of the Ministry Education, Lanzhou University, Lanzhou 730000, China, Chin. Phys. B Vol. 24, No. 5 (2015) 057504, [Online]. Available: http://cpb.iphy.ac.cn/fileup/PDF/2015-5-057504.pdf, accessed on 22.02.2016.

[11]   A. J. Dekker: „Solid State Physics“, the macmillan press ltd., [Online]. Available: http://link.springer.com/chapter/10.1007%2F978-1-349-00784-4_20, accessed on 22.02.2016.

[12]   H. Meuche, M. Esguerra: „Correlation between Losses, Complex Permeability and. Electron Diffusion in Power Ferrites“, Journal de Physique IV, 1997, 07 (C1), pp.C1-95-C1-98, [Online]. Available: https://hal.archives-ouvertes.fr/jpa-00254981/document, accessed on 18.02.2016.

[13]   A.S. Vasilevsky: „Fizika Tverdogo Tela“, Drofa, 2010, (in Russian), accessed on 22.02.2016.

[14]   P.A. Hargreaves, B.C. Mecrow, R. Hall: „Calculation Of Iron Loss In Electrical Generators Using Finite Element Analysis “, 2011 IEEE International Electric Machines & Drives Conference (IEMDC), [Online]. Available: http://www.ncl.ac.uk/eee/assets/posters/paper7b.pdf, accessed on 18.02.2016.

[15]   M. H. Gracia, E. Lange, K. Hameyer: „Numerical calculation of iron losses in electrical machines with a modified post-processing formula“, in 16th Conference on the Computation of Electromagnetic Fields, 2007, [Online]. Available: http://134.130.107.200/uploads/bibliotest/2007MHGModified.pdf, accessed on 18.02.2016.

[16]   A. Krings; J. Soulard: „Overview and Comparison of Iron Loss Models for Electrical Machines“, KTH Royal Institute of Technology Teknikringen 33, SE-100 44 Stockholm, Sweden, EVER, 2010, [Online]. Available: http://www.diva-portal.org/smash/get/diva2:473007/FULLTEXT01.pdf, accessed on 18.02.2016.

[17]   X. Wang, W. Xie, G. Dajaku, R. M. Kennel, D. Gerling, R. D. Lorenz: „Position Self-Sensing Evaluation of Novel CW-IPMSMs With an HF Injection Method“, Industry Applications, IEEE Transactions on (Volume:50 , Issue: 5 ), 2014.

[18]   W. Weißgerber: „Elektrotechnik für Ingenieure 2: Wechselstromtechnik, Ortskurven, Transformator, Mehrphasensysteme. Ein Lehr- und Arbeitsbuch für das Grundstudium“, Vieweg+Teubner Verlag Springer Fachmedien Wiesbaden, 2013, (in German).

[19]   H. Czichos, M. Hennecke: „Hütte. Das Ingenieurwissen“, Springer; Auflage: 33, 19. Oktober 2007, (in German).

[20]   D. Gerling: „Electrical Machines Mathematical Fundamentals of Machine Topologies“, Springer, 2015.

[21]   D. Bilyi, D. Gerling: „New Test Bench for Vehicle Power Network with Outstanding Accuracy, Resolution and Data Rate“, FEAAM GmbH, D-85577 Neubiberg, Germany, EVS28 KINTEX, Korea, May 3-6, 2015, [Online]. Available: https://www.unibw.de/rz/dokumente/getFILE?fid=9293569&fd=kein, accessed on 01.06.2015.

Any Questions?

If you have any doubts or facing any problems, please do not hesitate to give WiredWhite a message.

Connect with us on LinkedInhttps://www.linkedin.com/company/wiredwhite/

Related Articles

Standstill Frequency Response Test for Obtaining Parameters of Six Phase Double Delta Salient-Pole Synchronous Machine on Example of Claw-Pole Alternator

The current publication introduces an approach for obtaining parameters of a six phase double delta salient-pole synchronous machine, based on the standstill frequency response test. The described approach was verified by measurements on a automotive claw-pole alternator, done in a laboratory on a test bench.

Flux Barrier Design Method for Torque Ripple Reduction in Synchronous Reluctance Machines

Abstract—The current publication introduces the flux barrier design method and the concrete design of the synchronous reluctance machine with the reduced torque pulsations. The reviewed method provides the accelerated approach for designing of rotor flux barriers, based on Fast Fourier transforms and simple mathematical expressions. The proposed method has been utilized in the rotor design of synchronous reluctance machine and has shown desired results in reduced torque ripple. The innovative nonsymmetrical geometries for rotor flux barriers created on the basis of proposed flux barrier design method have been implemented and proved as beneficial. Keywords—Flux barriers; torque ripple reduction; FEM; synchronous reluctance machines.

Responses

Deine E-Mail-Adresse wird nicht veröffentlicht. Erforderliche Felder sind mit * markiert