Modeling and Simulation of Vehicle Power Network in Simulink MATLAB

Abstract—This publication describes the developed general model of the vehicle power network in Simulink MATLAB. The developed model includes most significant components of 12 V electrical network, such as alternator, rectifier, loads and battery, designed in form of sub-models. The vehicle power network model has a modular design, so single sub-models can be replaced easily. The quality of the developed model has been verified by comparison of simulation results with measurement results on the test bench. Modeling of every single component, such as the sub-model of the alternator or the sub-model of the excitation current control, as well as functioning principle of the vehicle power network and simulated automotive-typical test case will be described in detail in the following publication.

Keywords-modeling; simulation; six-phase salient pole generator; vehicle power network; measurements on test bench

I.  Introduction

For the development and design of vehicle-electrical network simulation is a very important tool. The generator is a key component in the power grid, therefore the presence or development of generator models is an important part of the development process and is of interest of this publication. For the investigation of the vehicle power network, an already developed by the author and described in [1] model for analysis of power electronics and loss calculation has been used and extended with sub-models of a vehicle alternator, an alternator PI-control, additional dynamic electronic loads and a model-block for a nickel-metal hydride battery (s. Fig. 1).

Figure 1. Equivalent circuit diagram of vehicle power network

The created Simulink/MATLAB model of the vehicle power network has a symbiotic structure, consisting of analytical calculations, lumped parameter models of power network components and SimPowerSystems-blocks. After the accuracy of the model has been proved, a simulation of automotive-typical test case called “influence of alternator on start performance of ICE” (ICE stays for “internal combustion engine”) has been accomplished. The simulation results have been verified on the test bench that was previously built, tested and described in the other author’s publication [2]. The simulation results and the performed previously measurement results of the equivalent automotive-typical test case “influence of alternator on start performance of ICE” will show the solid qualitative match between measurements and simulations.

II. Main Components of Vehicle Power Network Model

The developed Simulink/MATLAB model of the vehicle power network includes:

  • Model of a six-phase salient pole generator (claw-pole alternator)
  • Model of an excitation current control (recreated as in a real vehicle)
  • Two parallel connected passive rectifier bridges
  • One current-controlled load
  • One resistive-inductive load
  • One resistive load
  • Block for a nickel-metal hydride battery
  • Various current and voltage sensors
  • Numerous oscilloscopes for monitoring of all important parameters of a vehicle power network.

A. Equivalent Circuit Diagram of Excitation Current Control

Fig. 2 shows equivalent circuit diagram of automotive excitation current circuit with control. In which:

R_b1, R_b2-contact resistances of the brushes [3]
R_f-ohmic resistance of the excitation winding
L_f-self-inductance of the excitation winding
I_f-excitation current

Figure 2.  Equivalent circuit diagram of automotive excitation current circuit with control.

B. Model of Six-phase Generator (Claw-pole Alternator) with Control

The model of the alternator is realized as a six-phase model that simulates each phase individually (s Fig. 3). The phase voltages are modeled based on (1) [4]:

whereas the angular frequency ω is calculated on the basis of (2) [4], [5].

L_s and R_s represent the stator self-inductance and the ohmic resistance of one phase of the investigated six-phase alternator. The values for L_s and R_s are determined experimentally (measured on the alternator) and based on FEM model [6], [7]. The inductance nonlinearity that occurs with saturation of the magnetic material is also taken into account (s. Fig. 4). Utilizing (3) the current flowing through the armature or field winding has been calculated [5]. Right after the current value was obtained the inductance value has been adjusted taking into account the nonlinearity effects.

Fig. 5 introduces the model of the six-phase alternator. As input data for the model simulation, the reference input values of the generator rotational speed “n_Gen_soll_” and the actual value of the excitation current “I_f_after_Limitation” (that is necessary for the desired operating point) are applied. The reference value for the generator speed “n_Gen_soll_” is set depending on the test case with either a constant or a speed-time curve. The actual value of the excitation current “I_f_after_Limitation” is calculated in the model of the automotive excitation current circuit with control (s. Fig. 6).

The both of the input values “n_Gen_soll_” and “I_f_after_Limitation” are used for calculation of the internal machine voltage. From [8] it is known that the main function of the voltage control is to keep the vehicle power network voltage constant, by means of generator voltage, independently from an electrical load, across the entire speed range of the vehicle combustion engine or the traction drive. The excitation current is controlled by the duty cycle of the excitation output stage transistor (further called EOST).

From [3] it is known that the switching frequency of the EOST is 1000 Hz. Since this type of excitation current control involves the turn on and off of the EOST, this control is called “on-off control”. Despite the rapid switching on and off of the EOST, the excitation current changes after a certain hysteresis (s. Fig. 7). Therefore, the term “hysteresis control” for the vehicle alternator excitation current control circuit is also accurate applicable.

Fig. 6 represents the model of automotive excitation current circuit with control. The duty cycle of the EOST is controlled by the PI-controller. A 10.6 V trigger voltage is also provided in the control loop, as it exists in the vehicle alternator control loop, and the aim of the represented vehicle power network model was the reproduction of the functionality of such control.

This means that the operation start of the generator and the control will only be carried out when the reference value of the generator voltage is greater than 10.6V, “U_DC_soll_”>10.6 V (s. Fig. 6). As already described, the actual value of the excitation current “I_f_after_Limitation” is further sent to the model of the alternator and is regarded as the second input for the model of the six-phase alternator (s. Fig. 5). “I_f_after_Limitation” is the actual value of the excitation current, which is limited to the value of 7.75 A.

Figure 3. Six-phase equivalent circuit of alternator stator.
Figure 4. Model of a nonlinear inductance.
Figure 5. Model of six-phase alternator.
Figure 6. Model of automotive excitation current circuit with control.
Figure 7. PWM signal and actual value of excitation current (simulation results).

C. Model of Rectifier Bridges

In the main vehicle power network model, successively to the model of the six-phase alternator stator, two models of passive rectifier bridges, which mostly consist of Zener or Schottky diodes, are connected [10], [11]. One of two identical models of the rectifier bridges is shown in Fig. 8. Both models of rectifier bridges additionally include numerous sensors that indicate instantaneous and mean values of voltages and currents of a single diode as well as of the entire bridge.

Figure 8. Model of automotive rectifier bridge.

D. Remaining Components of Vehicle Power Network

After rectifiers, three different loads and a vehicle battery block are connected on the vehicle power network DC-side. The first electronic load (“eLoad0”) is used in a current-controlled operation mode, so desired automotive-typical test cases, in which a continuous constant invariable load current during the entire test is required, can be easily simulated (s. Fig. 9). Each electronic load includes voltage and current sensors, which provide instantaneous and mean values.

Figure 9. Model of current-controlled load with sensors.


Fig. 10 shows the entire model/equivalent circuit diagram of the automotive vehicle power network without control circuit, where the interconnection of the individual blocks and models can be seen. For monitoring of the main and most important parameters of the vehicle power network, the model includes numerous oscilloscopes, which are placed in Simulink/MATLAB model very compact and clearly (s. Fig. 11). Herewith, all measurement blocks are grouped in instant values, mean values and typical automotive important data. Moreover, one scope block is intended to obtain the data, which are essential for the particular investigated test case.

Figure 10. Model/equivalent circuit diagram of automotive vehicle power network without control circuit.
Figure 11. Numerous oscilloscopes for monitoring of all important parameters of vehicle power network.

III. Verification of the Model and Simulation Results

Fig. 12-Fig. 15 show the simulation results, which are obtained under the following boundary conditions (4):

The timecourses of voltages “U_DC_soll” and “U_DC_ist”, as well as of the excitation current and duty cycle confirm the correctness of the implemented in the model current control. Fig. 15 shows the simulation results of the timecourses of the main and most important currents and voltages of the vehicle power network model. It can be observed that the alternator generates 80 A (“I_Gen_mean”).
Thereby, the vehicle battery is being charged with the current of 60 A (“I_Bat_mean”) and the electronic load draws the current of 20 A (“I_Load1_mean”). The reference value of the vehicle power network DC-voltage (“U_DC_soll_”) is being controlled at the value of 13.5 V (s. “B+_mean”). Thereby, these simulation results allow the verifying the correctness and proper functioning of the developed vehicle power network model.

IV. Simulation of Automotive-typical Test Case

After the accuracy of the model was verified, a simulation of an automotive-typical test case called “influence of alternator on start performance of ICE” has been performed. The ICE must develop a relatively large torque during the starting process. Since the alternator is mechanically fixed and coupled to the ICE, it must be ensured, that the alternator will remain in “switched off” during the startup process, and thus does not resist the torque development of the ICE [11].

Therefore, this test case is especially interesting. What the test case “influence of alternator on start performance of ICE” is about is explained as follows. Initially, the ICE and the alternator are off. At the 4 s the ICE (realized in the laboratory by a DC-motor, s. [2]) has been started. Thereby, the reference value of the speed  “nreference“, which represents the first input value for the Simulink/MATLAB model, changes according to a detailed speed profile for starting of a real ICE.

After the ICE has reached its idle speed (s. “nactual“ in Fig. 16), the alternator starts (at the 7 s in Fig. 16). “Ureference“-reference value of the alternator voltage, which represents the second input value for the Simulink/MATLAB model, starts with the value of 10.6 V the increasing of its reference value, according to a programmed profile (starting at 7 s in Fig. 16). “Uactual“-is the actual value of the alternator voltage on the power network DC-side of the Simulink/MATLAB model, which is measured in the model with the appropriate voltage sensor block (s Fig. 16).

Figure 12. Duty Cycle in [%] and PWM signal (simulation results).
Figure 13. Timecourse of excitation current in [A] (simulation results).
Figure 14. Timecourse of “U_DC_soll” (black curve) and “U_DC_ist” (red curve) in [V] (simulation results).
Figure 15. Timecourses of main currents and voltages of vehicle power network model (simulation results).
Figure 16. Simulation of automotive-typical test case called “influence of alternator on start performance of ICE”.

V. Comparison with Measurement of Automotive-typical Test Case

After the simulation of the test case “influence of alternator on start performance of ICE”, the simulation results have been verified in the laboratory. Fig. 17 represents the obtained and recorded during the laboratory experiment time characteristics and timecourses of the generator voltage, current, speed and workload (“Generator usage”) [2].

Figure 17. Measurement results of automotive-typical test case called “influence of alternator on start performance of ICE” taken from [2].

VI. Conclusion

In the following publication modeling and simulation of the vehicle power network have been performed in Simulink/MATLAB. The listed topics and results have been investigated and obtained:

  • The model of the vehicle power network in Simulink/MATLAB has been developed.
  • The components of the 12 V electrical network, such as alternator, rectifier, loads and battery have been developed and included in the main model in form of sub-models.
  • The simulation of the automotive-typical test case called “influence of alternator on start performance of ICE” has been performed.
  • The simulation results have been compared with the measurement results, previously obtained from the performed measurements on the test bench [2].
  • The quality of the developed model has been verified.
  • The simulation results show the solid qualitative match with measurements.

The proposed model can be utilized for modeling, simulation, analysis and development of electric vehicle or hybrid vehicle power networks.

Contact us to find out more about our engineering know-how and how we can support you.

Publication is also available on IEEE Xplore.

References

[1] D. Bilyi, D. Gerling: „Modeling of automotive power network for analysis of power electronics and losses calculation and verification by measurements on claw-pole alternator“, FEAAM GmbH, D-85577 Neubiberg, Germany, 8th International Power Electronics and Motion Control Conference 2016 – ECCE Asia (IPEMC 2016-ECCE Asia), May 22-25, 2016, in press.

[2] D. Bilyi, D. Gerling: „New test bench for vehicle power network with outstanding accuracy, resolution and data rate“, FEAAM GmbH, D-85577 Neubiberg, Germany, EVS28 KINTEX, Korea, May 3-6, 2015, [Online]. Available:
https://www.unibw.de/rz/dokumente/getFILE?fid=9293569&fd=kein, accessed on 01.06.2015.

[3] M. G. Unutulmaz, L. T. Ergene: „Excitation current control of a claw pole automotive alternator“, Ford Otomoti v Sanayi A. $., Kocaeli, Turkiye, 2013 3rd International Conference on Electric Power and Energy Conversion Systems, Yildiz Technical University, Istanbul, Turkey, October 2-4, 2013, [Online]. Available:
ieeexplore.ieee.org/xpl/articleDetails.jsp?arnumber=6713044, accessed on 01.10.2014.

[4] F. Taegen: „Einführung in die Theorie der elektrischen Maschinen II: Synchron- und Asynchronmaschine“, Vieweg + Sohn Braunschweig, 1971, Braunschweig, Germany, (in German), accessed on 01.11.2012.

[5] D. Gerling: „Electrical machines mathematical fundamentals of machine topologies“, Springer, 2015 (14. November 2014), accessed on 10.01.2016. 

[6] D. Bilyi, D. Gerling: „Standstill frequency response test for obtaining parameters of six phase double delta salient-pole synchronous machine on example of claw-pole alternator“, FEAAM GmbH, D-85577 Neubiberg, Germany, 2016 IEEE Symposium on power electronics electrical drives automation and motion SPEEDAM 2016, June 22-24, 2016, Capri Island, Italy, in press.

[7] D. Bilyi, V. Bilyi, D. Gerling: „FEM based model development and co-simulation of automotive multi-phase claw-pole alternator and rectifier“, FEAAM GmbH, D-85577 Neubiberg, Germany, Universitaet der Bundeswehr Muenchen, Chair of electrical drives and actuators, D-85577 Neubiberg, Germany, 2016 IEEE Transportation Electrification Conference and Expo ITEC 2016, 27-29 June 2016, Dearborn, Michigan, USA,  in press.

[8] K. Reif: „Bosch Autoelektrik und Autoelektronik: Bordnetze, Sensoren und elektronische Systeme 6. Auflage“, Bosch, Vieweg+Teubner Verlag; Auflage: 6., überarb. u. erw. Aufl. 2011 (16. Dezember 2010), (in German), accessed on 01.01.2013.

[9] Rohm Co., Ltd.: „Schottky barrier diodes zener diodes“, ROHM, Discrete Semiconductors, Product Catalog, 2010, [Online]. Available: https://www.silica.com/fileadmin/02_Products/Productdetails/Microchip/Silica_ROHM_ze-sbd_catalog_2010.pdf, accessed on 01.01.2013.

[10] Hueco: „Alternatorparts“, Hueco, [Online]. Available:
http://www.kosser.net/sites/default/files/catalogs/KatalogGeneratorteile2009_05.pdf, accessed on 01.01.2015.

[11] Bosch: „Bosch-Multifunktionsregler“, 2003_2.pdf, [Online]. Available: http://aa.bosch.de/aa/de/Berufsschulinfo/media/2003_2.pdf, (in German), accessed on 22.12.2014.

Related Articles

Standstill Frequency Response Test for Obtaining Parameters of Six Phase Double Delta Salient-Pole Synchronous Machine on Example of Claw-Pole Alternator

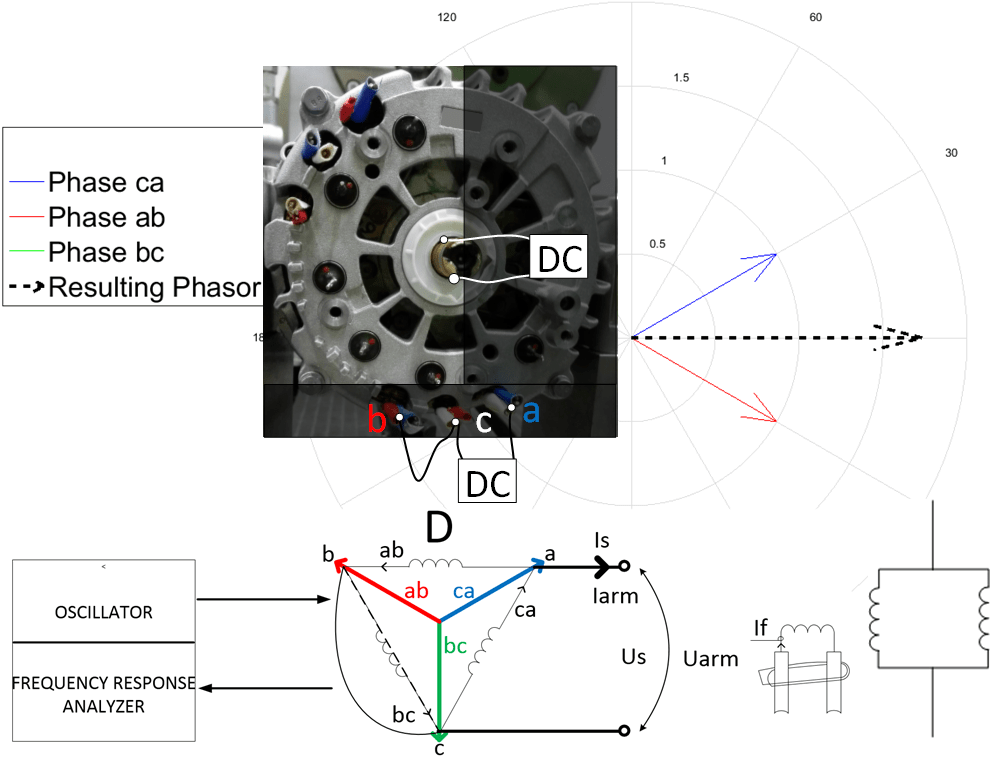
The current publication introduces an approach for obtaining parameters of a six phase double delta salient-pole synchronous machine, based on the standstill frequency response test. The described approach was verified by measurements on a automotive claw-pole alternator, done in a laboratory on a test bench.

Obtaining the Inductance with Dependence on Frequency and Amplitude of the Applied Alternating Current via Measurements and Validation of Considered Non-linearity and Saturation Effects with Lumped Parameter Model

This publication provides the process for obtaining of a self-inductance of electrical machines with a dependence on frequency and amplitude of an applied alternating current and consideration of a non-linearity and saturation effects in the equivalent circuit lumped parameter model that would have the same frequency and time domain characteristic as some desired investigated electrical machine. The values of inductances were calculated from measured impedances for wide ranges of frequencies and currents according to the theory of a complex inductance and iron losses. The measured data were analyzed and summarized in a table and then used for modeling of a automotive alternator. The model was supplied with curve fitted data. The simulation of a common automotive test case was obtained and compared with measurements. Good match between the theory and measurements and reasonability of the suggested approach were confirmed.

Flux Barrier Design Method for Torque Ripple Reduction in Synchronous Reluctance Machines

Abstract—The current publication introduces the flux barrier design method and the concrete design of the synchronous reluctance machine with the reduced torque pulsations. The reviewed method provides the accelerated approach for designing of rotor flux barriers, based on Fast Fourier transforms and simple mathematical expressions. The proposed method has been utilized in the rotor design of synchronous reluctance machine and has shown desired results in reduced torque ripple. The innovative nonsymmetrical geometries for rotor flux barriers created on the basis of proposed flux barrier design method have been implemented and proved as beneficial. Keywords—Flux barriers; torque ripple reduction; FEM; synchronous reluctance machines.

Responses

Deine E-Mail-Adresse wird nicht veröffentlicht. Erforderliche Felder sind mit * markiert